| Param | Original file | Final file |
|---|---|---|
| Filename | modeM0/AS1T05_239T01_9000006444_50555cztM0_level2.fits | modeM0/AS1T05_239T01_9000006444_50555cztM0_level2_quad_clean.evt |
| Size (bytes) | 718,940,160 | 97,139,520 |
| Size | 685.6 MB | 92.6 MB |
| Events in quadrant A | 4,990,430 | 671,272 |
| Events in quadrant B | 4,979,373 | 722,668 |
| Events in quadrant C | 10,527,060 | 424,857 |
| Events in quadrant D | 5,544,374 | 608,828 |
| Mode M0 | |||
|---|---|---|---|
| Quadrant | BADHDUFLAG | Total packets | Discarded packets |
| A | 0 | 19690 | 0 |
| B | 0 | 19951 | 0 |
| C | 0 | 36441 | 0 |
| D | 0 | 21711 | 0 |
| Mode SS | |||
|---|---|---|---|
| Quadrant | BADHDUFLAG | Total packets | Discarded packets |
| A | 0 | 148 | 0 |
| B | 0 | 148 | 0 |
| C | 0 | 148 | 0 |
| D | 0 | 148 | 0 |
| Quadrant | Total seconds | Saturated seconds | Saturation percentage |
|---|---|---|---|
| A | 7375 | 250 | 3.389831% |
| B | 7375 | 369 | 5.003390% |
| C | 7376 | 2957 | 40.089479% |
| D | 7376 | 237 | 3.213124% |
Noise dominated data is calculated using 1-second bins in cleaned event files. If a bin has >2000 counts, and if more than 50% of those come from <1% of pixels, then it is considered to be noise-dominated and hence unusable.
| Quadrant | # 1 sec bins | Bins with >0 counts | Bins with >2000 counts | High rate bins dominated by noise | Noise dominated (total time) | Noise dominated (detector-on time) | Marked lightcurve |
|---|---|---|---|---|---|---|---|
| A | 7375 | 7375 | 157 | 157 | 2.13% | 2.13% | 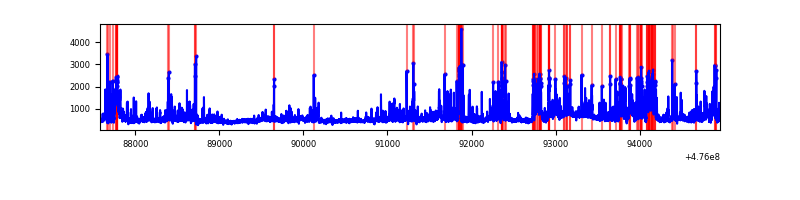 |
| B | 7375 | 7375 | 308 | 308 | 4.18% | 4.18% | 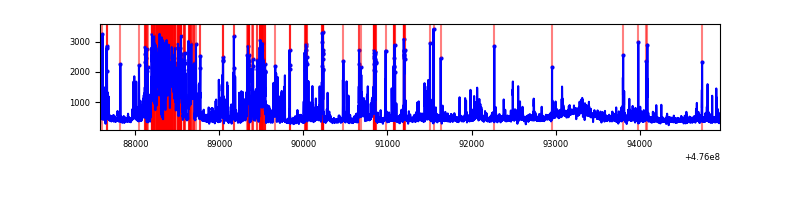 |
| C | 7376 | 7376 | 2179 | 2179 | 29.54% | 29.54% | 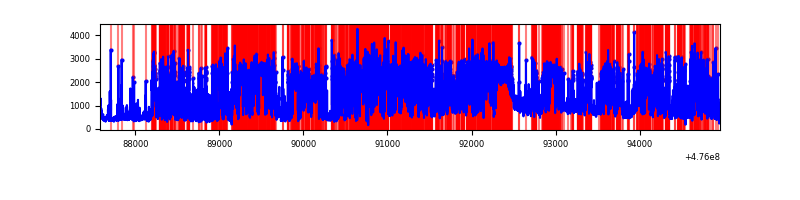 |
| D | 7376 | 7376 | 243 | 243 | 3.29% | 3.29% | 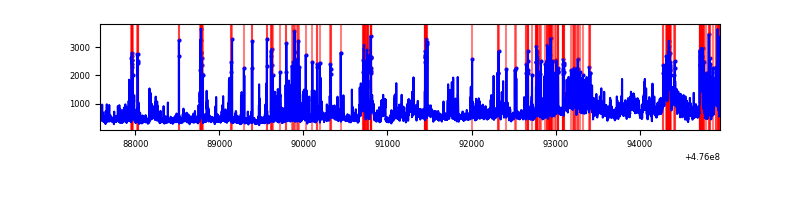 |
Top three noisy pixels from each quadrant. If the there are fewer than three noisy pixels in the level2.evt file, extra rows are filled as -1
| Pixel properties | Quadrant properties | ||||||
|---|---|---|---|---|---|---|---|
| Quadrant | DetID | PixID | Counts | Sigma | Mean | Median | Sigma |
| A | 12 | 250 | 533323 | 2813.9 | 773 | 756 | 189.3 |
| A | 4 | 191 | 198621 | 1045.45 | 773 | 756 | 189.3 |
| A | 4 | 3 | 197066 | 1037.23 | 773 | 756 | 189.3 |
| B | 7 | 0 | 1113831 | 6750.18 | 768 | 740 | 164.9 |
| B | 5 | 185 | 174401 | 1053.14 | 768 | 740 | 164.9 |
| B | 12 | 0 | 126254 | 761.16 | 768 | 740 | 164.9 |
| C | 15 | 214 | 4037321 | 24109.25 | 590 | 586 | 167.4 |
| C | 15 | 178 | 1072965 | 6404.74 | 590 | 586 | 167.4 |
| C | 0 | 208 | 507103 | 3025.15 | 590 | 586 | 167.4 |
| D | 7 | 61 | 664545 | 3207.1 | 745 | 721 | 207.0 |
| D | 7 | 60 | 439439 | 2119.56 | 745 | 721 | 207.0 |
| D | 11 | 161 | 333304 | 1606.79 | 745 | 721 | 207.0 |
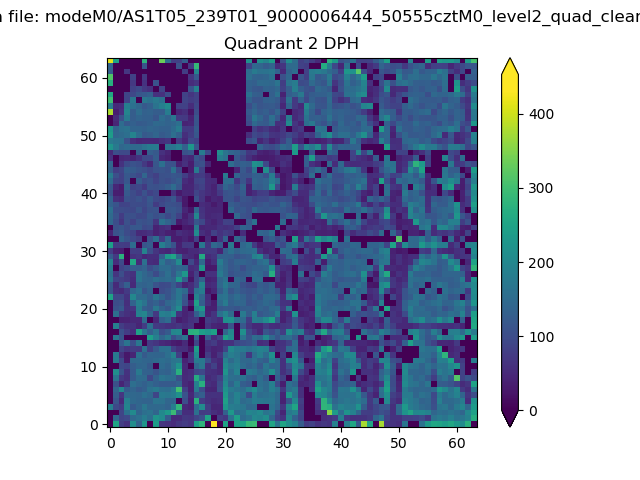
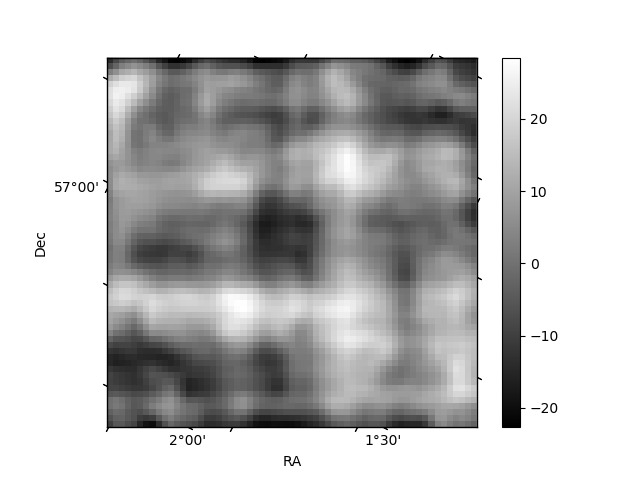
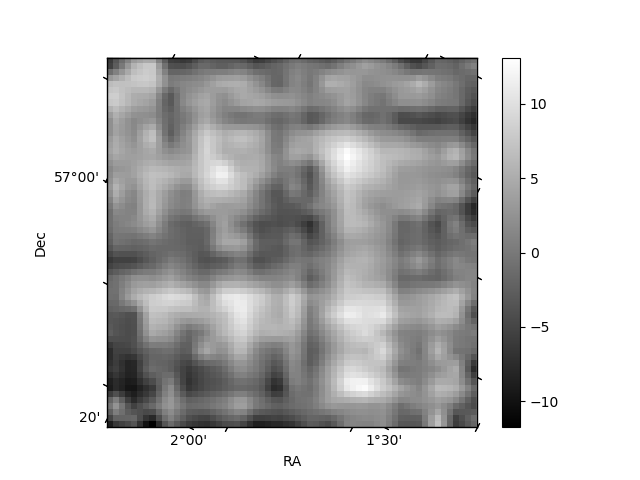
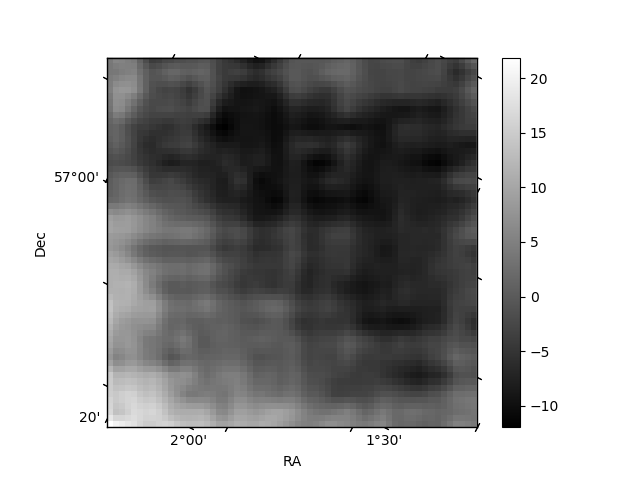
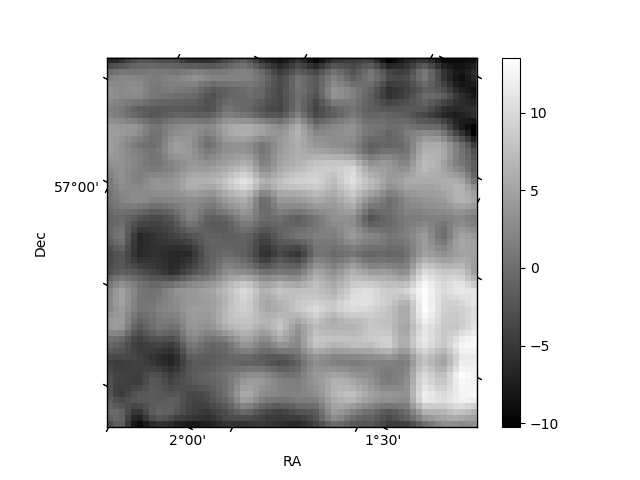
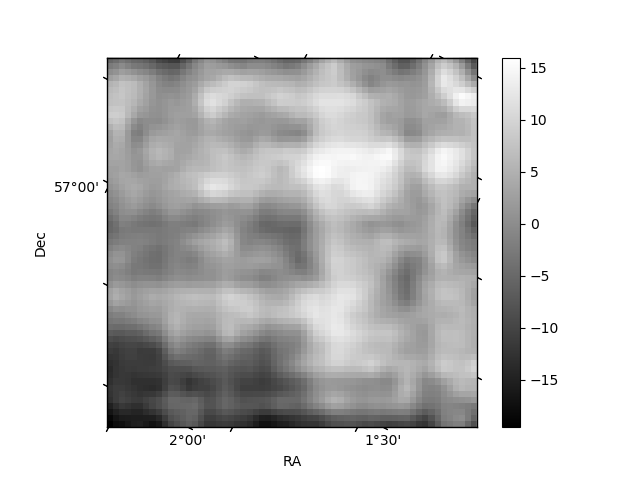
Histogram calculated using DETX and DETY for each event in the final _common_clean file
| Quadrant A | 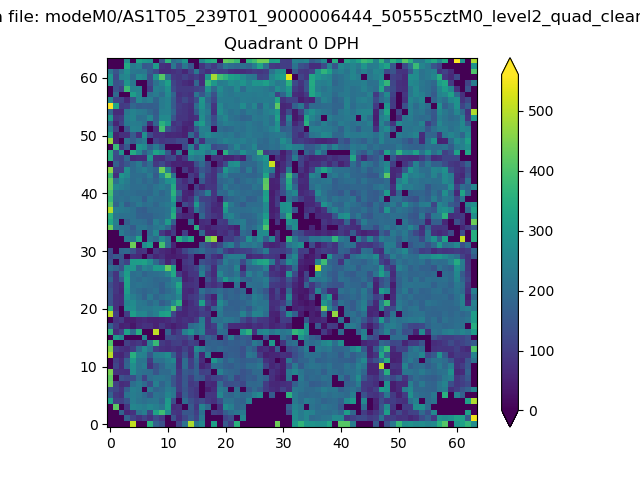 |
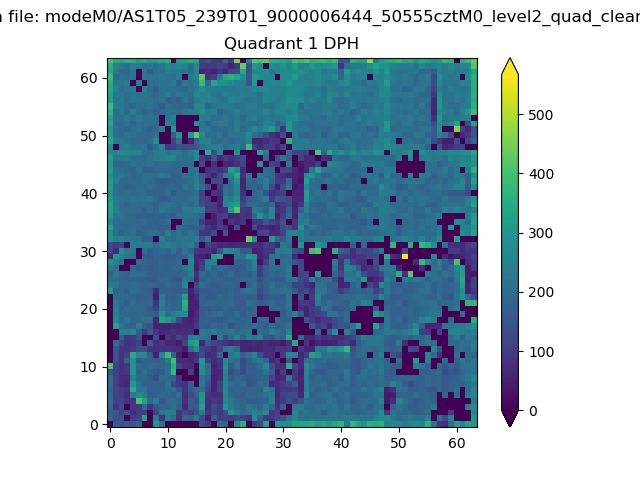 |
Quadrant B |
|---|---|---|---|
| Quadrant D | 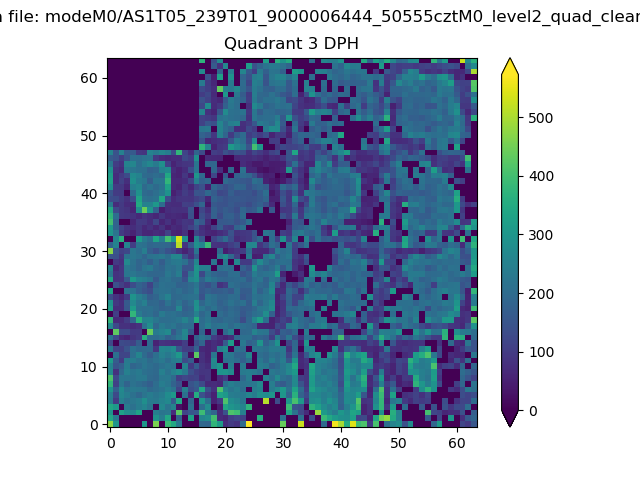 |
 |
Quadrant C |
| Plot type | Count rate plots | Images |
|---|---|---|
| Comparison with Poisson distribution Blue bars denote a histogram of data divided into 1 sec bins. Red curve is a Poisson curve with rate = median count rate of data. |
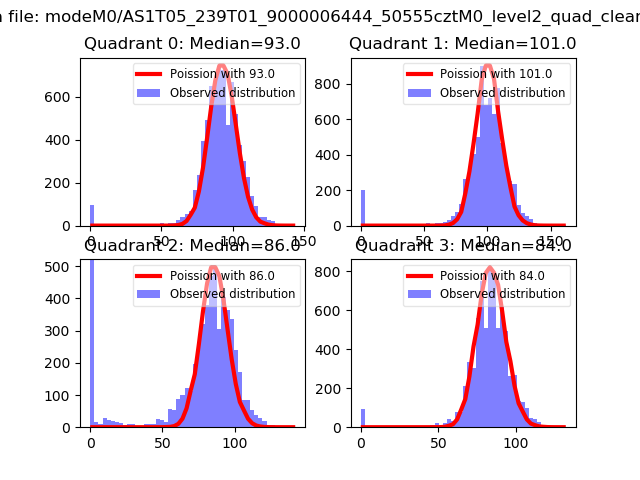 |
 |
| Quadrant-wise count rates Data is divided into 100 sec bins |
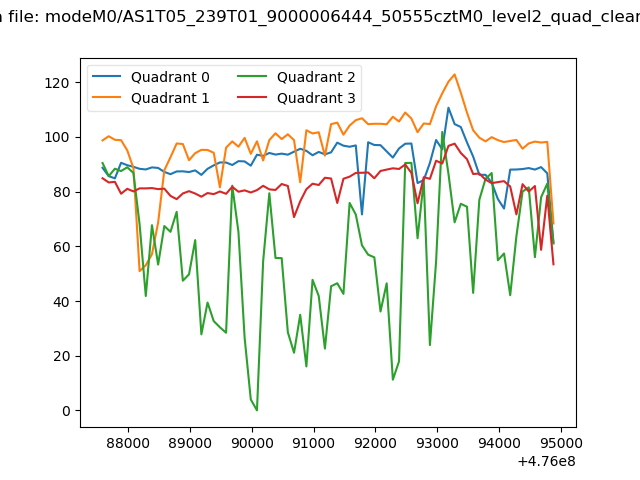 |
|
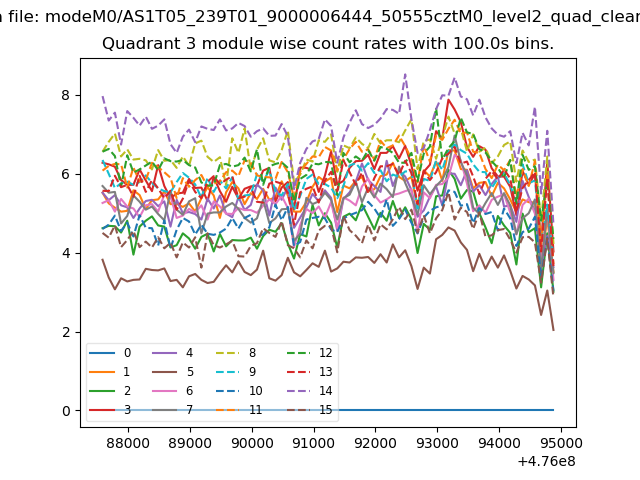
| Module-wise count rates for Quadrant A Data is divided into 100 sec bins |
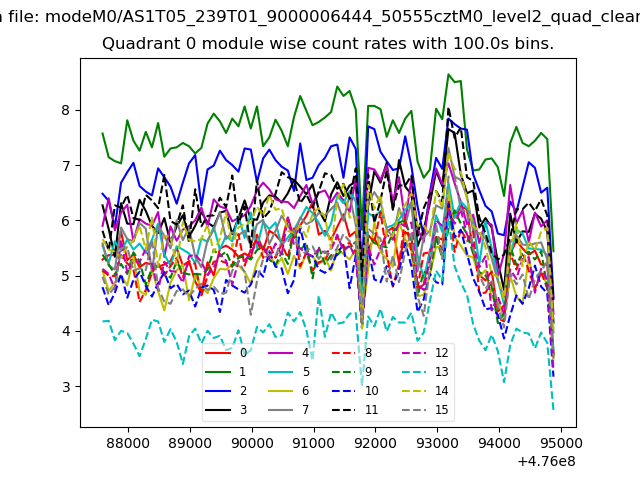 |
 |
| Module-wise count rates for Quadrant B Data is divided into 100 sec bins |
 |
 |
| Module-wise count rates for Quadrant C Data is divided into 100 sec bins |
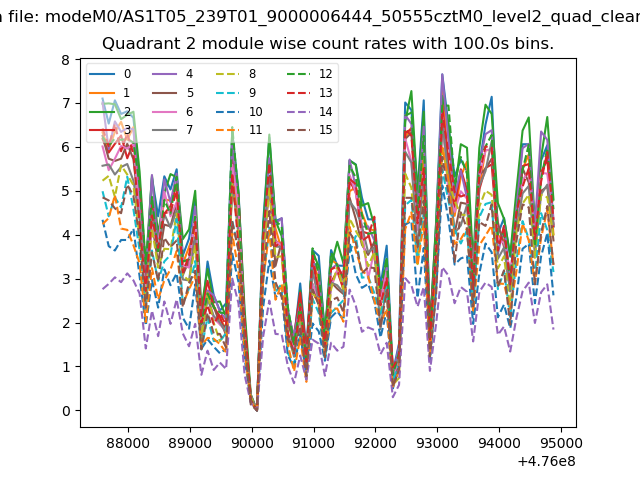 |
 |
| Module-wise count rates for Quadrant D Data is divided into 100 sec bins |
 |
 |
| Parameter | Plot |
|---|---|
| CZT HV Monitor | 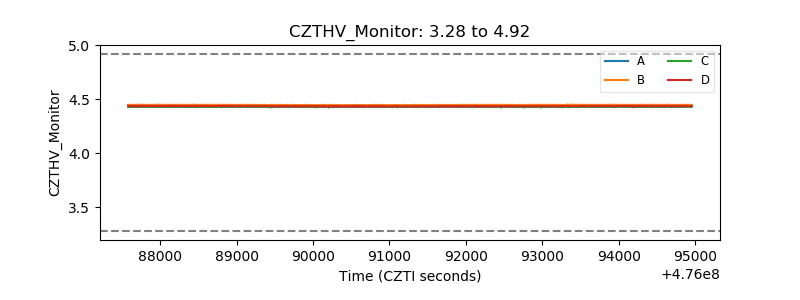 |
| D_VDD | 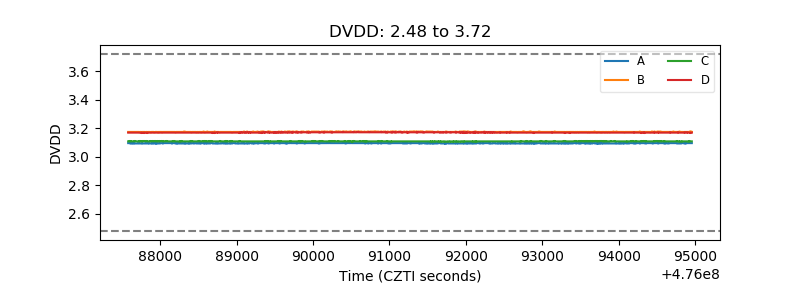 |
| Temperature 1 | 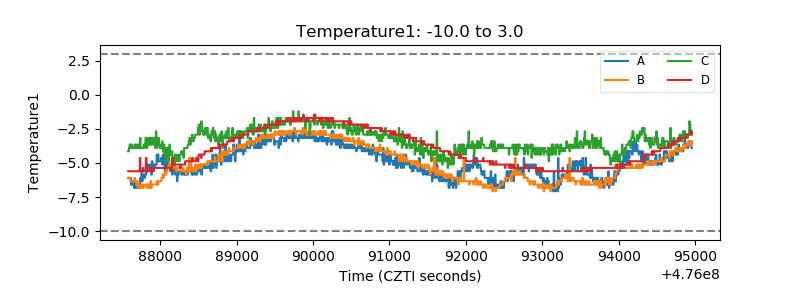 |
| Veto HV Monitor |  |
| Veto LLD | 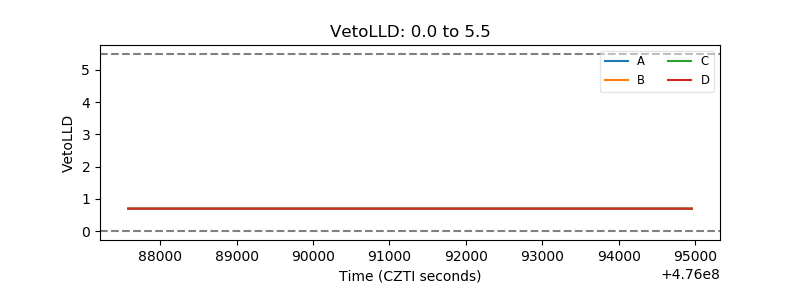 |
| Alpha Counter | 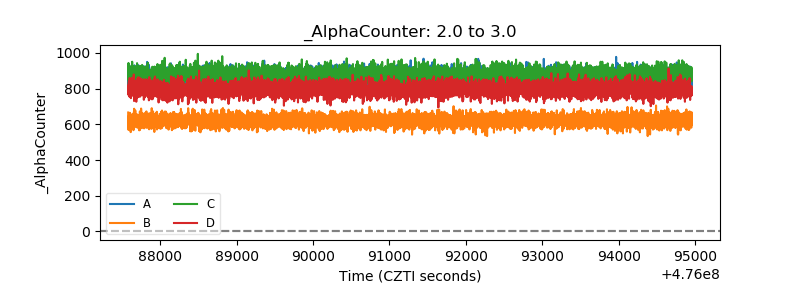 |
| _CPM_Rate | 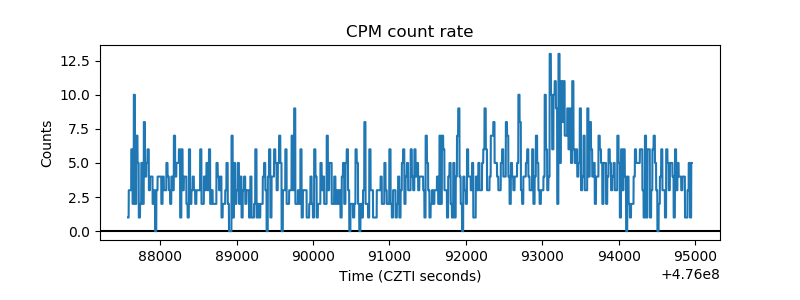 |
| CZT Counter |  |
| +2.5 Volts monitor |  |
| +5 Volts monitor |  |
| _ROLL_ROT | 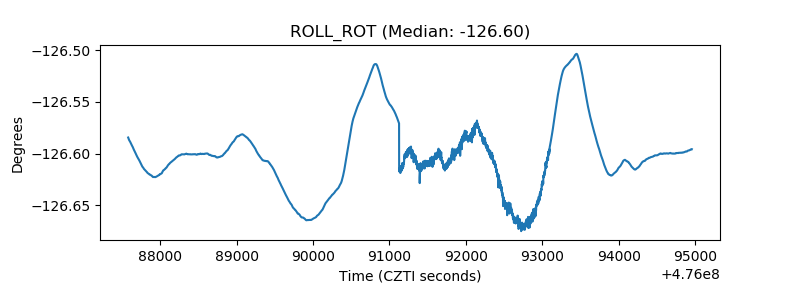 |
| _Roll_DEC | 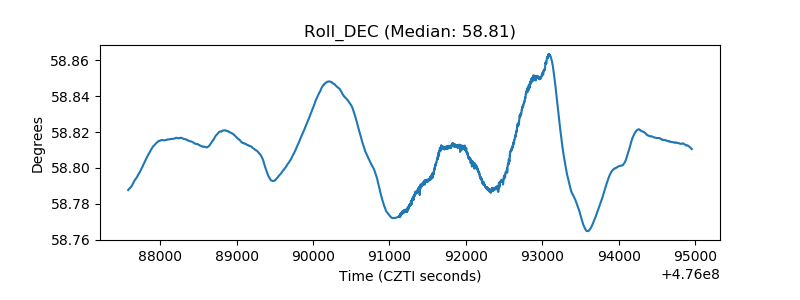 |
| _Roll_RA | 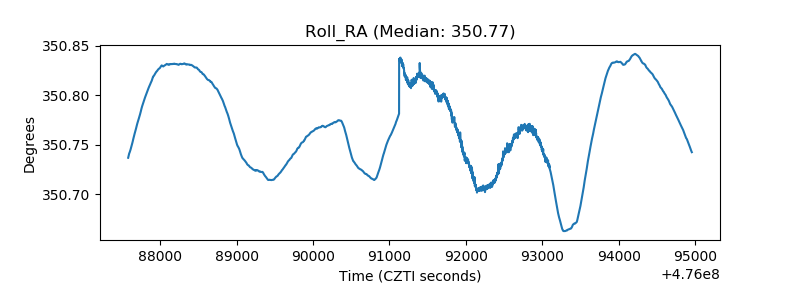 |
| Veto Counter | 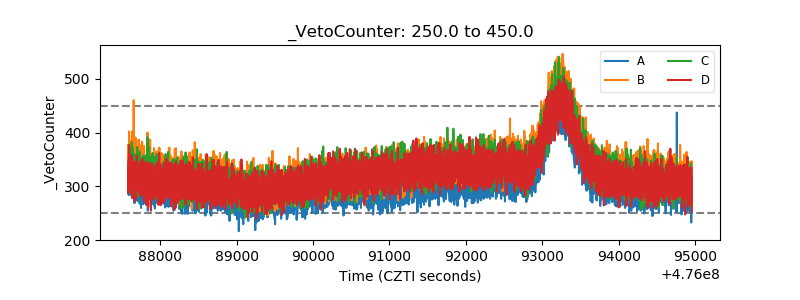 |