| Param | Original file | Final file |
|---|---|---|
| Filename | modeM0/AS1T05_239T01_9000006444_50556cztM0_level2.fits | modeM0/AS1T05_239T01_9000006444_50556cztM0_level2_quad_clean.evt |
| Size (bytes) | 894,870,720 | 94,809,600 |
| Size | 853.4 MB | 90.4 MB |
| Events in quadrant A | 6,302,205 | 653,758 |
| Events in quadrant B | 4,247,243 | 748,828 |
| Events in quadrant C | 11,240,470 | 416,666 |
| Events in quadrant D | 10,754,884 | 528,265 |
| Mode M0 | |||
|---|---|---|---|
| Quadrant | BADHDUFLAG | Total packets | Discarded packets |
| A | 0 | 23722 | 0 |
| B | 0 | 17868 | 0 |
| C | 0 | 38634 | 0 |
| D | 0 | 37266 | 0 |
| Mode SS | |||
|---|---|---|---|
| Quadrant | BADHDUFLAG | Total packets | Discarded packets |
| A | 0 | 150 | 0 |
| B | 0 | 150 | 0 |
| C | 0 | 150 | 0 |
| D | 0 | 150 | 0 |
| Quadrant | Total seconds | Saturated seconds | Saturation percentage |
|---|---|---|---|
| A | 7514 | 551 | 7.332978% |
| B | 7514 | 114 | 1.517168% |
| C | 7514 | 3080 | 40.990152% |
| D | 7514 | 1542 | 20.521693% |
Noise dominated data is calculated using 1-second bins in cleaned event files. If a bin has >2000 counts, and if more than 50% of those come from <1% of pixels, then it is considered to be noise-dominated and hence unusable.
| Quadrant | # 1 sec bins | Bins with >0 counts | Bins with >2000 counts | High rate bins dominated by noise | Noise dominated (total time) | Noise dominated (detector-on time) | Marked lightcurve |
|---|---|---|---|---|---|---|---|
| A | 7514 | 7514 | 437 | 437 | 5.82% | 5.82% | 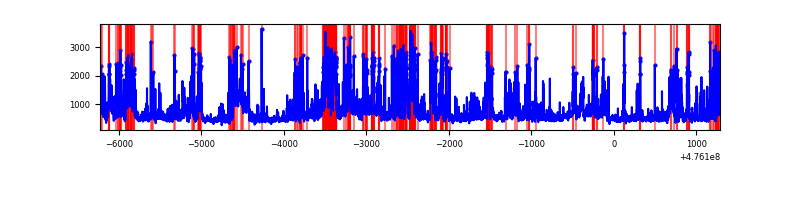 |
| B | 7514 | 7514 | 83 | 83 | 1.10% | 1.10% | 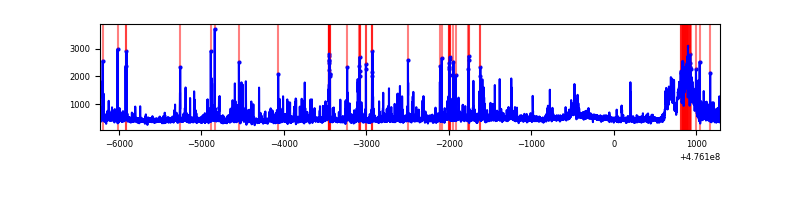 |
| C | 7514 | 7514 | 2456 | 2456 | 32.69% | 32.69% | 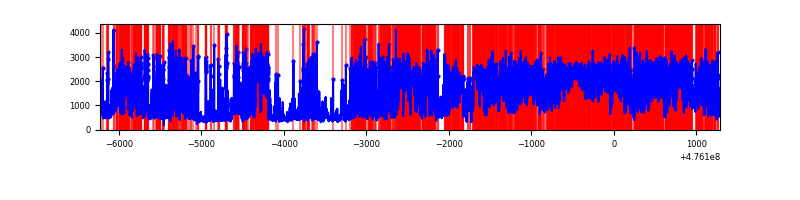 |
| D | 7513 | 7513 | 1662 | 1662 | 22.12% | 22.12% | 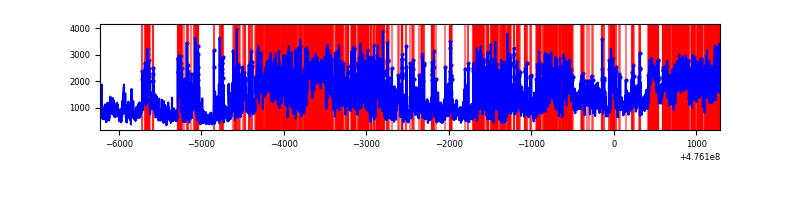 |
Top three noisy pixels from each quadrant. If the there are fewer than three noisy pixels in the level2.evt file, extra rows are filled as -1
| Pixel properties | Quadrant properties | ||||||
|---|---|---|---|---|---|---|---|
| Quadrant | DetID | PixID | Counts | Sigma | Mean | Median | Sigma |
| A | 12 | 250 | 1586434 | 8352.12 | 766 | 745 | 189.9 |
| A | 3 | 130 | 264913 | 1391.42 | 766 | 745 | 189.9 |
| A | 3 | 14 | 263295 | 1382.9 | 766 | 745 | 189.9 |
| B | 3 | 249 | 402288 | 2422.01 | 774 | 749 | 165.8 |
| B | 8 | 128 | 118211 | 708.51 | 774 | 749 | 165.8 |
| B | 5 | 185 | 92726 | 554.79 | 774 | 749 | 165.8 |
| C | 15 | 196 | 3673652 | 22159.62 | 592 | 591 | 165.8 |
| C | 15 | 214 | 2508085 | 15127.74 | 592 | 591 | 165.8 |
| C | 0 | 208 | 853995 | 5148.6 | 592 | 591 | 165.8 |
| D | 7 | 61 | 4002133 | 20446.66 | 705 | 680 | 195.7 |
| D | 6 | 42 | 911029 | 4651.71 | 705 | 680 | 195.7 |
| D | 7 | 126 | 658095 | 3359.26 | 705 | 680 | 195.7 |
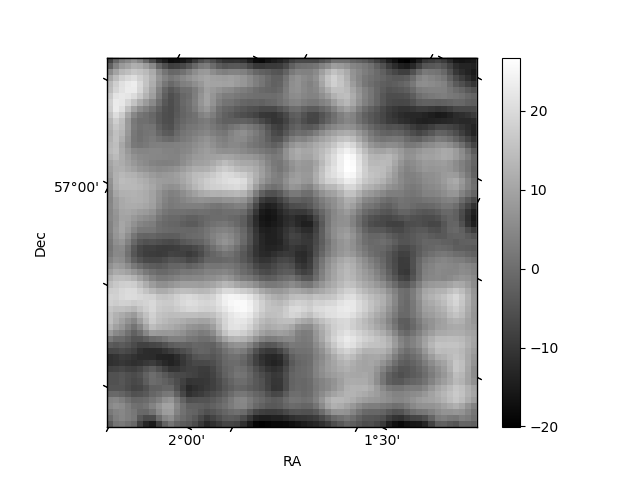
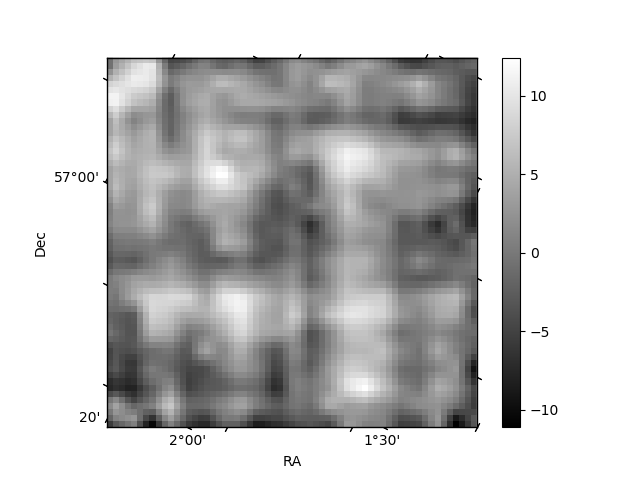
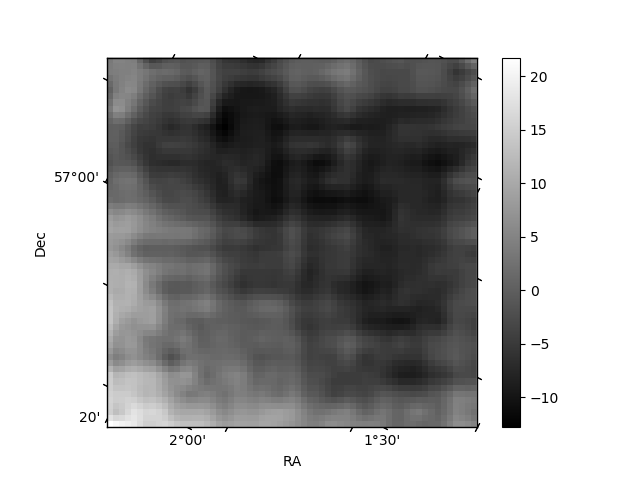
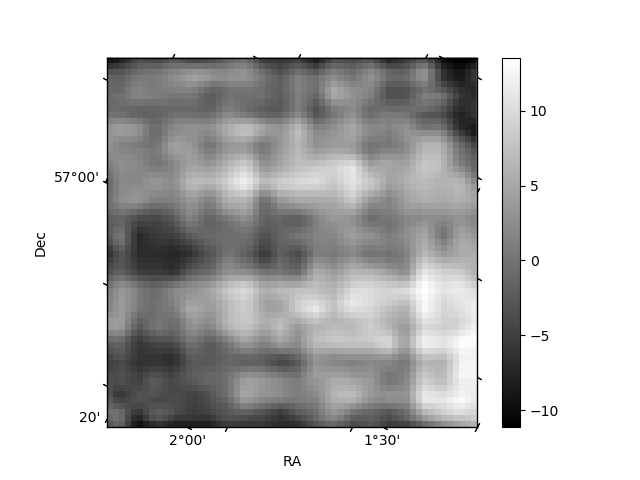
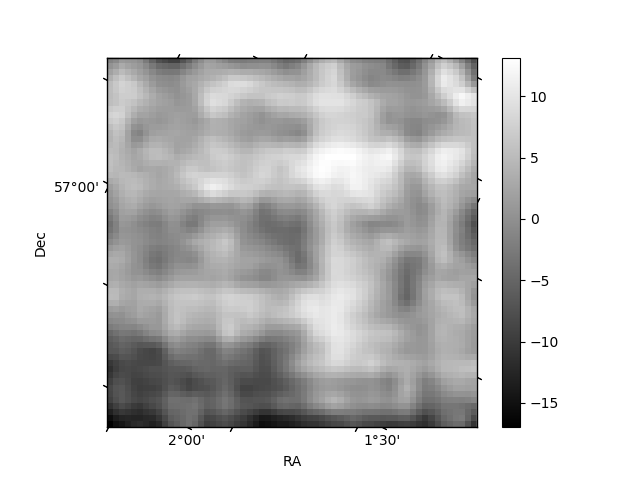
Histogram calculated using DETX and DETY for each event in the final _common_clean file
| Quadrant A | 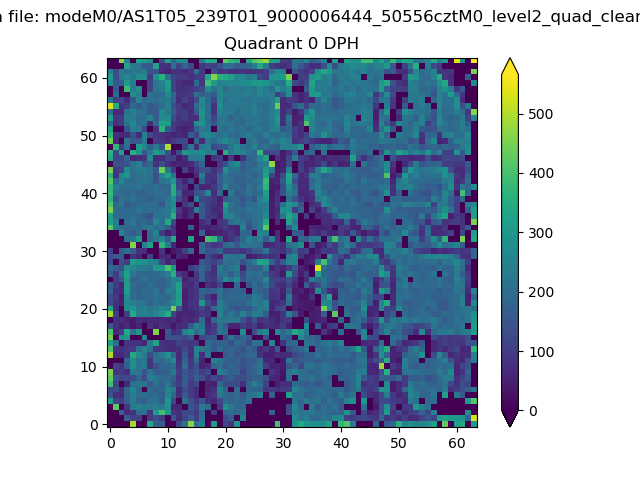 |
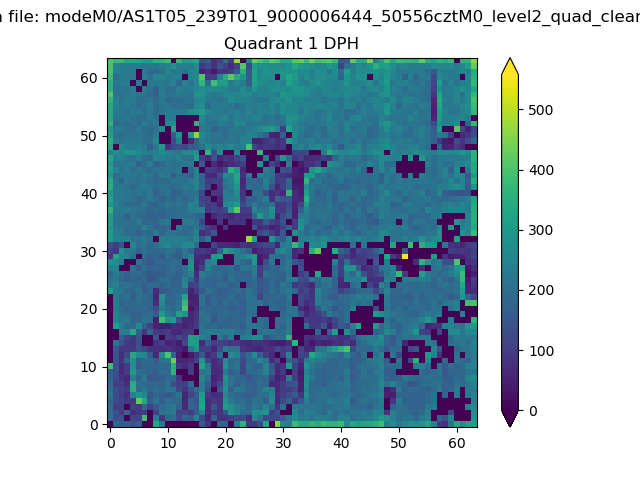 |
Quadrant B |
|---|---|---|---|
| Quadrant D | 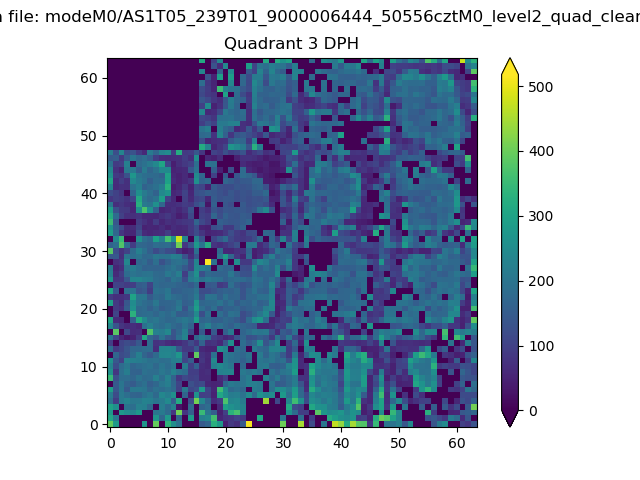 |
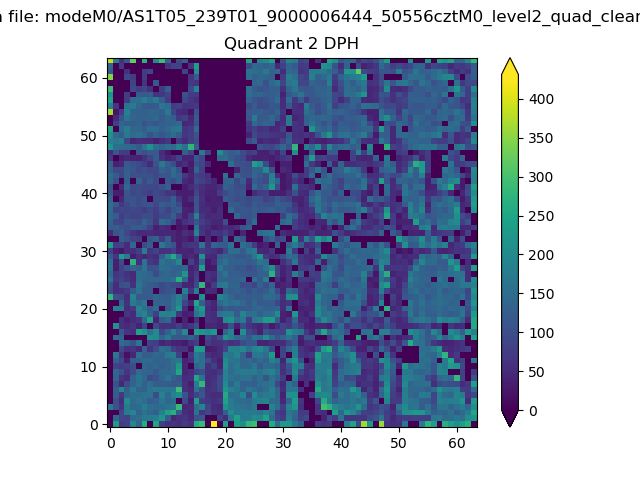 |
Quadrant C |
| Plot type | Count rate plots | Images |
|---|---|---|
| Comparison with Poisson distribution Blue bars denote a histogram of data divided into 1 sec bins. Red curve is a Poisson curve with rate = median count rate of data. |
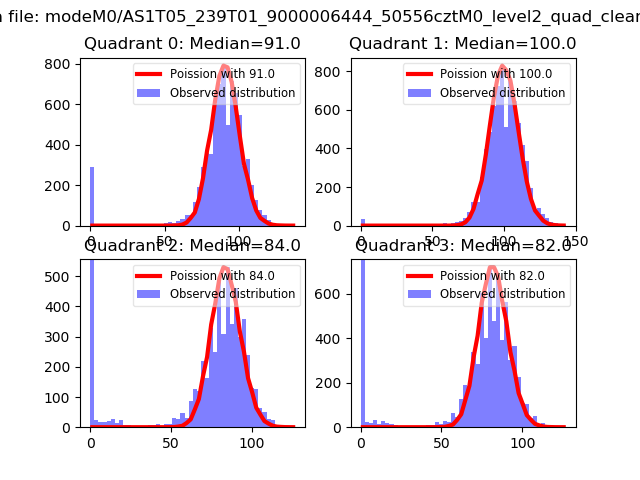 |
 |
| Quadrant-wise count rates Data is divided into 100 sec bins |
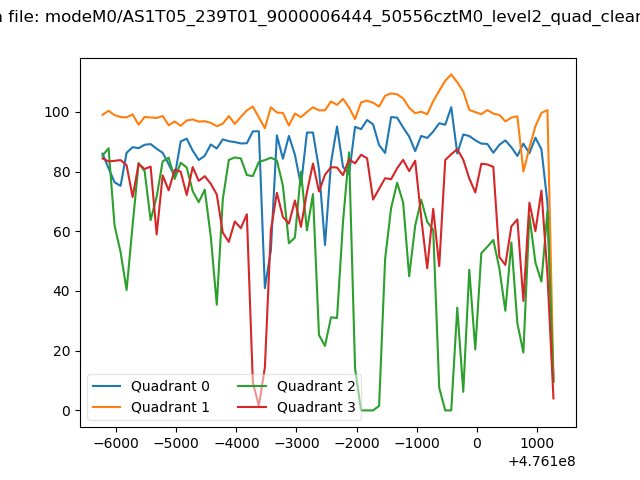 |
|
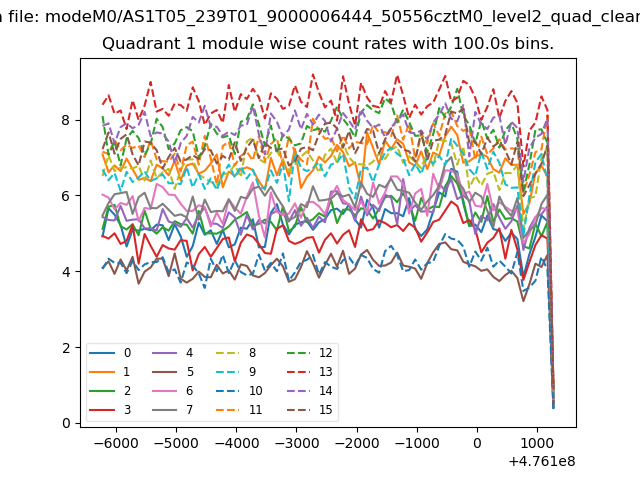
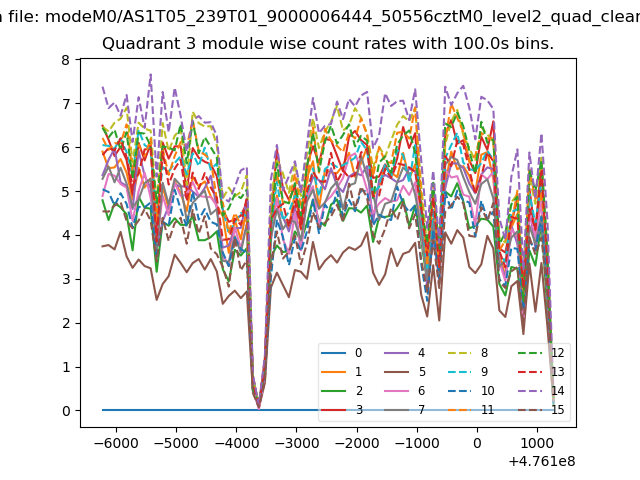
| Module-wise count rates for Quadrant A Data is divided into 100 sec bins |
 |
 |
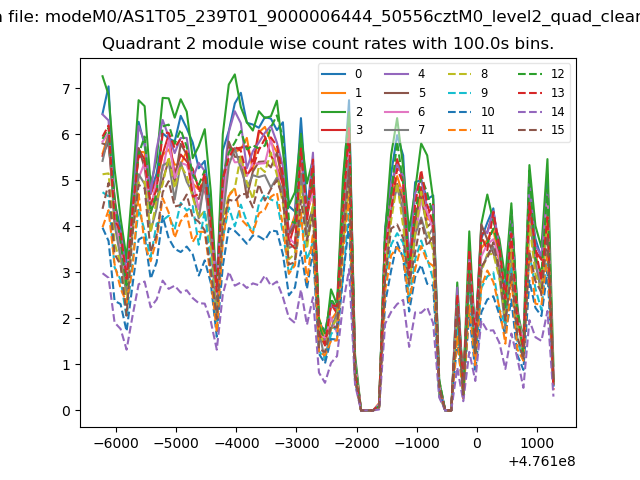
| Module-wise count rates for Quadrant B Data is divided into 100 sec bins |
 |
 |
| Module-wise count rates for Quadrant C Data is divided into 100 sec bins |
 |
 |
| Module-wise count rates for Quadrant D Data is divided into 100 sec bins |
 |
 |
| Parameter | Plot |
|---|---|
| CZT HV Monitor | 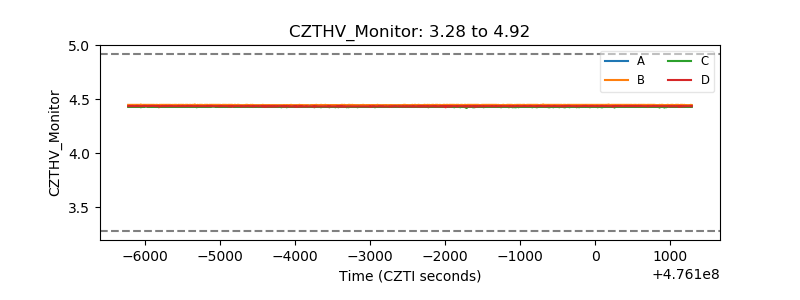 |
| D_VDD | 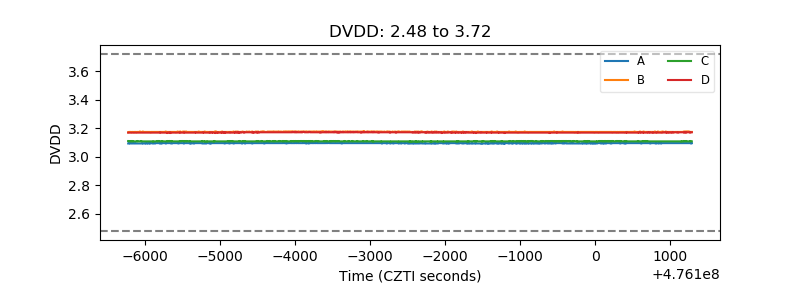 |
| Temperature 1 | 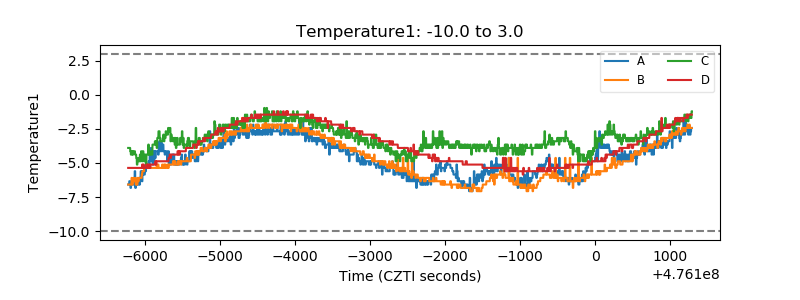 |
| Veto HV Monitor |  |
| Veto LLD | 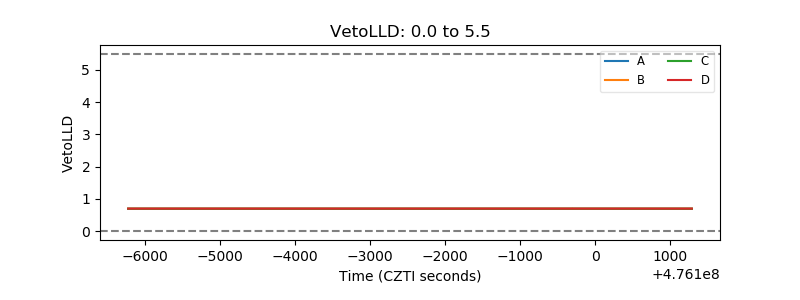 |
| Alpha Counter | 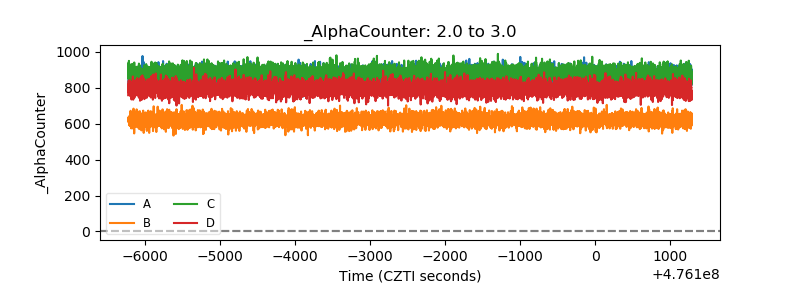 |
| _CPM_Rate | 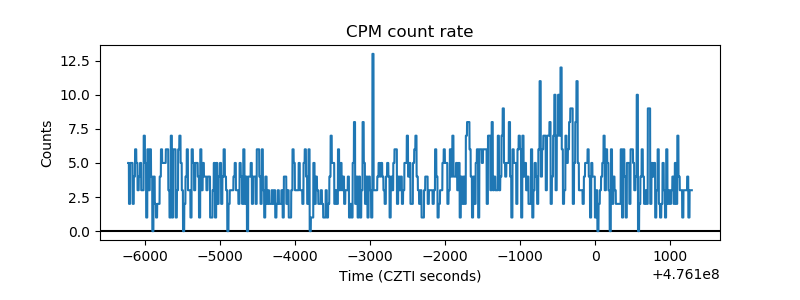 |
| CZT Counter | 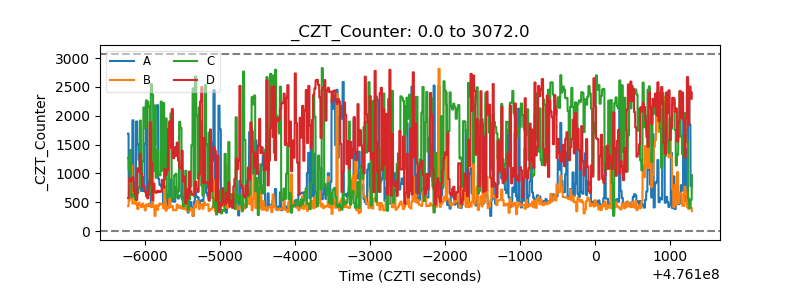 |
| +2.5 Volts monitor | 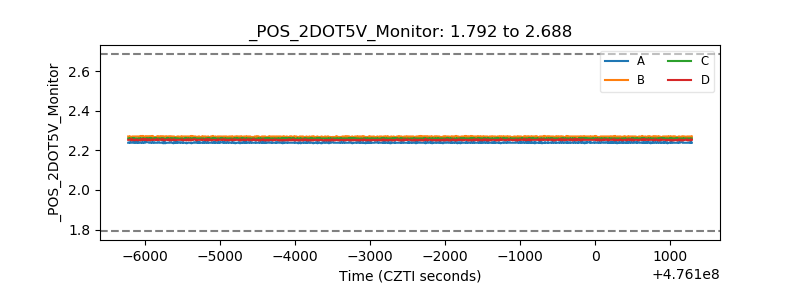 |
| +5 Volts monitor |  |
| _ROLL_ROT | 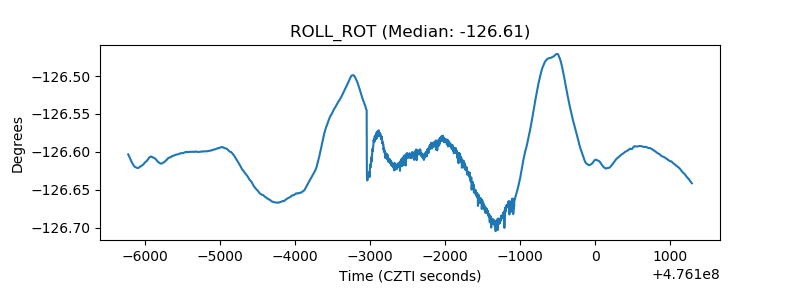 |
| _Roll_DEC | 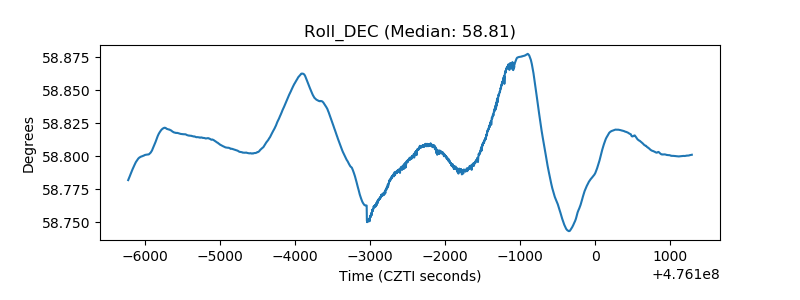 |
| _Roll_RA | 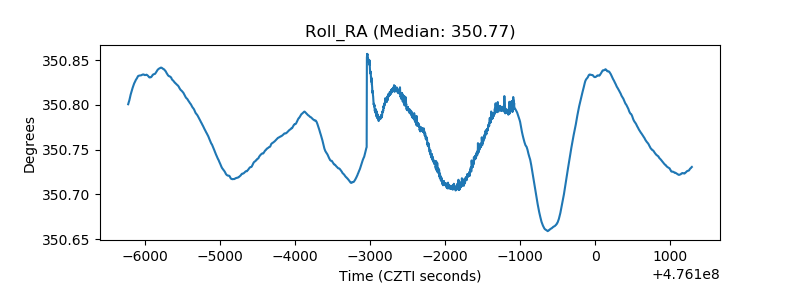 |
| Veto Counter | 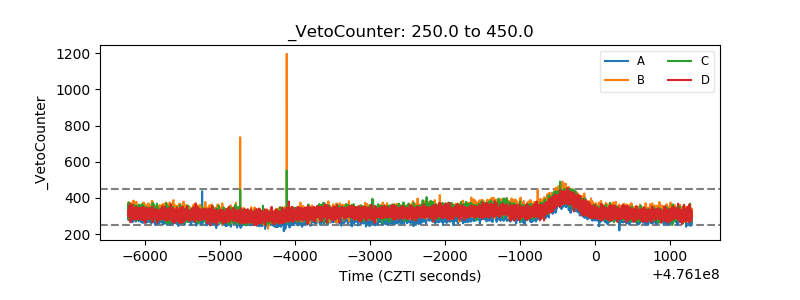 |