| Param | Original file | Final file |
|---|---|---|
| Filename | modeM0/AS1T05_239T01_9000006444_50557cztM0_level2.fits | modeM0/AS1T05_239T01_9000006444_50557cztM0_level2_quad_clean.evt |
| Size (bytes) | 1,149,013,440 | 73,995,840 |
| Size | 1.1 GB | 70.6 MB |
| Events in quadrant A | 4,823,237 | 655,751 |
| Events in quadrant B | 6,512,511 | 667,224 |
| Events in quadrant C | 14,284,466 | 235,999 |
| Events in quadrant D | 16,353,979 | 176,962 |
| Mode M0 | |||
|---|---|---|---|
| Quadrant | BADHDUFLAG | Total packets | Discarded packets |
| A | 0 | 19164 | 2 |
| B | 0 | 24395 | 0 |
| C | 0 | 47414 | 0 |
| D | 0 | 53513 | 0 |
| Mode SS | |||
|---|---|---|---|
| Quadrant | BADHDUFLAG | Total packets | Discarded packets |
| A | 0 | 144 | 0 |
| B | 0 | 144 | 0 |
| C | 0 | 144 | 0 |
| D | 0 | 144 | 0 |
| Quadrant | Total seconds | Saturated seconds | Saturation percentage |
|---|---|---|---|
| A | 7241 | 248 | 3.424941% |
| B | 7241 | 786 | 10.854854% |
| C | 7241 | 4855 | 67.048750% |
| D | 7241 | 5431 | 75.003453% |
Noise dominated data is calculated using 1-second bins in cleaned event files. If a bin has >2000 counts, and if more than 50% of those come from <1% of pixels, then it is considered to be noise-dominated and hence unusable.
| Quadrant | # 1 sec bins | Bins with >0 counts | Bins with >2000 counts | High rate bins dominated by noise | Noise dominated (total time) | Noise dominated (detector-on time) | Marked lightcurve |
|---|---|---|---|---|---|---|---|
| A | 7241 | 7241 | 167 | 167 | 2.31% | 2.31% | 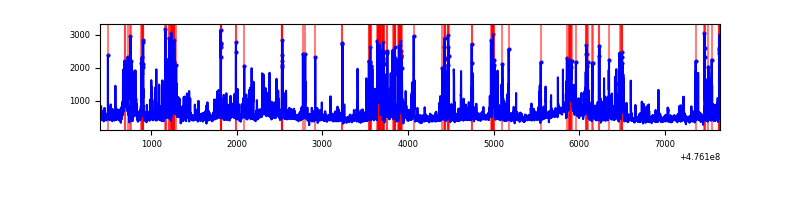 |
| B | 7240 | 7240 | 543 | 543 | 7.50% | 7.50% | 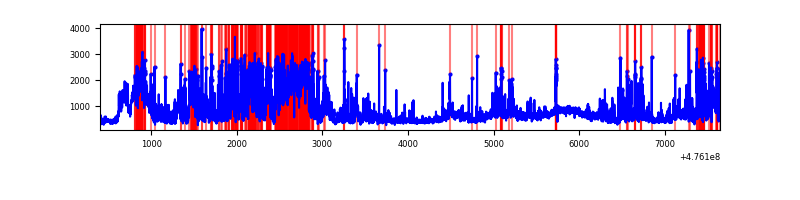 |
| C | 7240 | 7240 | 4249 | 4249 | 58.69% | 58.69% | 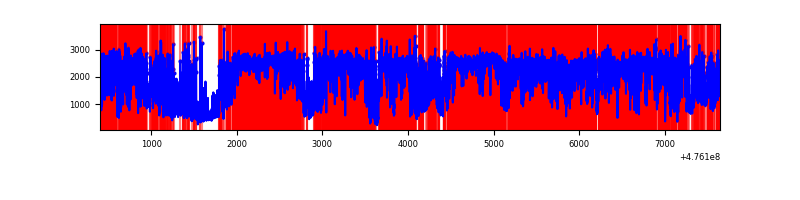 |
| D | 7241 | 7241 | 5531 | 5531 | 76.38% | 76.38% | 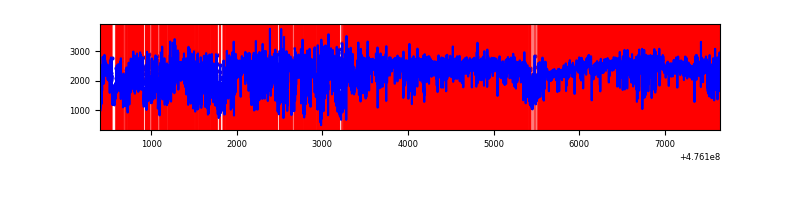 |
Top three noisy pixels from each quadrant. If the there are fewer than three noisy pixels in the level2.evt file, extra rows are filled as -1
| Pixel properties | Quadrant properties | ||||||
|---|---|---|---|---|---|---|---|
| Quadrant | DetID | PixID | Counts | Sigma | Mean | Median | Sigma |
| A | 12 | 250 | 626184 | 3273.83 | 760 | 739 | 191.0 |
| A | 3 | 130 | 188218 | 981.34 | 760 | 739 | 191.0 |
| A | 4 | 3 | 172792 | 900.59 | 760 | 739 | 191.0 |
| B | 12 | 0 | 933086 | 6145.3 | 718 | 694 | 151.7 |
| B | 0 | 229 | 678688 | 4468.59 | 718 | 694 | 151.7 |
| B | 3 | 249 | 584364 | 3846.91 | 718 | 694 | 151.7 |
| C | 15 | 196 | 4213548 | 31374.29 | 462 | 457 | 134.3 |
| C | 15 | 214 | 4129931 | 30751.6 | 462 | 457 | 134.3 |
| C | 15 | 174 | 653468 | 4862.88 | 462 | 457 | 134.3 |
| D | 7 | 61 | 6906767 | 55408.63 | 440 | 425 | 124.6 |
| D | 15 | 184 | 3739751 | 30000.1 | 440 | 425 | 124.6 |
| D | 15 | 185 | 632821 | 5073.63 | 440 | 425 | 124.6 |
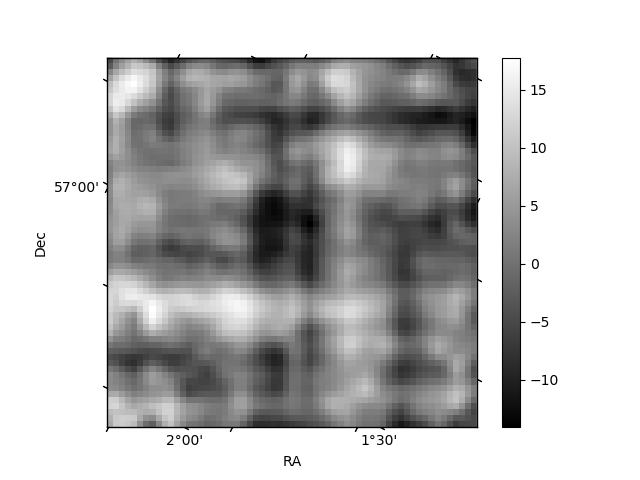
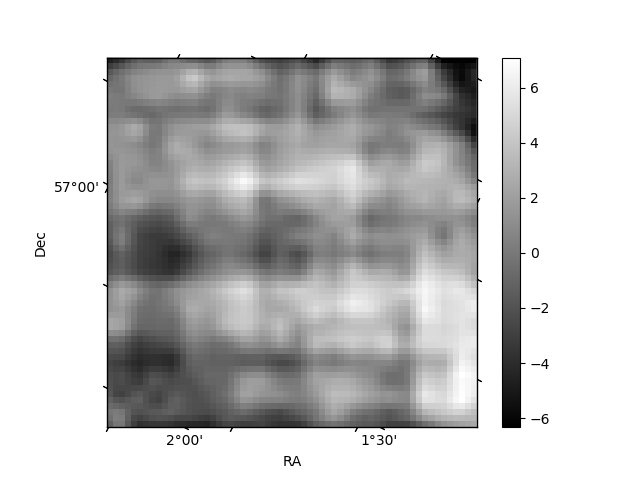
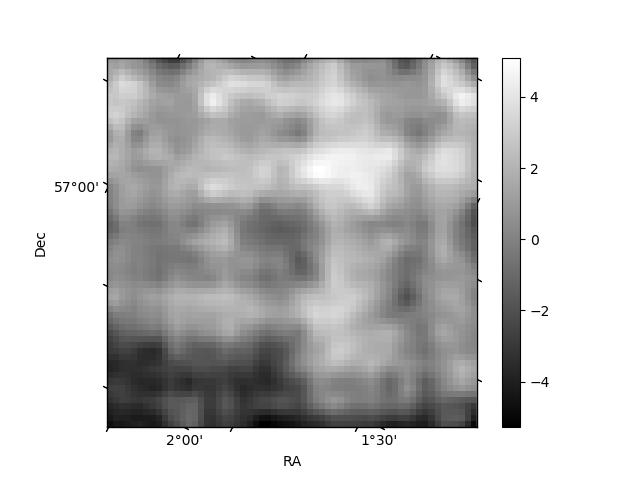
Histogram calculated using DETX and DETY for each event in the final _common_clean file
| Quadrant A | 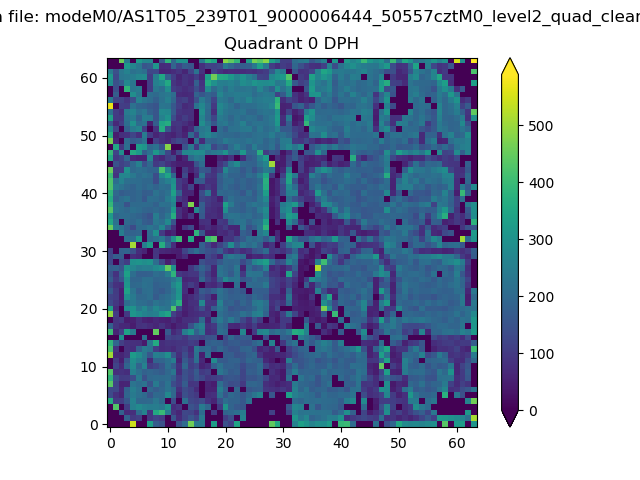 |
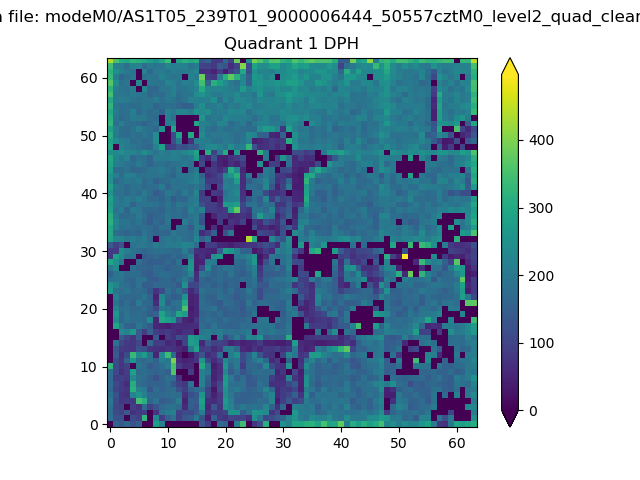 |
Quadrant B |
|---|---|---|---|
| Quadrant D | 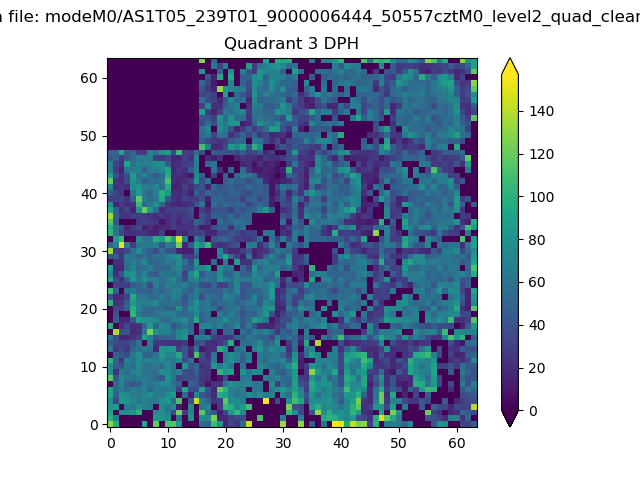 |
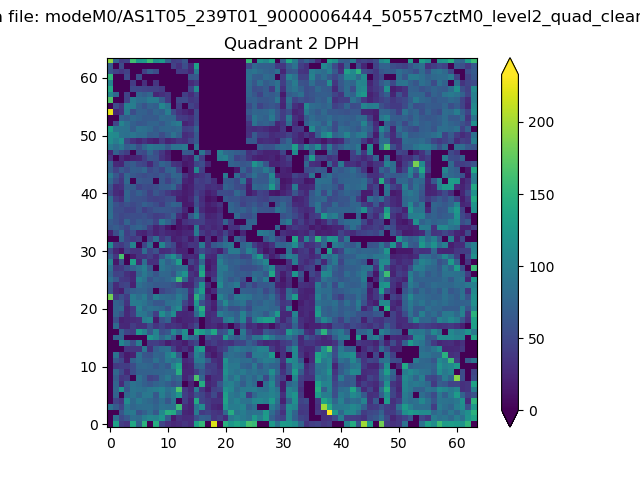 |
Quadrant C |
| Plot type | Count rate plots | Images |
|---|---|---|
| Comparison with Poisson distribution Blue bars denote a histogram of data divided into 1 sec bins. Red curve is a Poisson curve with rate = median count rate of data. |
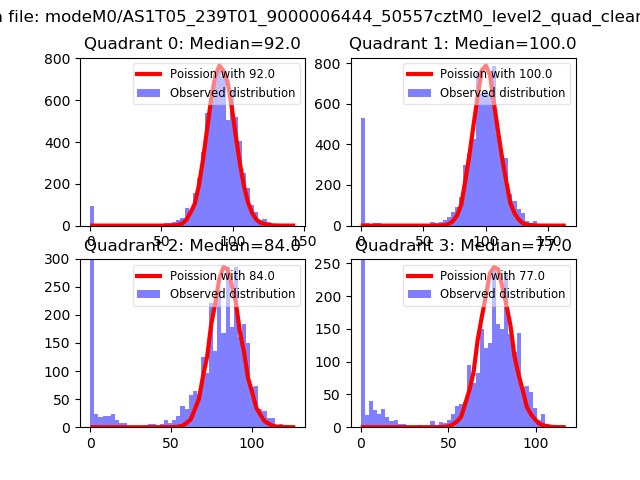 |
 |
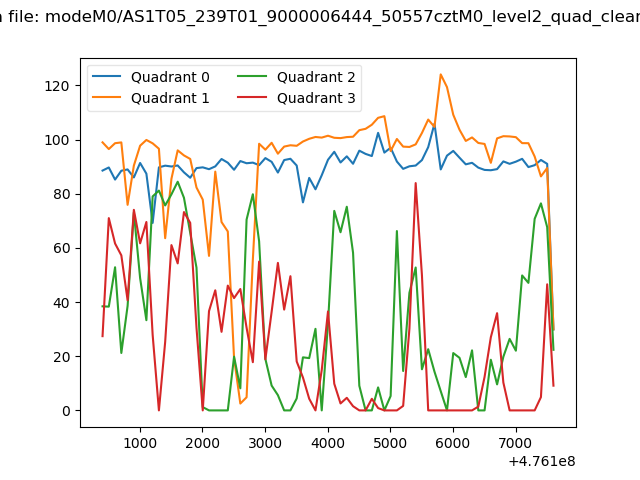
| Quadrant-wise count rates Data is divided into 100 sec bins |
 |
|
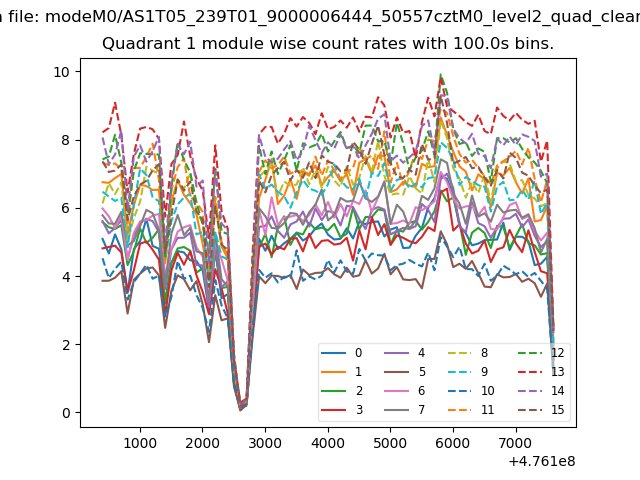
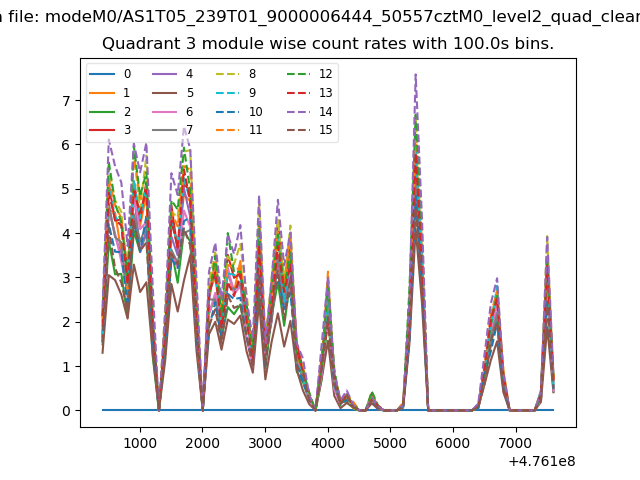
| Module-wise count rates for Quadrant A Data is divided into 100 sec bins |
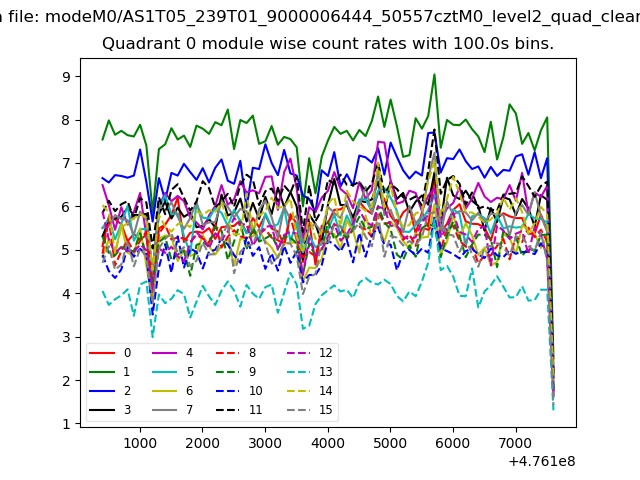 |
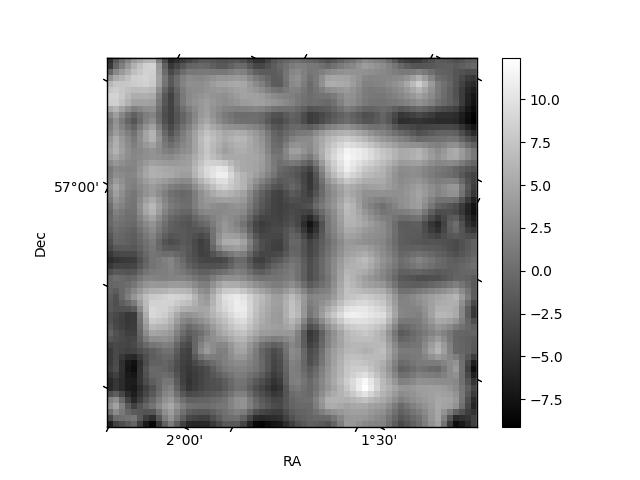 |
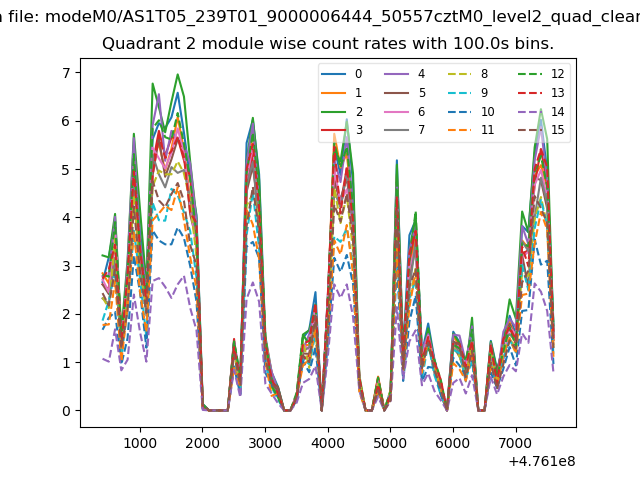
| Module-wise count rates for Quadrant B Data is divided into 100 sec bins |
 |
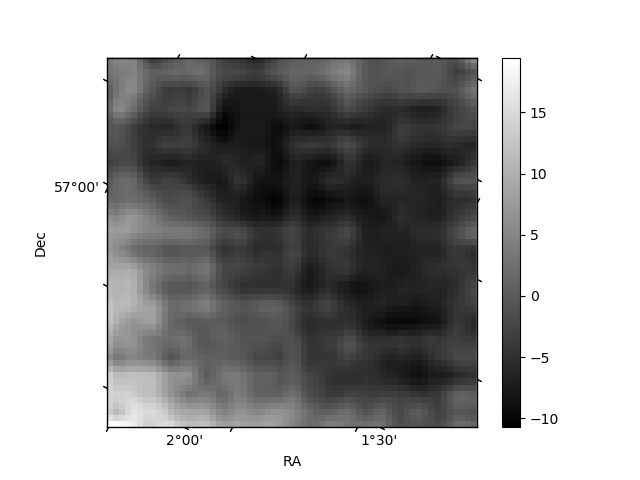 |
| Module-wise count rates for Quadrant C Data is divided into 100 sec bins |
 |
 |
| Module-wise count rates for Quadrant D Data is divided into 100 sec bins |
 |
 |
| Parameter | Plot |
|---|---|
| CZT HV Monitor | 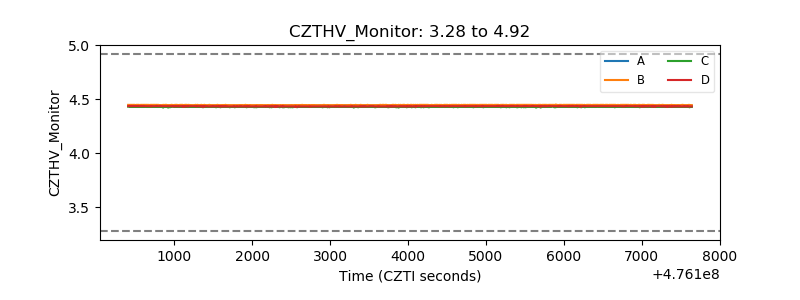 |
| D_VDD | 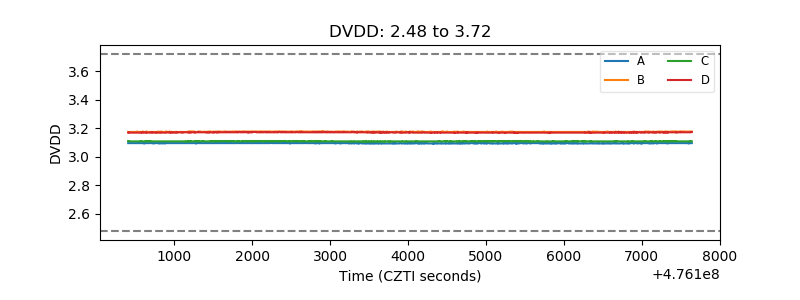 |
| Temperature 1 | 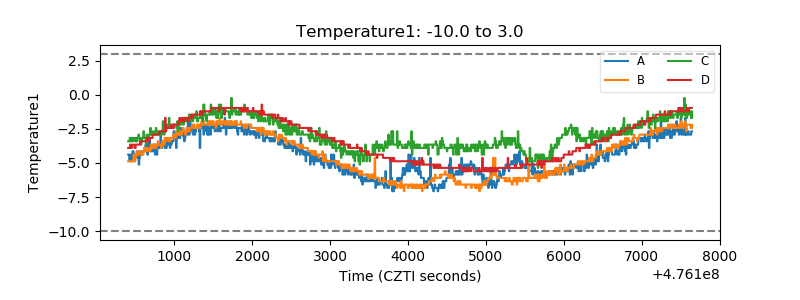 |
| Veto HV Monitor | 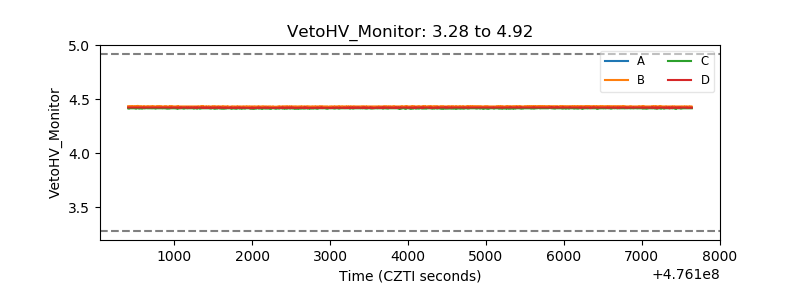 |
| Veto LLD | 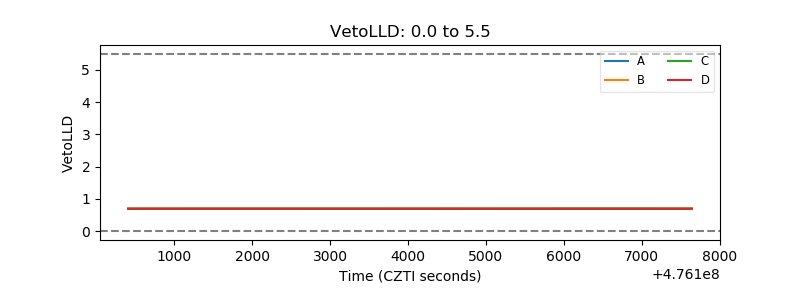 |
| Alpha Counter | 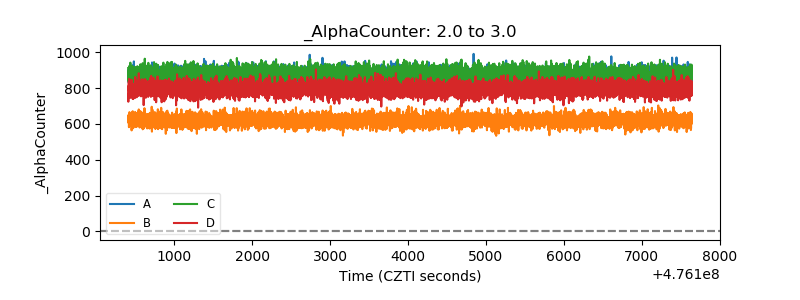 |
| _CPM_Rate | 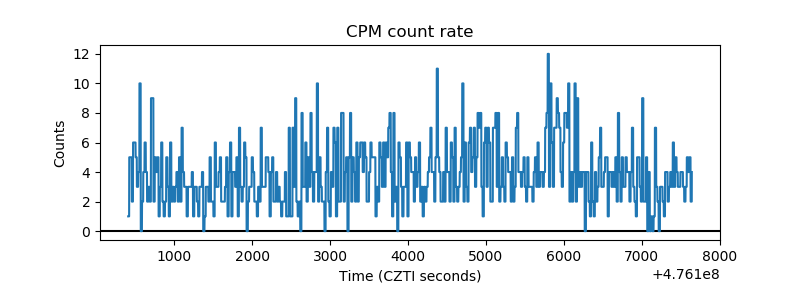 |
| CZT Counter | 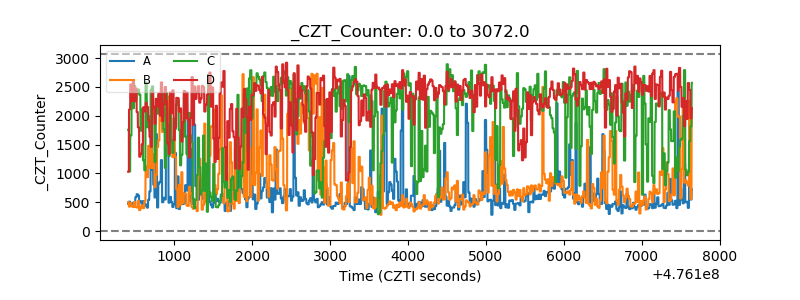 |
| +2.5 Volts monitor | 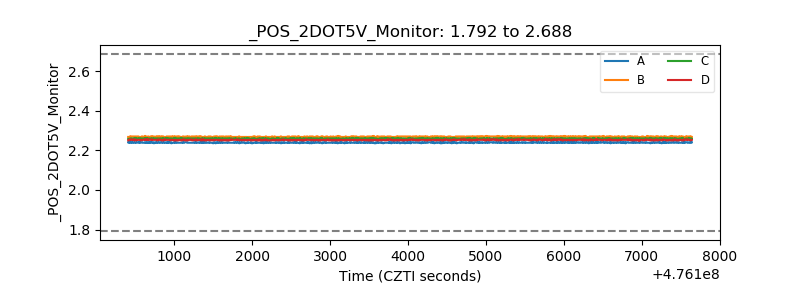 |
| +5 Volts monitor |  |
| _ROLL_ROT | 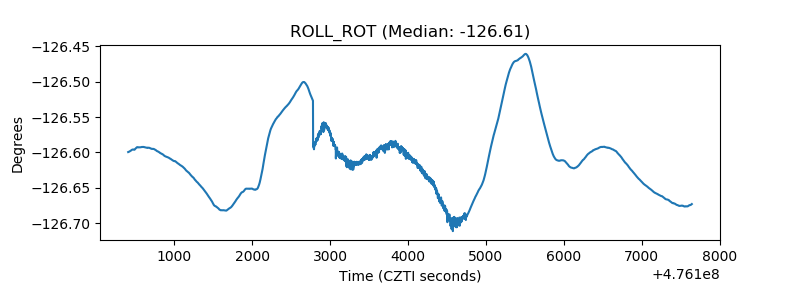 |
| _Roll_DEC | 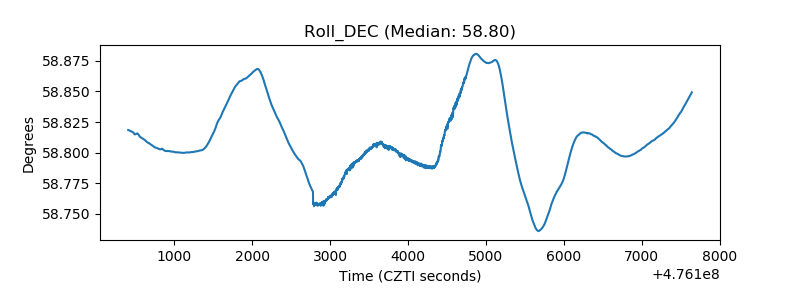 |
| _Roll_RA | 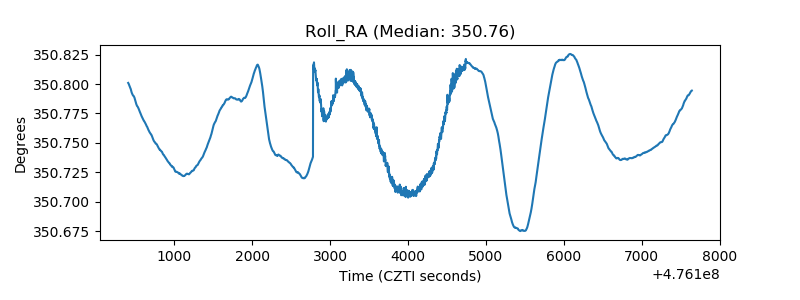 |
| Veto Counter | 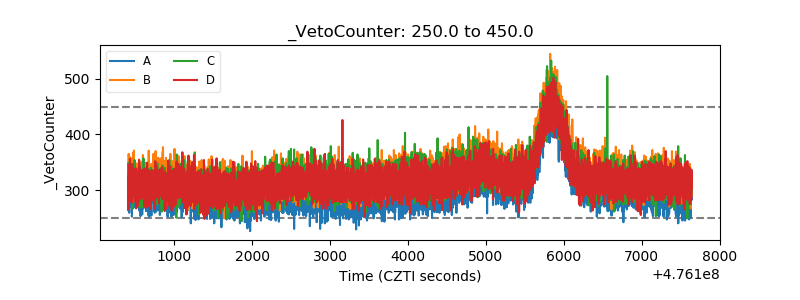 |