| Param | Original file | Final file |
|---|---|---|
| Filename | modeM0/AS1T05_239T01_9000006444_50560cztM0_level2.fits | modeM0/AS1T05_239T01_9000006444_50560cztM0_level2_quad_clean.evt |
| Size (bytes) | 2,443,034,880 | 199,612,800 |
| Size | 2.3 GB | 190.4 MB |
| Events in quadrant A | 13,181,250 | 1,603,791 |
| Events in quadrant B | 13,530,395 | 1,711,846 |
| Events in quadrant C | 30,368,508 | 830,747 |
| Events in quadrant D | 31,955,142 | 645,586 |
| Mode M0 | |||
|---|---|---|---|
| Quadrant | BADHDUFLAG | Total packets | Discarded packets |
| A | 0 | 51374 | 1 |
| B | 0 | 52758 | 1 |
| C | 0 | 102722 | 2 |
| D | 0 | 107186 | 1 |
| Mode M9 | |||
|---|---|---|---|
| Quadrant | BADHDUFLAG | Total packets | Discarded packets |
| A | 0 | 14 | 0 |
| B | 0 | 14 | 0 |
| C | 0 | 14 | 0 |
| D | 0 | 14 | 0 |
| Mode SS | |||
|---|---|---|---|
| Quadrant | BADHDUFLAG | Total packets | Discarded packets |
| A | 0 | 366 | 0 |
| B | 0 | 366 | 0 |
| C | 0 | 366 | 0 |
| D | 0 | 366 | 0 |
| Quadrant | Total seconds | Saturated seconds | Saturation percentage |
|---|---|---|---|
| A | 18155 | 1011 | 5.568714% |
| B | 18156 | 1098 | 6.047588% |
| C | 18155 | 9107 | 50.162490% |
| D | 18155 | 10660 | 58.716607% |
Noise dominated data is calculated using 1-second bins in cleaned event files. If a bin has >2000 counts, and if more than 50% of those come from <1% of pixels, then it is considered to be noise-dominated and hence unusable.
| Quadrant | # 1 sec bins | Bins with >0 counts | Bins with >2000 counts | High rate bins dominated by noise | Noise dominated (total time) | Noise dominated (detector-on time) | Marked lightcurve |
|---|---|---|---|---|---|---|---|
| A | 19385 | 18157 | 682 | 682 | 3.52% | 3.76% | 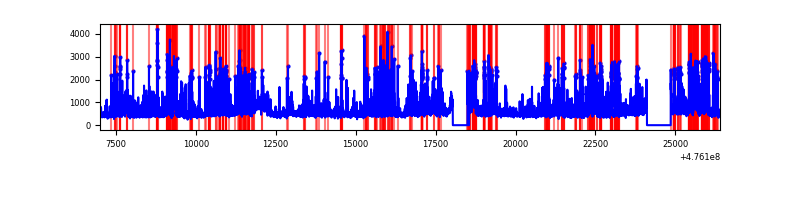 |
| B | 19386 | 18159 | 633 | 633 | 3.27% | 3.49% | 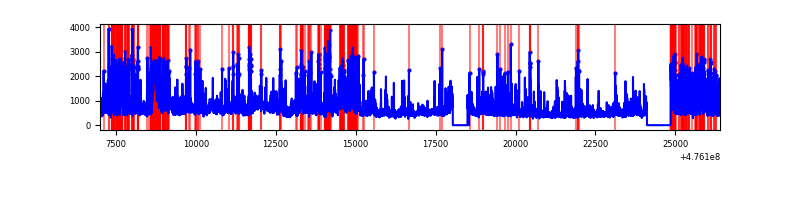 |
| C | 19385 | 18157 | 8253 | 8253 | 42.57% | 45.45% | 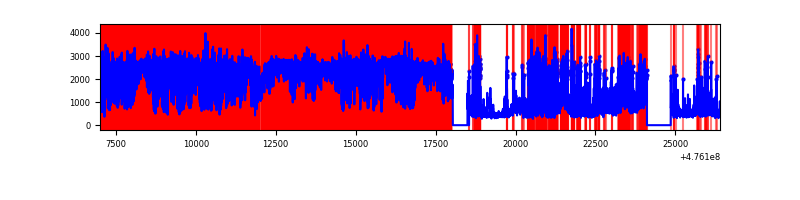 |
| D | 19385 | 18157 | 10042 | 10042 | 51.80% | 55.31% | 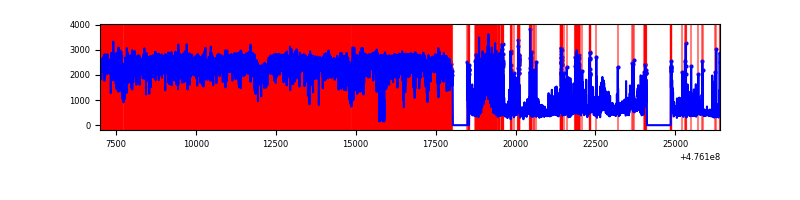 |
Top three noisy pixels from each quadrant. If the there are fewer than three noisy pixels in the level2.evt file, extra rows are filled as -1
| Pixel properties | Quadrant properties | ||||||
|---|---|---|---|---|---|---|---|
| Quadrant | DetID | PixID | Counts | Sigma | Mean | Median | Sigma |
| A | 12 | 250 | 1020153 | 2163.19 | 1916 | 1870 | 470.7 |
| A | 8 | 247 | 683726 | 1448.5 | 1916 | 1870 | 470.7 |
| A | 4 | 3 | 478196 | 1011.88 | 1916 | 1870 | 470.7 |
| B | 0 | 229 | 1734870 | 4312.31 | 1891 | 1825 | 401.9 |
| B | 2 | 2 | 1363179 | 3387.44 | 1891 | 1825 | 401.9 |
| B | 3 | 249 | 465477 | 1153.7 | 1891 | 1825 | 401.9 |
| C | 15 | 196 | 4749051 | 12171.93 | 1397 | 1386 | 390.1 |
| C | 15 | 214 | 2859295 | 7327.03 | 1397 | 1386 | 390.1 |
| C | 15 | 178 | 1949815 | 4995.33 | 1397 | 1386 | 390.1 |
| D | 7 | 61 | 10268983 | 28787.59 | 1254 | 1207 | 356.7 |
| D | 15 | 184 | 9175530 | 25721.89 | 1254 | 1207 | 356.7 |
| D | 7 | 60 | 1556315 | 4360.03 | 1254 | 1207 | 356.7 |
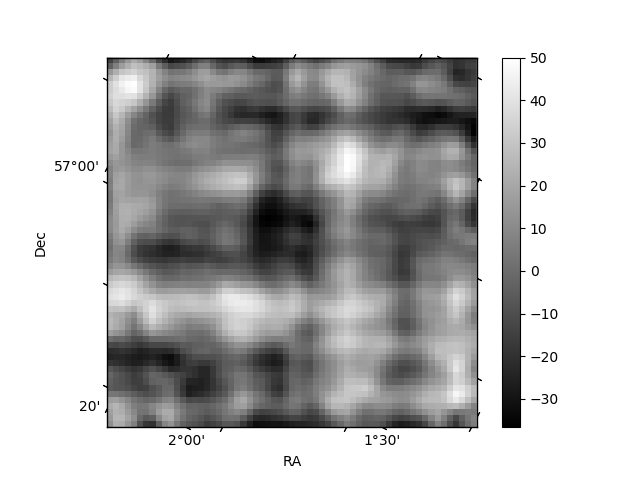
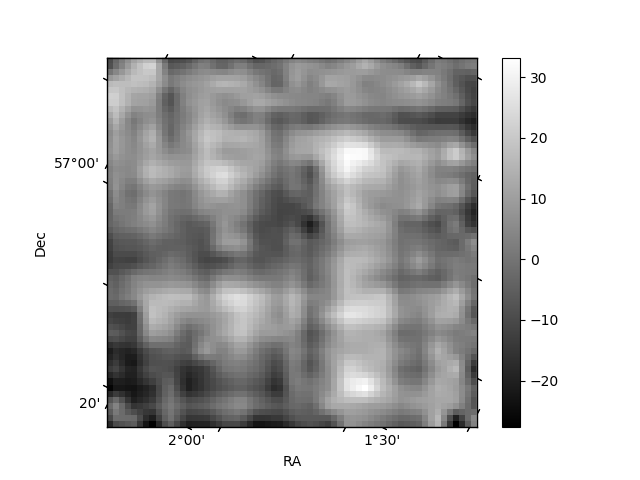
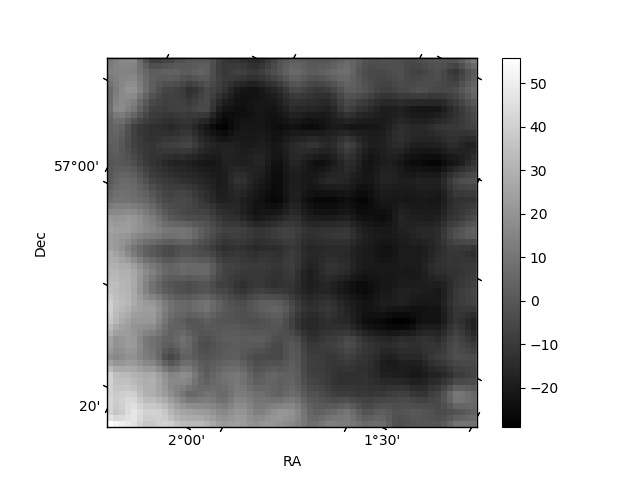
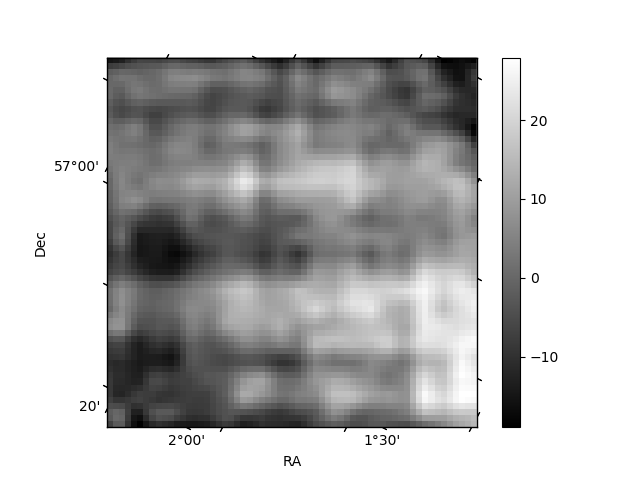
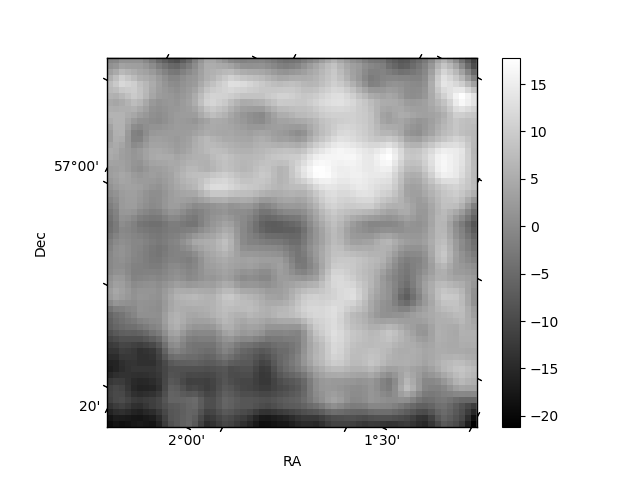
Histogram calculated using DETX and DETY for each event in the final _common_clean file
| Quadrant A | 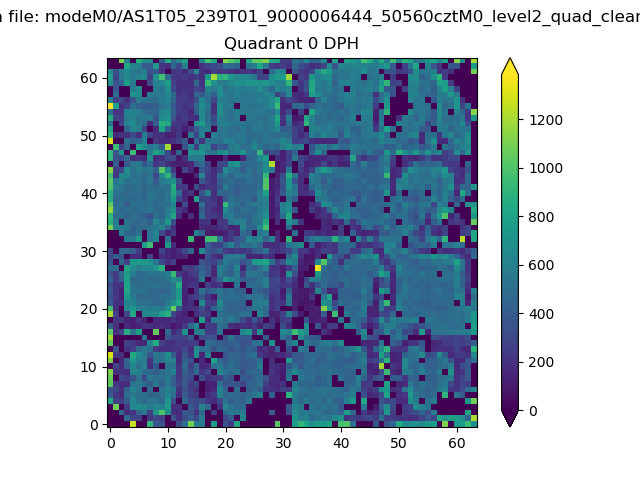 |
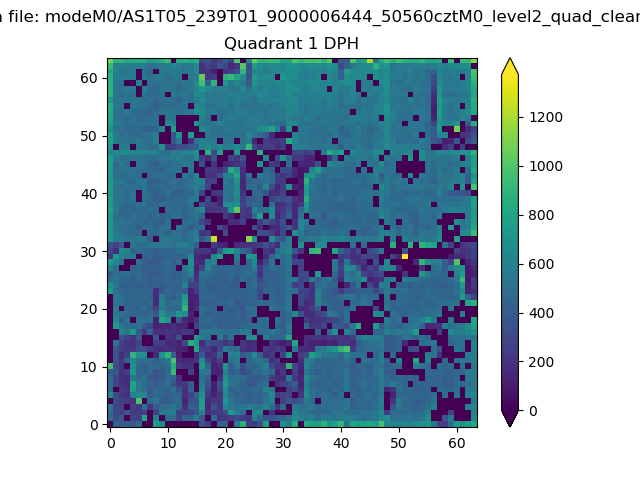 |
Quadrant B |
|---|---|---|---|
| Quadrant D | 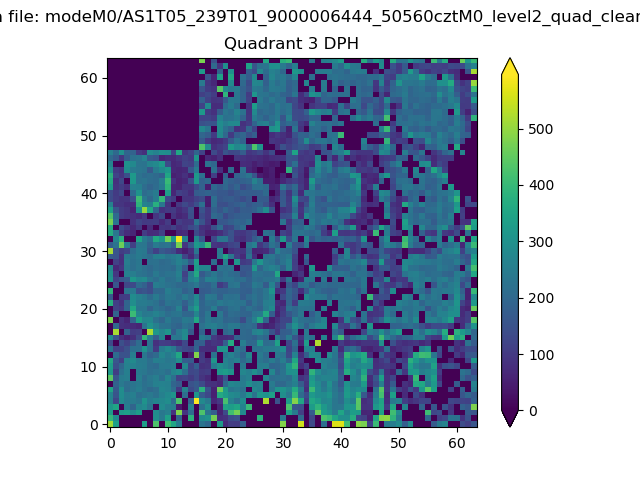 |
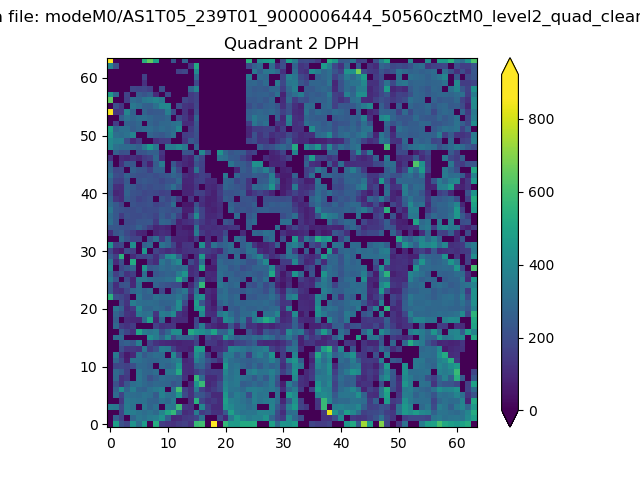 |
Quadrant C |
| Plot type | Count rate plots | Images |
|---|---|---|
| Comparison with Poisson distribution Blue bars denote a histogram of data divided into 1 sec bins. Red curve is a Poisson curve with rate = median count rate of data. |
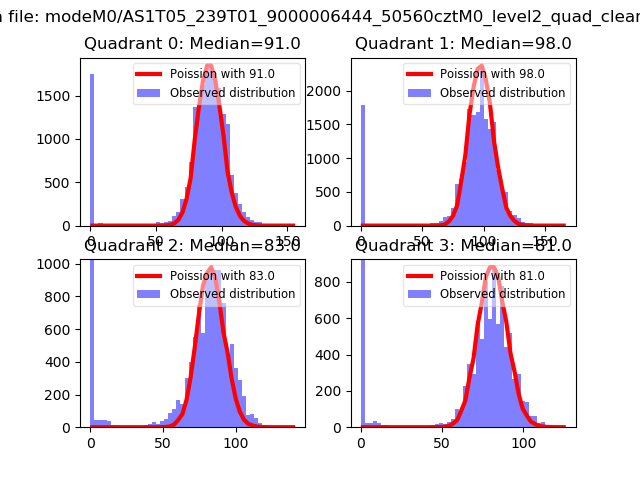 |
 |
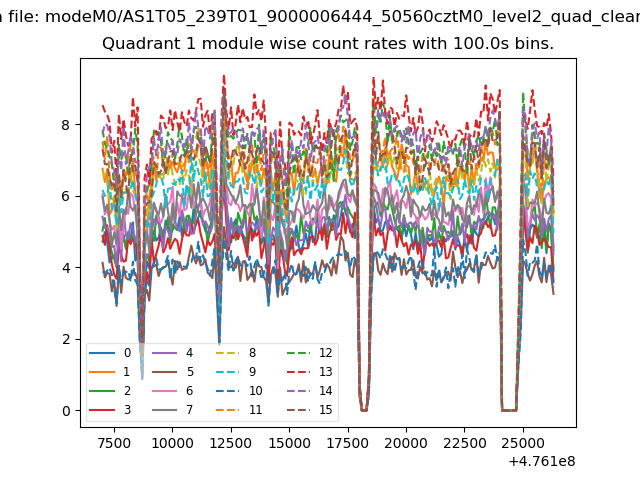
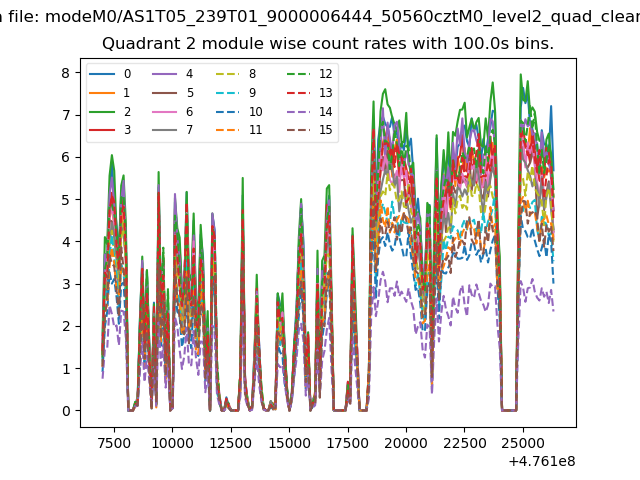
| Quadrant-wise count rates Data is divided into 100 sec bins |
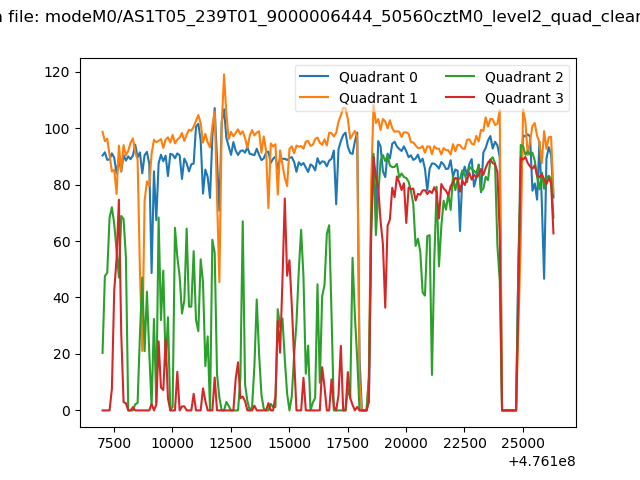 |
|
| Module-wise count rates for Quadrant A Data is divided into 100 sec bins |
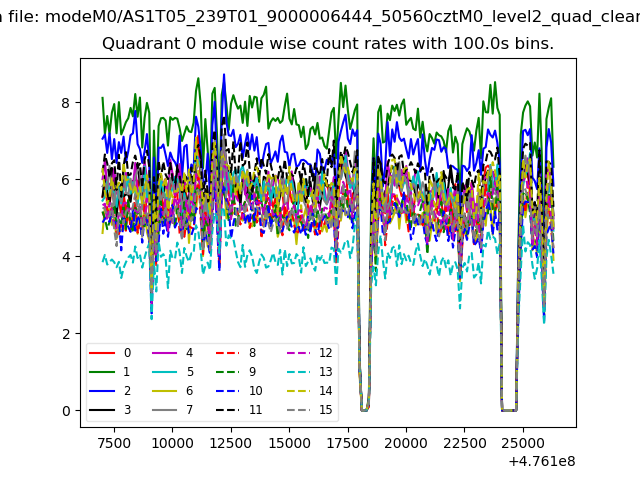 |
 |
| Module-wise count rates for Quadrant B Data is divided into 100 sec bins |
 |
 |
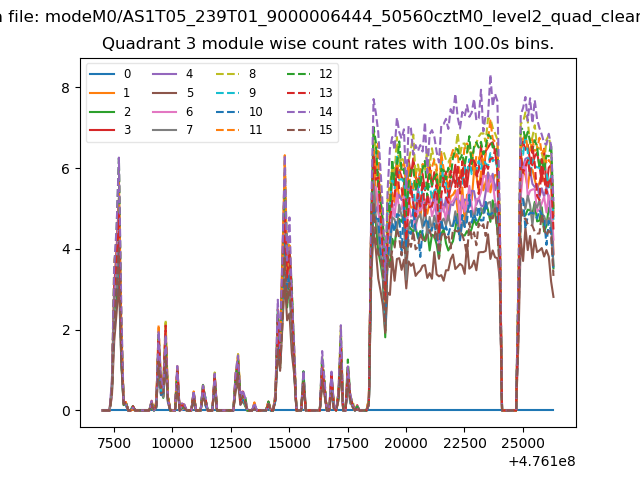
| Module-wise count rates for Quadrant C Data is divided into 100 sec bins |
 |
 |
| Module-wise count rates for Quadrant D Data is divided into 100 sec bins |
 |
 |
| Parameter | Plot |
|---|---|
| CZT HV Monitor | 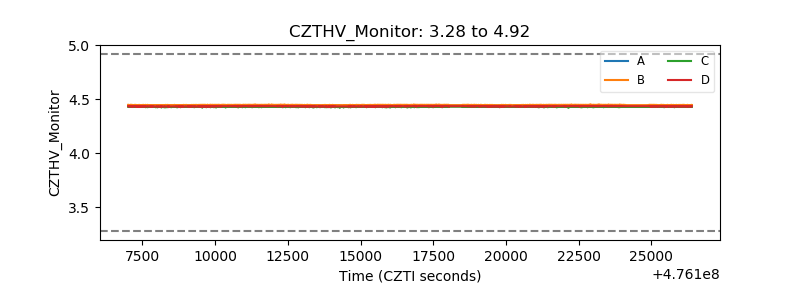 |
| D_VDD | 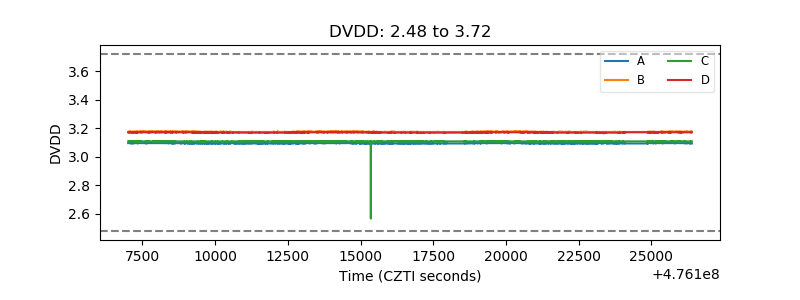 |
| Temperature 1 | 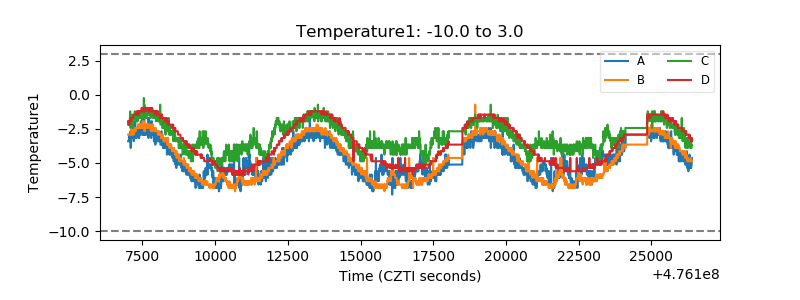 |
| Veto HV Monitor |  |
| Veto LLD | 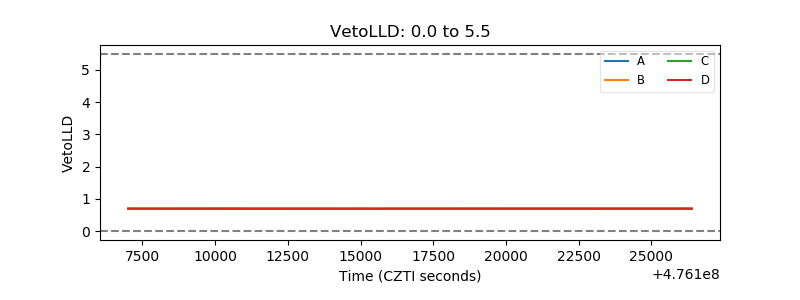 |
| Alpha Counter | 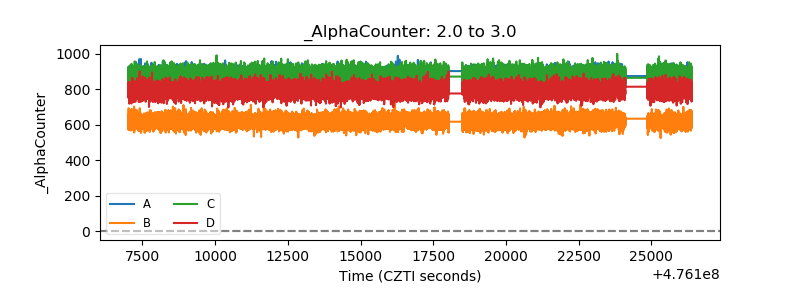 |
| _CPM_Rate | 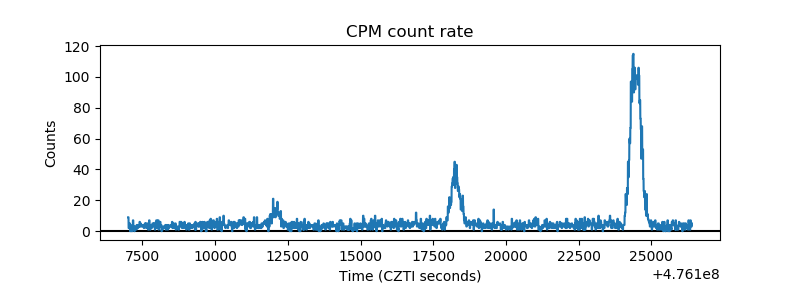 |
| CZT Counter | 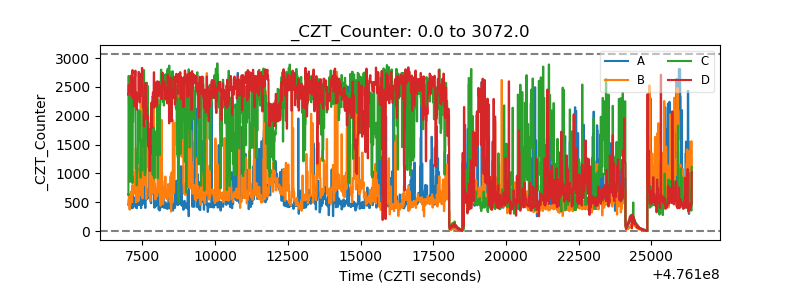 |
| +2.5 Volts monitor | 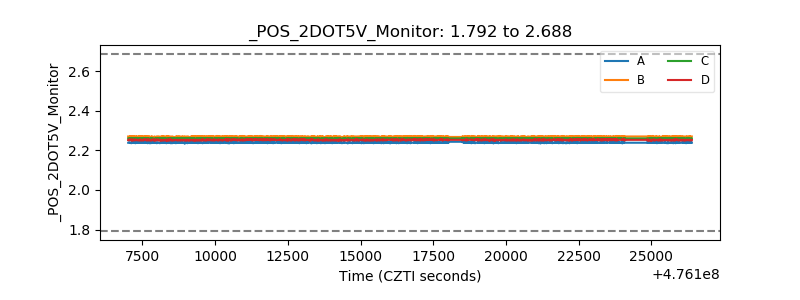 |
| +5 Volts monitor |  |
| _ROLL_ROT | 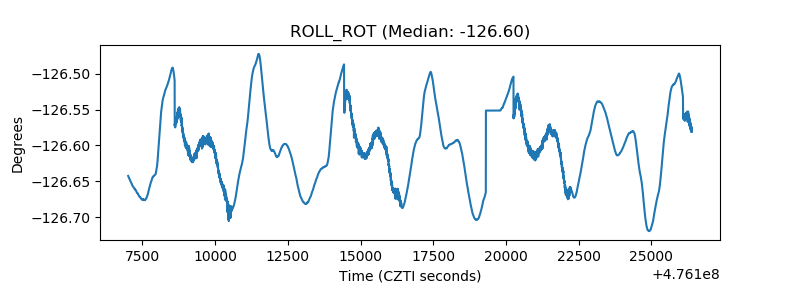 |
| _Roll_DEC | 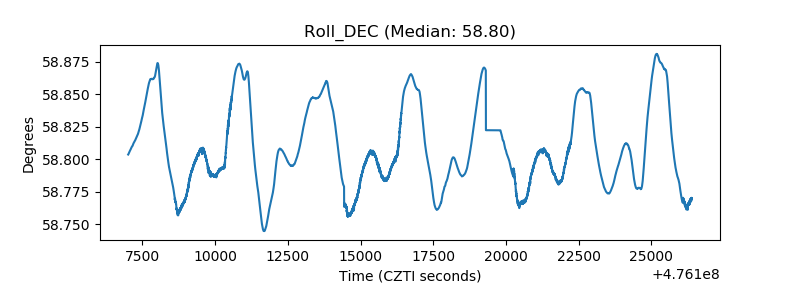 |
| _Roll_RA | 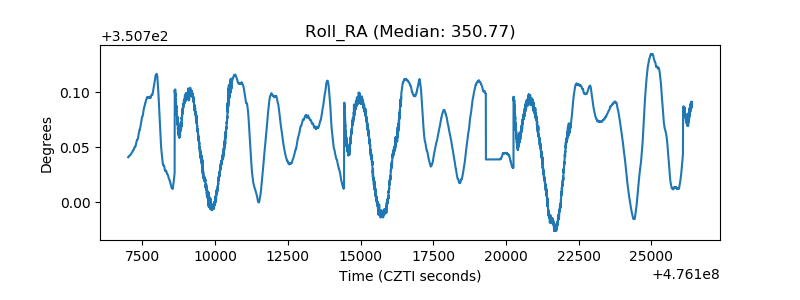 |
| Veto Counter | 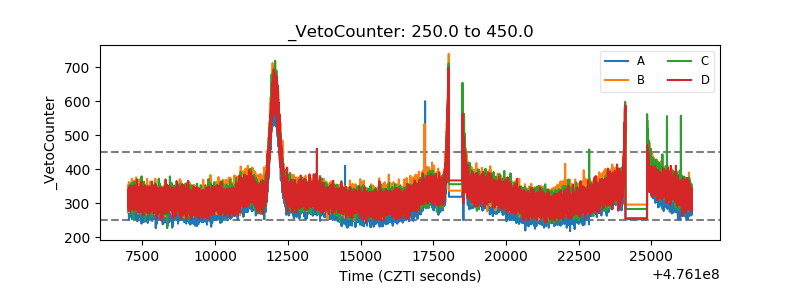 |