| Param | Original file | Final file |
|---|---|---|
| Filename | modeM0/AS1T05_239T01_9000006444_50561cztM0_level2.fits | modeM0/AS1T05_239T01_9000006444_50561cztM0_level2_quad_clean.evt |
| Size (bytes) | 543,856,320 | 95,160,960 |
| Size | 518.7 MB | 90.8 MB |
| Events in quadrant A | 5,329,007 | 601,187 |
| Events in quadrant B | 4,992,586 | 657,997 |
| Events in quadrant C | 5,232,401 | 581,156 |
| Events in quadrant D | 4,055,404 | 571,546 |
| Mode M0 | |||
|---|---|---|---|
| Quadrant | BADHDUFLAG | Total packets | Discarded packets |
| A | 0 | 20449 | 1 |
| B | 0 | 19628 | 1 |
| C | 0 | 20022 | 1 |
| D | 0 | 16719 | 2 |
| Mode M9 | |||
|---|---|---|---|
| Quadrant | BADHDUFLAG | Total packets | Discarded packets |
| A | 0 | 10 | 0 |
| B | 0 | 10 | 0 |
| C | 0 | 10 | 0 |
| D | 0 | 10 | 0 |
| Mode SS | |||
|---|---|---|---|
| Quadrant | BADHDUFLAG | Total packets | Discarded packets |
| A | 0 | 136 | 0 |
| B | 0 | 136 | 0 |
| C | 0 | 136 | 0 |
| D | 0 | 136 | 0 |
| Quadrant | Total seconds | Saturated seconds | Saturation percentage |
|---|---|---|---|
| A | 6735 | 504 | 7.483296% |
| B | 6735 | 405 | 6.013363% |
| C | 6736 | 453 | 6.725059% |
| D | 6735 | 118 | 1.752042% |
Noise dominated data is calculated using 1-second bins in cleaned event files. If a bin has >2000 counts, and if more than 50% of those come from <1% of pixels, then it is considered to be noise-dominated and hence unusable.
| Quadrant | # 1 sec bins | Bins with >0 counts | Bins with >2000 counts | High rate bins dominated by noise | Noise dominated (total time) | Noise dominated (detector-on time) | Marked lightcurve |
|---|---|---|---|---|---|---|---|
| A | 7650 | 6736 | 441 | 441 | 5.76% | 6.55% | 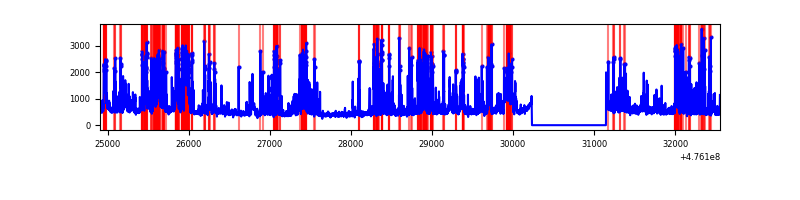 |
| B | 7650 | 6736 | 275 | 275 | 3.59% | 4.08% | 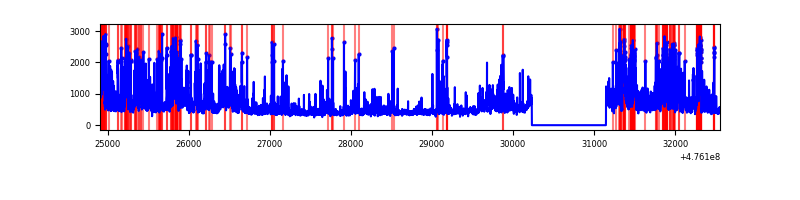 |
| C | 7651 | 6737 | 390 | 390 | 5.10% | 5.79% | 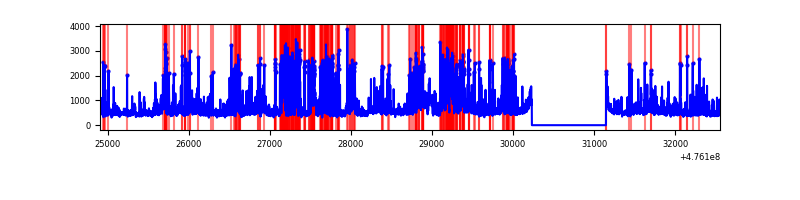 |
| D | 7650 | 6735 | 114 | 114 | 1.49% | 1.69% | 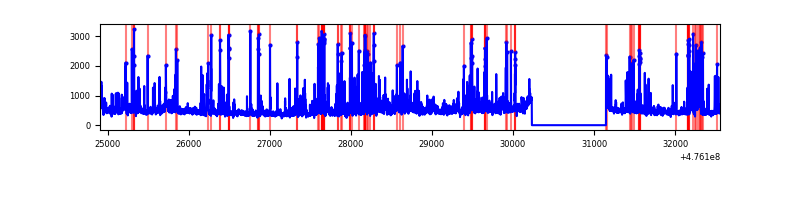 |
Top three noisy pixels from each quadrant. If the there are fewer than three noisy pixels in the level2.evt file, extra rows are filled as -1
| Pixel properties | Quadrant properties | ||||||
|---|---|---|---|---|---|---|---|
| Quadrant | DetID | PixID | Counts | Sigma | Mean | Median | Sigma |
| A | 8 | 247 | 501406 | 2916.17 | 694 | 679 | 171.7 |
| A | 4 | 207 | 389111 | 2262.18 | 694 | 679 | 171.7 |
| A | 3 | 130 | 385214 | 2239.48 | 694 | 679 | 171.7 |
| B | 0 | 229 | 657742 | 4420.25 | 693 | 668 | 148.7 |
| B | 7 | 0 | 337817 | 2268.06 | 693 | 668 | 148.7 |
| B | 4 | 206 | 232335 | 1558.46 | 693 | 668 | 148.7 |
| C | 15 | 178 | 658972 | 3508.68 | 679 | 675 | 187.6 |
| C | 13 | 3 | 408167 | 2171.9 | 679 | 675 | 187.6 |
| C | 15 | 196 | 291677 | 1551.02 | 679 | 675 | 187.6 |
| D | 2 | 249 | 370055 | 1920.51 | 691 | 666 | 192.3 |
| D | 6 | 42 | 203232 | 1053.17 | 691 | 666 | 192.3 |
| D | 11 | 161 | 178730 | 925.78 | 691 | 666 | 192.3 |
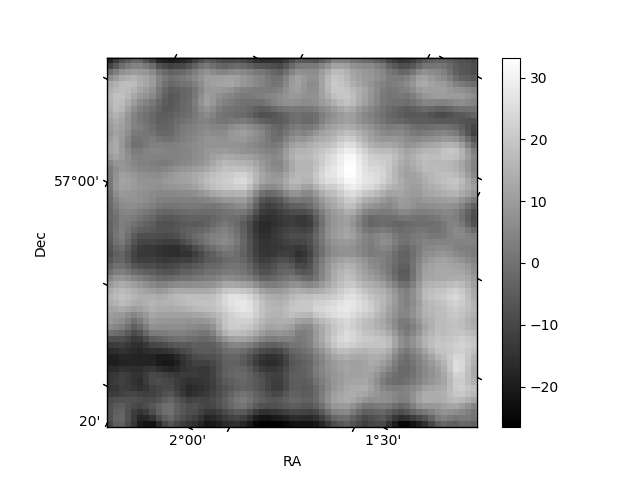
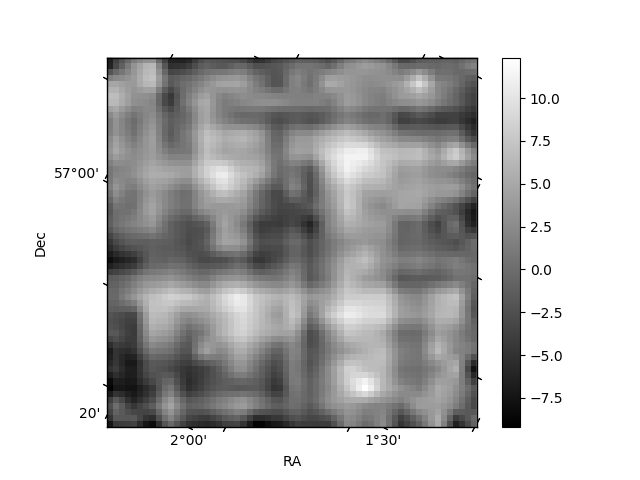
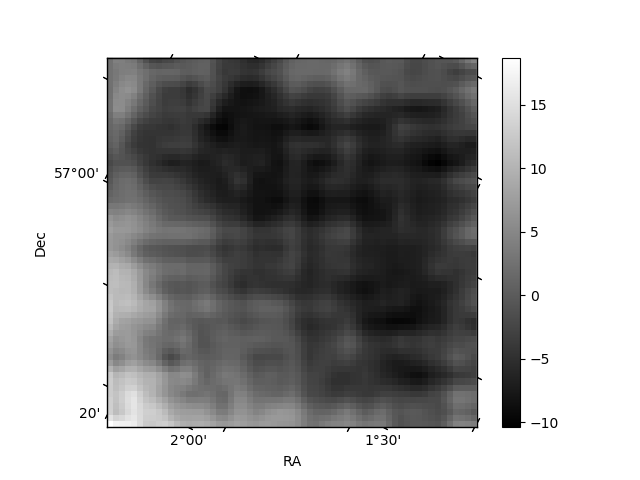
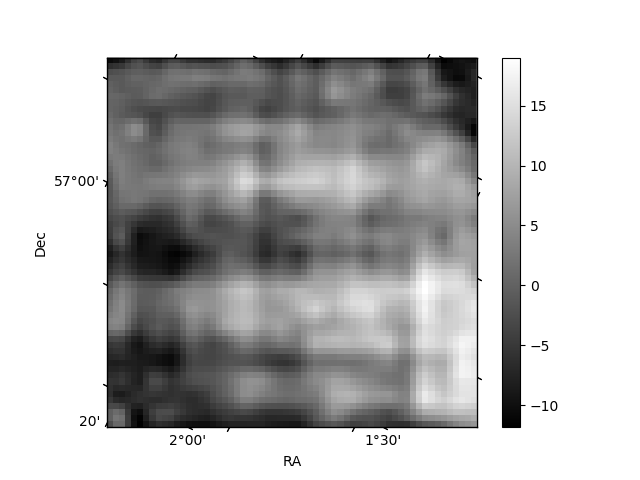
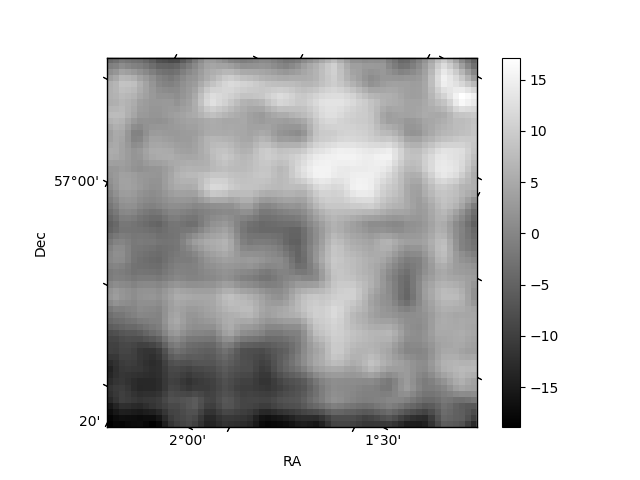
Histogram calculated using DETX and DETY for each event in the final _common_clean file
| Quadrant A | 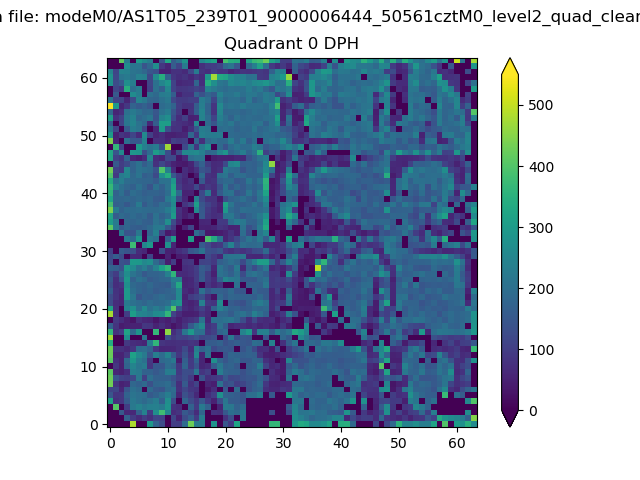 |
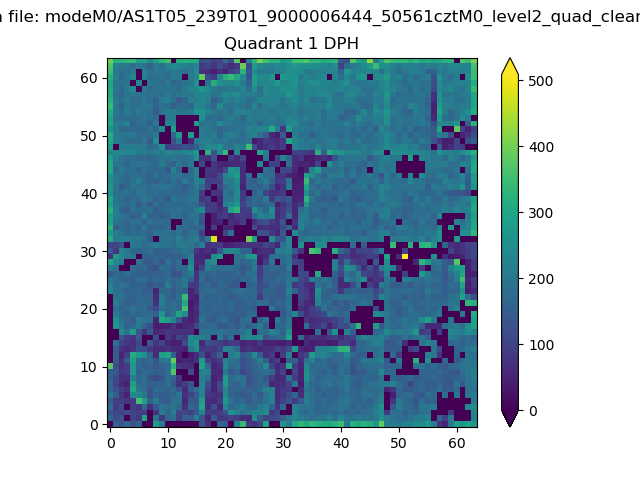 |
Quadrant B |
|---|---|---|---|
| Quadrant D | 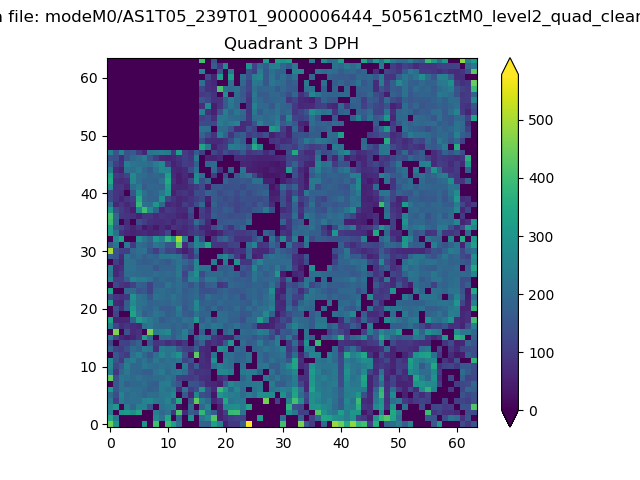 |
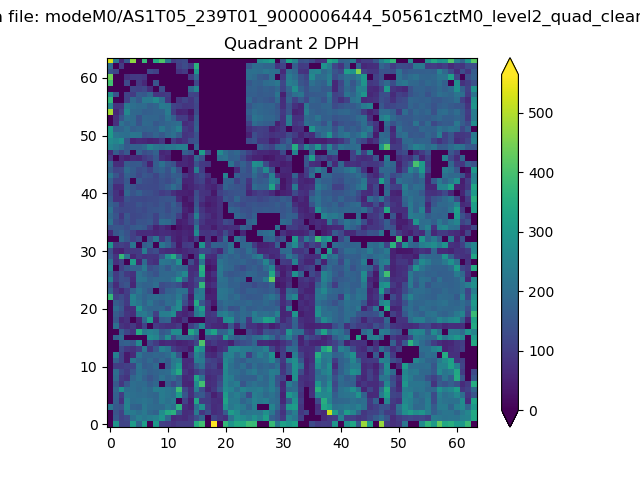 |
Quadrant C |
| Plot type | Count rate plots | Images |
|---|---|---|
| Comparison with Poisson distribution Blue bars denote a histogram of data divided into 1 sec bins. Red curve is a Poisson curve with rate = median count rate of data. |
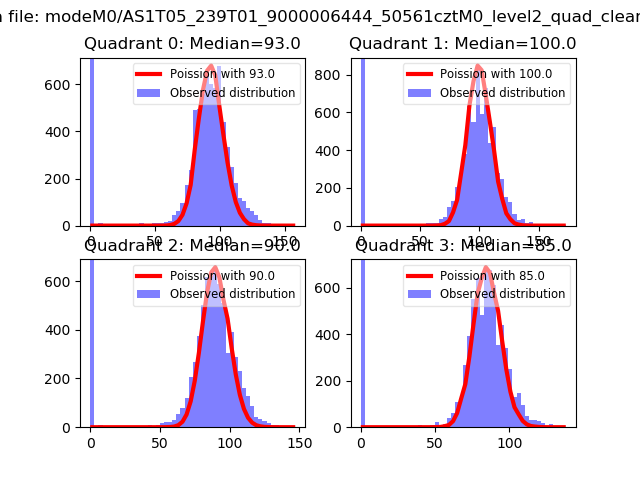 |
 |
| Quadrant-wise count rates Data is divided into 100 sec bins |
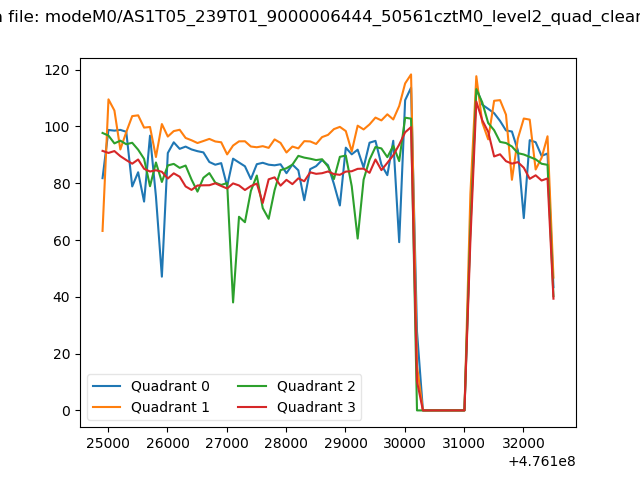 |
|
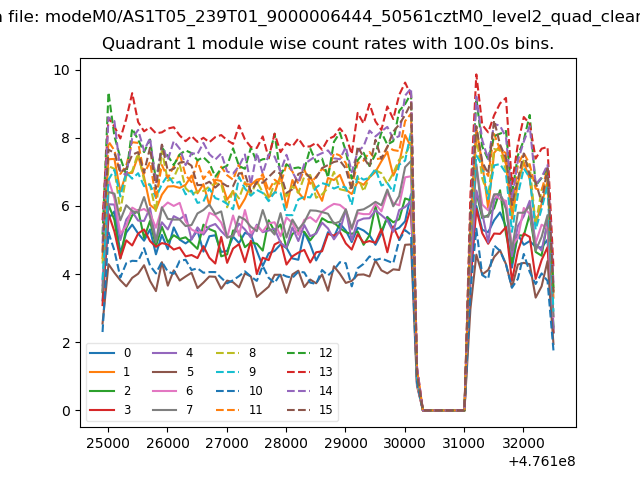
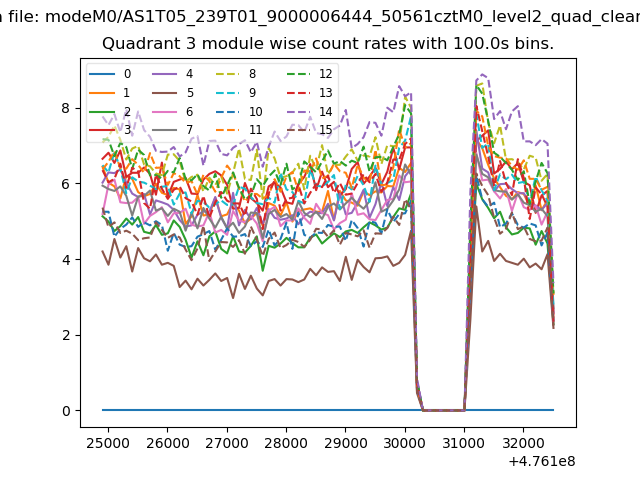
| Module-wise count rates for Quadrant A Data is divided into 100 sec bins |
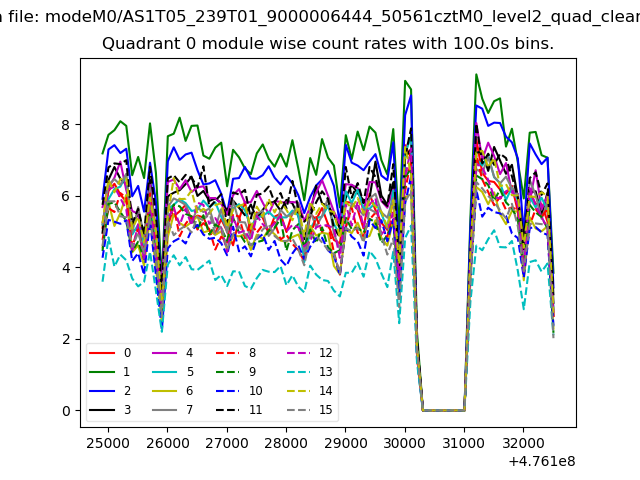 |
 |
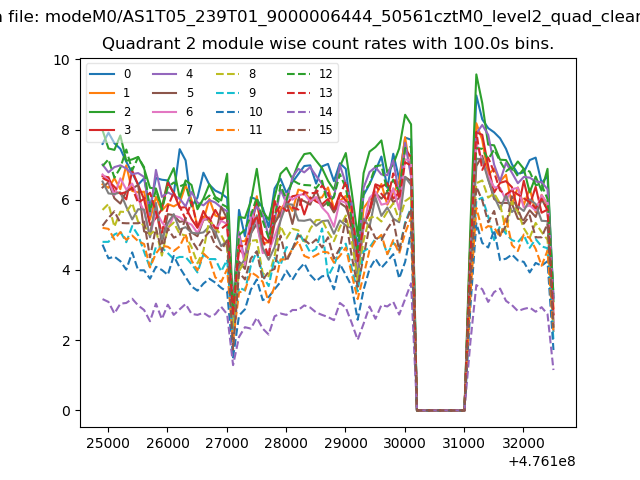
| Module-wise count rates for Quadrant B Data is divided into 100 sec bins |
 |
 |
| Module-wise count rates for Quadrant C Data is divided into 100 sec bins |
 |
 |
| Module-wise count rates for Quadrant D Data is divided into 100 sec bins |
 |
 |
| Parameter | Plot |
|---|---|
| CZT HV Monitor |  |
| D_VDD | 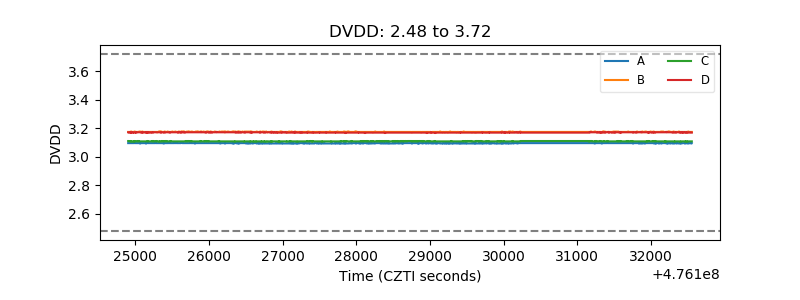 |
| Temperature 1 | 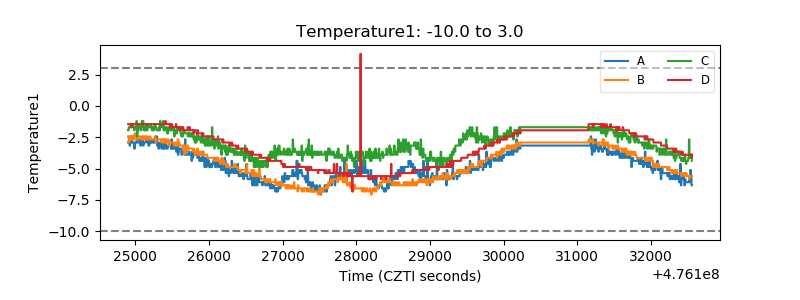 |
| Veto HV Monitor | 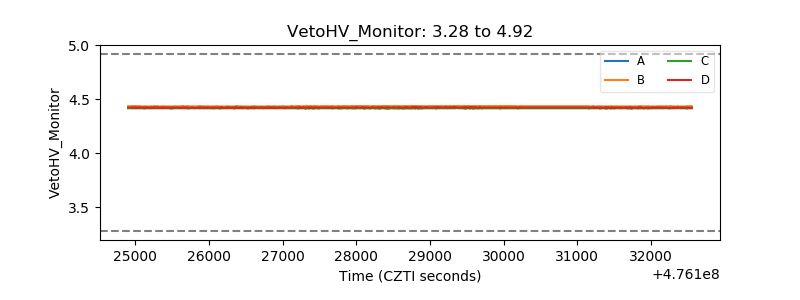 |
| Veto LLD | 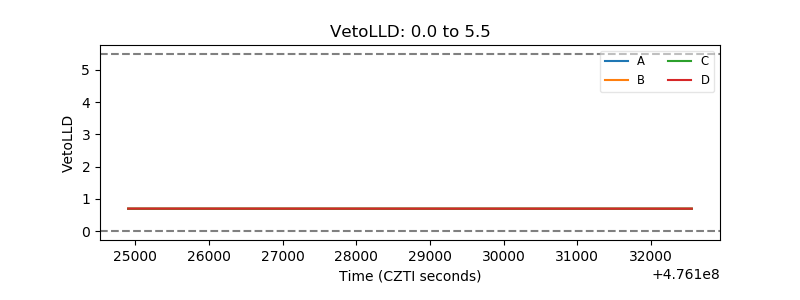 |
| Alpha Counter | 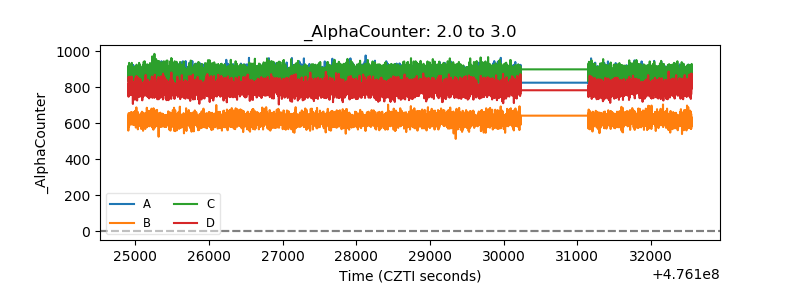 |
| _CPM_Rate | 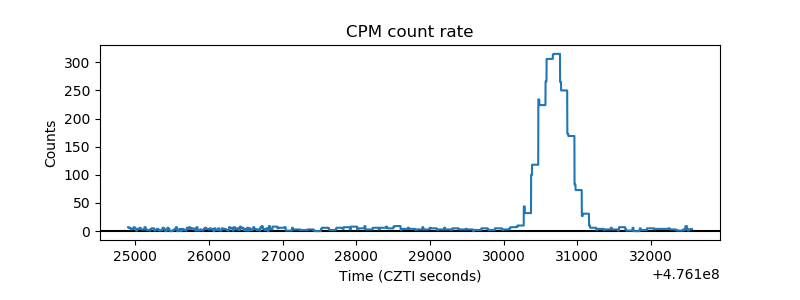 |
| CZT Counter | 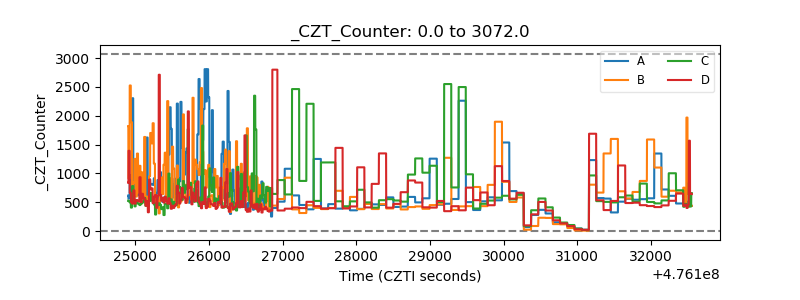 |
| +2.5 Volts monitor | 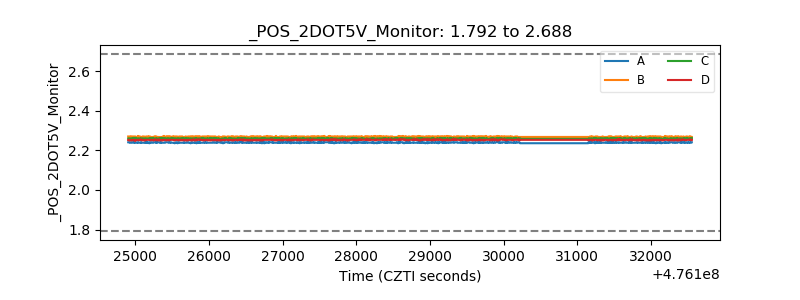 |
| +5 Volts monitor |  |
| _ROLL_ROT | 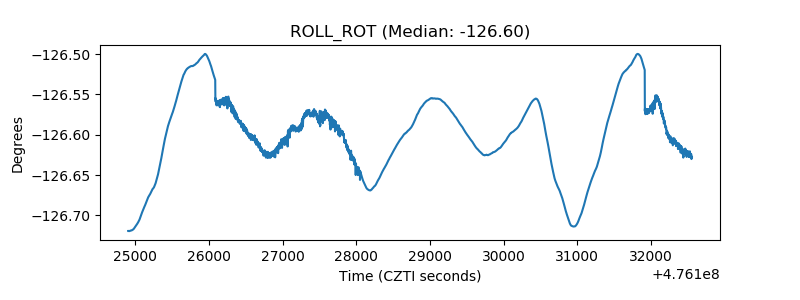 |
| _Roll_DEC | 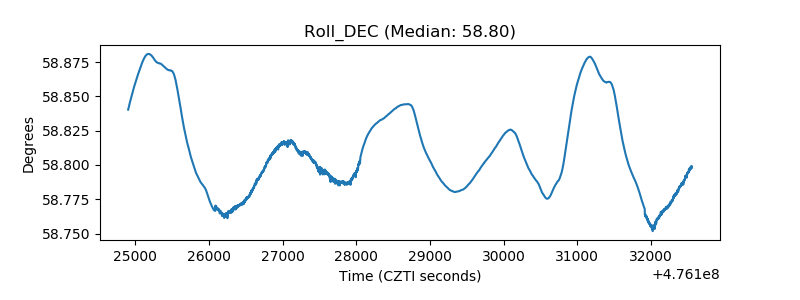 |
| _Roll_RA | 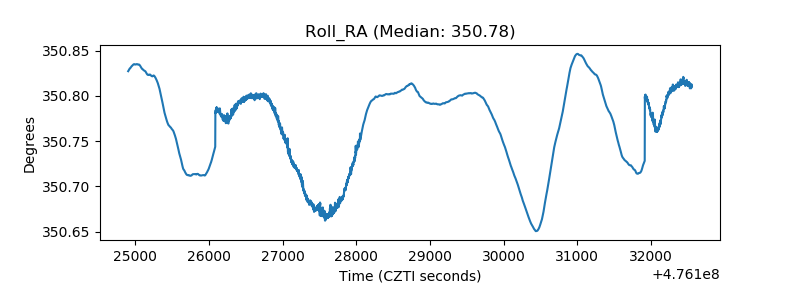 |
| Veto Counter | 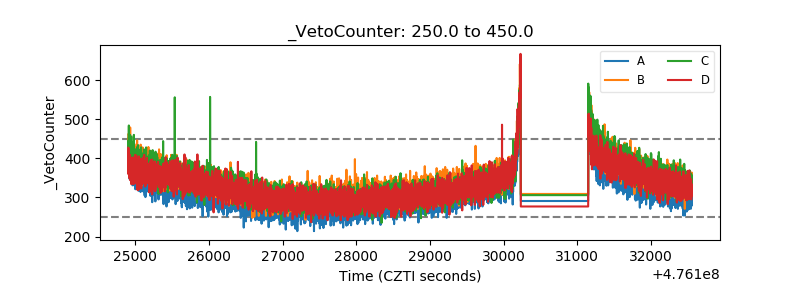 |