| Param | Original file | Final file |
|---|---|---|
| Filename | modeM0/AS1T05_239T01_9000006444_50563cztM0_level2.fits | modeM0/AS1T05_239T01_9000006444_50563cztM0_level2_quad_clean.evt |
| Size (bytes) | 574,145,280 | 96,252,480 |
| Size | 547.5 MB | 91.8 MB |
| Events in quadrant A | 5,409,273 | 609,696 |
| Events in quadrant B | 5,661,172 | 664,320 |
| Events in quadrant C | 5,171,008 | 592,419 |
| Events in quadrant D | 4,485,073 | 574,433 |
| Mode M0 | |||
|---|---|---|---|
| Quadrant | BADHDUFLAG | Total packets | Discarded packets |
| A | 0 | 20636 | 1 |
| B | 0 | 21580 | 1 |
| C | 0 | 20094 | 1 |
| D | 0 | 18048 | 1 |
| Mode M9 | |||
|---|---|---|---|
| Quadrant | BADHDUFLAG | Total packets | Discarded packets |
| A | 0 | 13 | 0 |
| B | 0 | 13 | 0 |
| C | 0 | 14 | 0 |
| D | 0 | 14 | 0 |
| Mode SS | |||
|---|---|---|---|
| Quadrant | BADHDUFLAG | Total packets | Discarded packets |
| A | 0 | 138 | 0 |
| B | 0 | 138 | 0 |
| C | 0 | 138 | 0 |
| D | 0 | 138 | 0 |
| Quadrant | Total seconds | Saturated seconds | Saturation percentage |
|---|---|---|---|
| A | 6792 | 532 | 7.832744% |
| B | 6792 | 550 | 8.097762% |
| C | 6792 | 457 | 6.728504% |
| D | 6792 | 243 | 3.577739% |
Noise dominated data is calculated using 1-second bins in cleaned event files. If a bin has >2000 counts, and if more than 50% of those come from <1% of pixels, then it is considered to be noise-dominated and hence unusable.
| Quadrant | # 1 sec bins | Bins with >0 counts | Bins with >2000 counts | High rate bins dominated by noise | Noise dominated (total time) | Noise dominated (detector-on time) | Marked lightcurve |
|---|---|---|---|---|---|---|---|
| A | 7822 | 6792 | 446 | 446 | 5.70% | 6.57% | 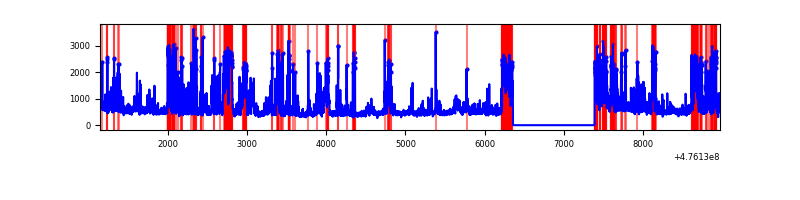 |
| B | 7822 | 6792 | 408 | 408 | 5.22% | 6.01% | 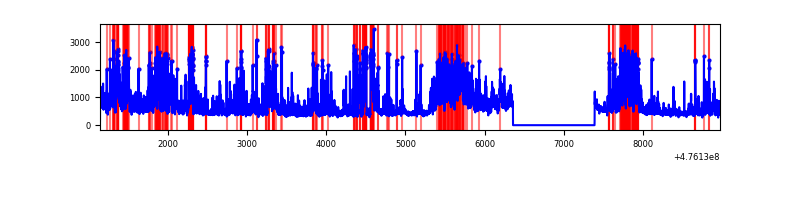 |
| C | 7822 | 6792 | 376 | 376 | 4.81% | 5.54% | 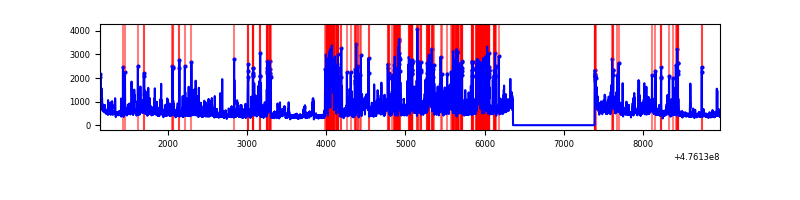 |
| D | 7822 | 6792 | 207 | 207 | 2.65% | 3.05% | 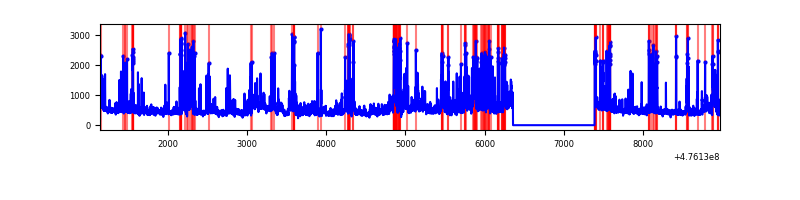 |
Top three noisy pixels from each quadrant. If the there are fewer than three noisy pixels in the level2.evt file, extra rows are filled as -1
| Pixel properties | Quadrant properties | ||||||
|---|---|---|---|---|---|---|---|
| Quadrant | DetID | PixID | Counts | Sigma | Mean | Median | Sigma |
| A | 3 | 130 | 687340 | 3956.28 | 698 | 681 | 173.6 |
| A | 12 | 250 | 625172 | 3598.09 | 698 | 681 | 173.6 |
| A | 8 | 247 | 226579 | 1301.54 | 698 | 681 | 173.6 |
| B | 0 | 229 | 852955 | 5714.68 | 702 | 679 | 149.1 |
| B | 1 | 255 | 644825 | 4319.13 | 702 | 679 | 149.1 |
| B | 7 | 0 | 621238 | 4160.97 | 702 | 679 | 149.1 |
| C | 15 | 196 | 434916 | 2268.22 | 693 | 689 | 191.4 |
| C | 15 | 178 | 340513 | 1775.1 | 693 | 689 | 191.4 |
| C | 13 | 3 | 221311 | 1152.44 | 693 | 689 | 191.4 |
| D | 2 | 249 | 314897 | 1620.31 | 696 | 673 | 193.9 |
| D | 7 | 126 | 288946 | 1486.49 | 696 | 673 | 193.9 |
| D | 6 | 42 | 261479 | 1344.86 | 696 | 673 | 193.9 |
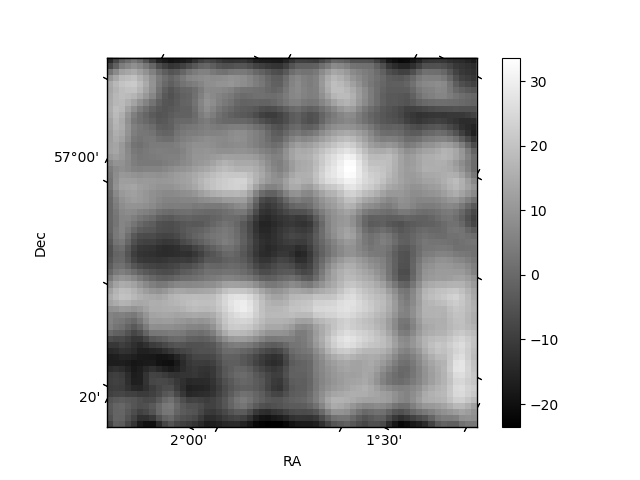
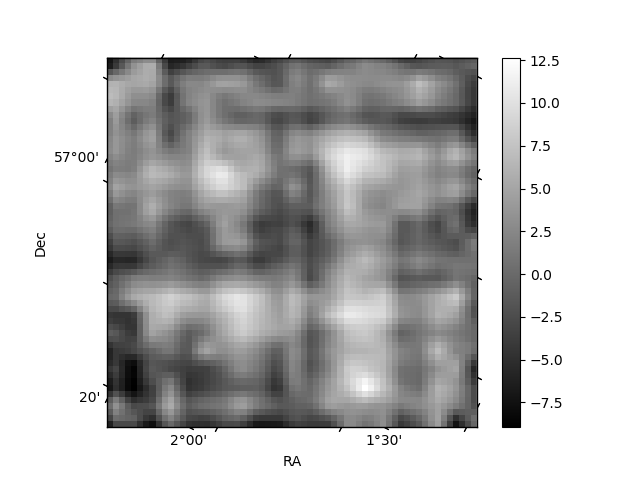
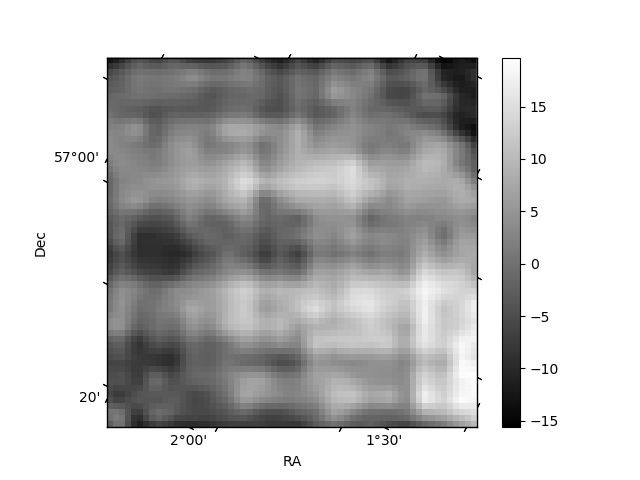
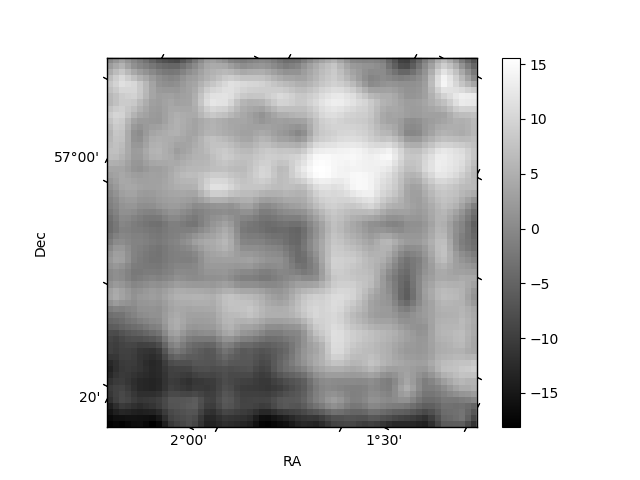
Histogram calculated using DETX and DETY for each event in the final _common_clean file
| Quadrant A | 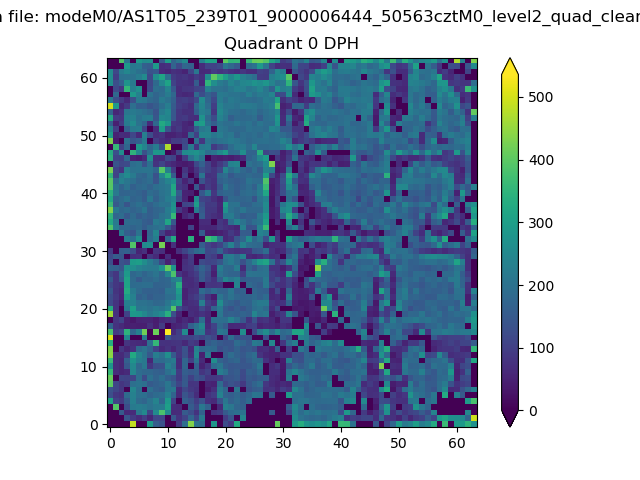 |
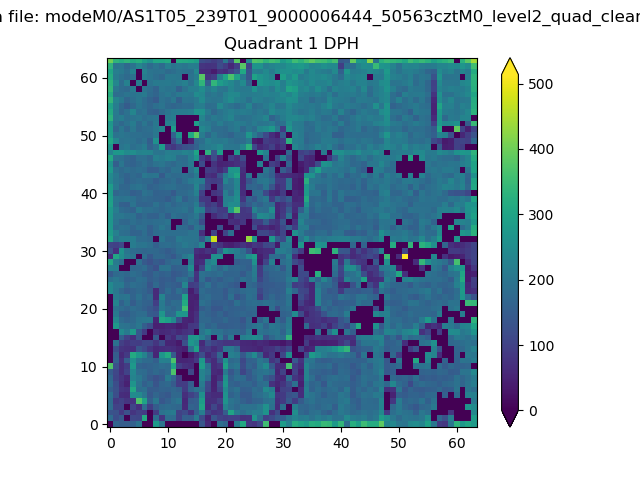 |
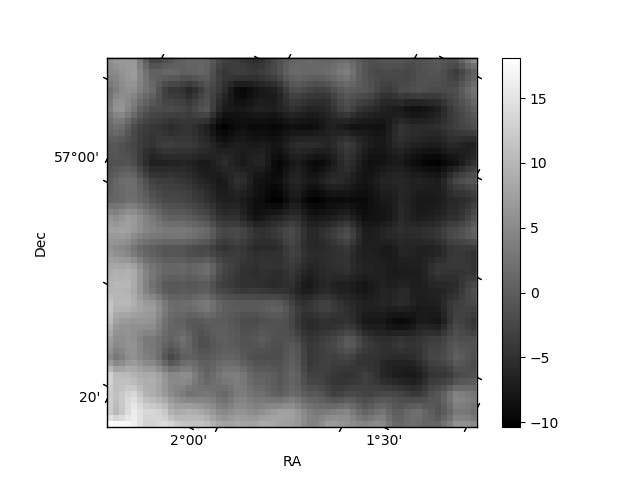
Quadrant B |
|---|---|---|---|
| Quadrant D | 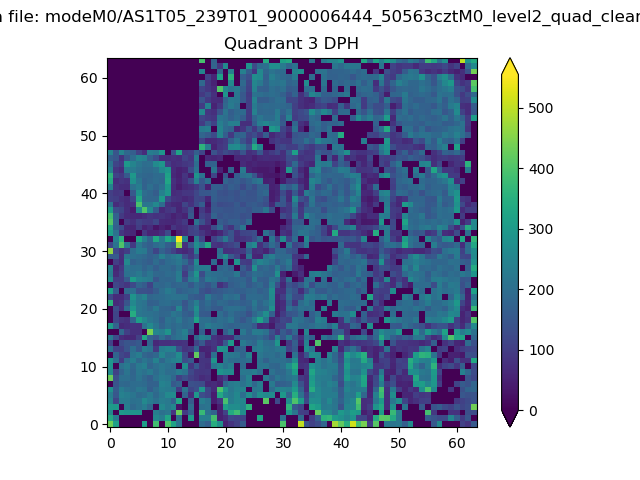 |
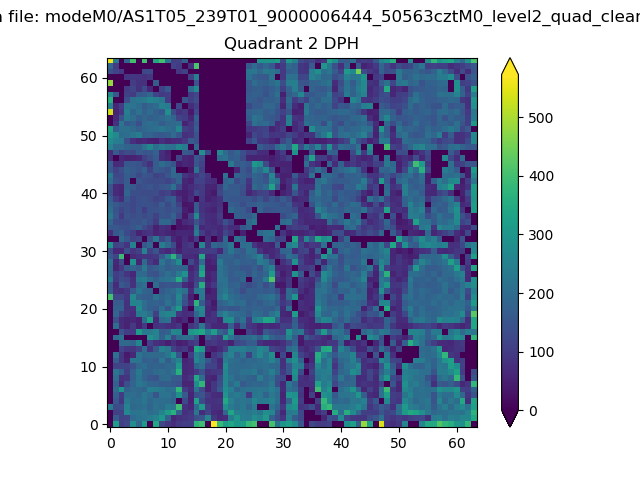 |
Quadrant C |
| Plot type | Count rate plots | Images |
|---|---|---|
| Comparison with Poisson distribution Blue bars denote a histogram of data divided into 1 sec bins. Red curve is a Poisson curve with rate = median count rate of data. |
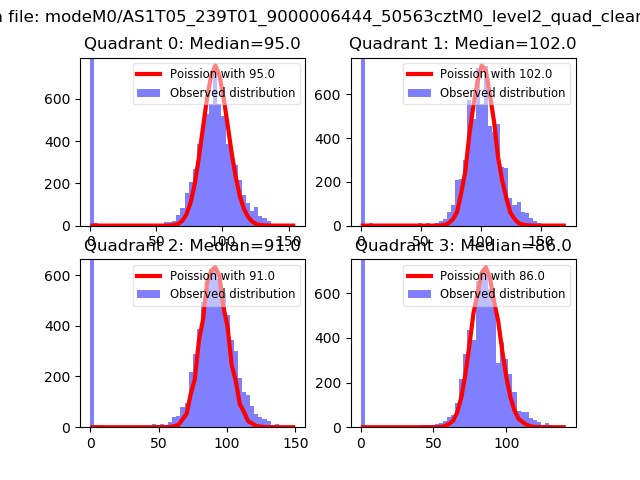 |
 |
| Quadrant-wise count rates Data is divided into 100 sec bins |
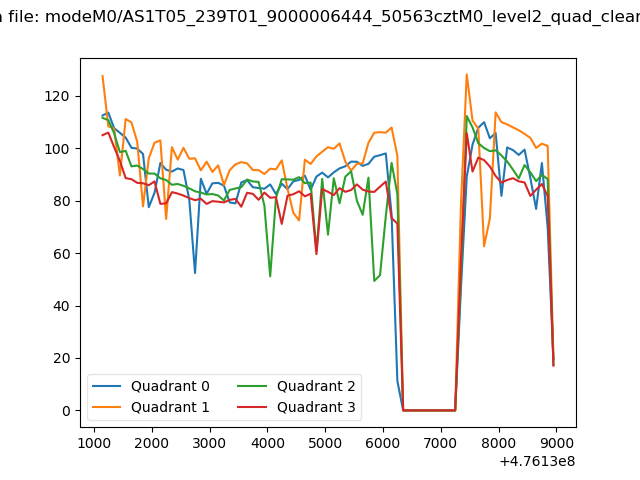 |
|
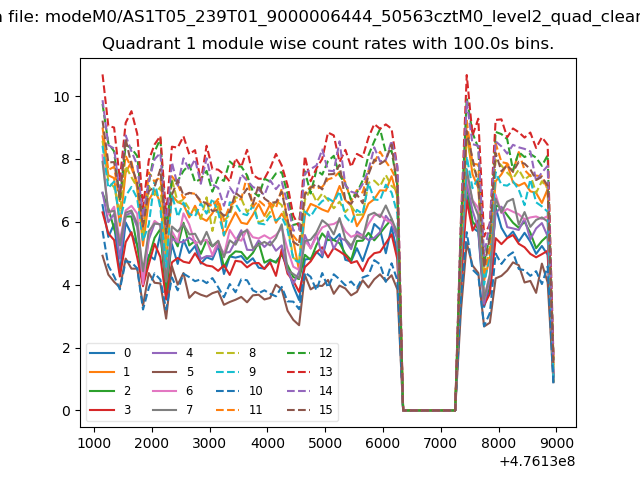
| Module-wise count rates for Quadrant A Data is divided into 100 sec bins |
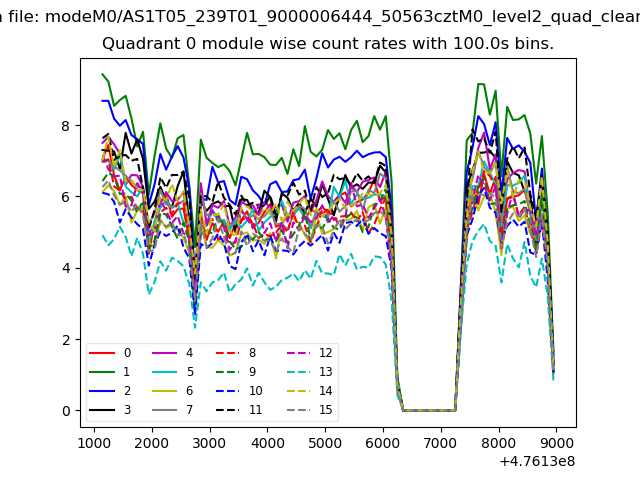 |
 |
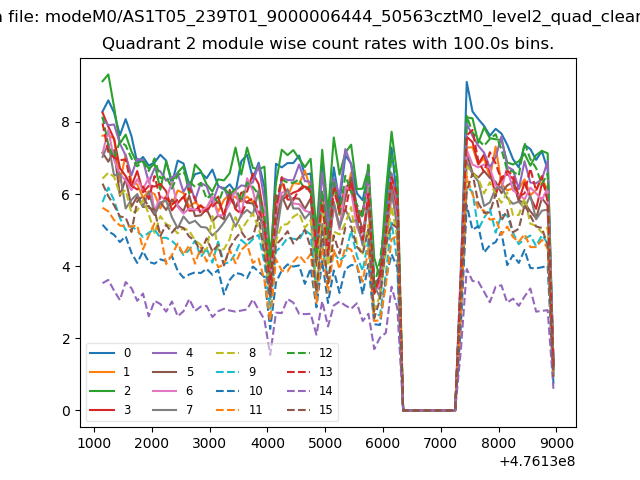
| Module-wise count rates for Quadrant B Data is divided into 100 sec bins |
 |
 |
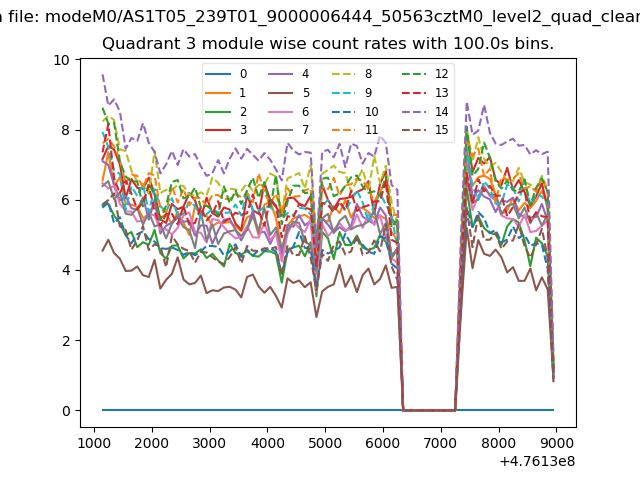
| Module-wise count rates for Quadrant C Data is divided into 100 sec bins |
 |
 |
| Module-wise count rates for Quadrant D Data is divided into 100 sec bins |
 |
 |
| Parameter | Plot |
|---|---|
| CZT HV Monitor | 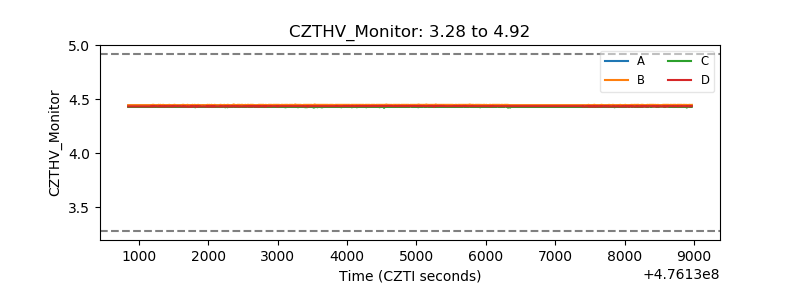 |
| D_VDD | 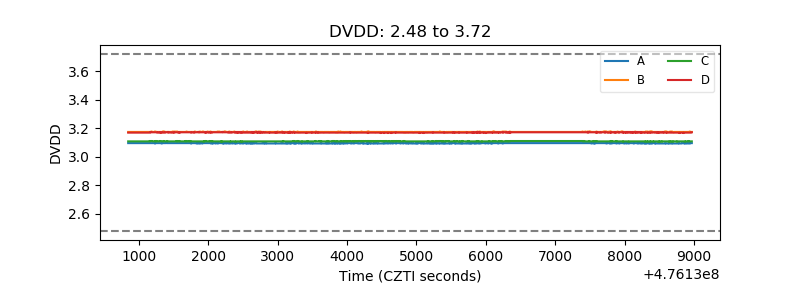 |
| Temperature 1 | 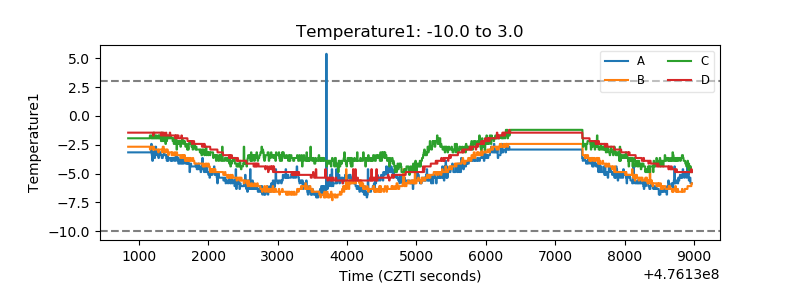 |
| Veto HV Monitor | 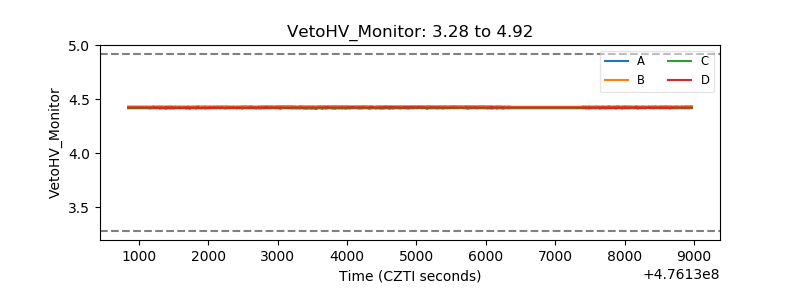 |
| Veto LLD | 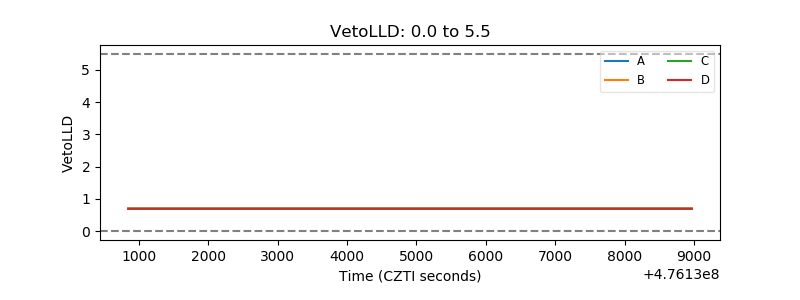 |
| Alpha Counter | 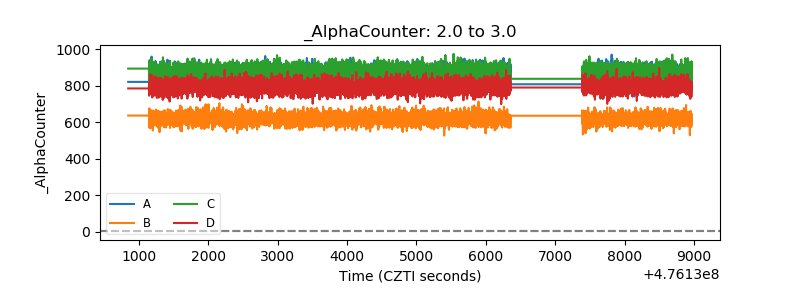 |
| _CPM_Rate | 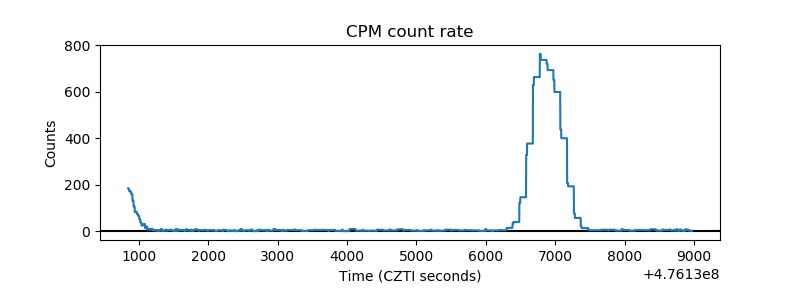 |
| CZT Counter | 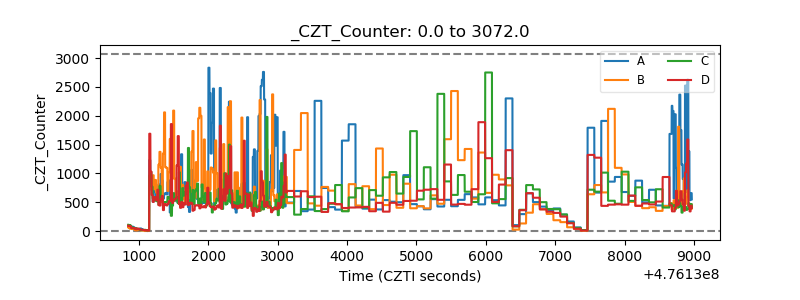 |
| +2.5 Volts monitor | 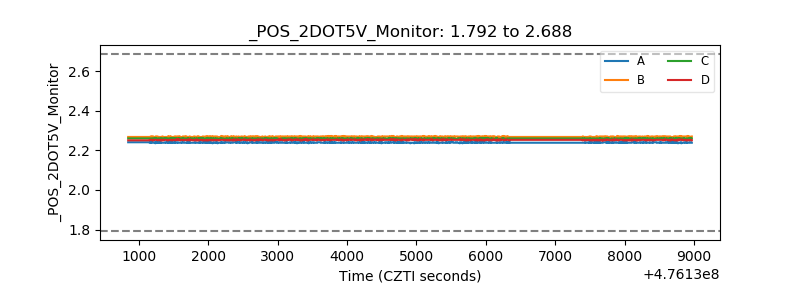 |
| +5 Volts monitor |  |
| _ROLL_ROT | 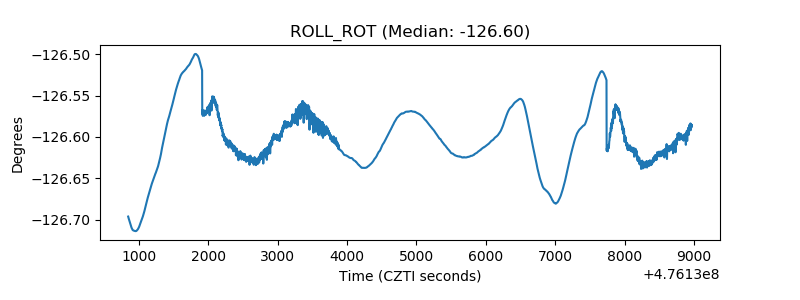 |
| _Roll_DEC | 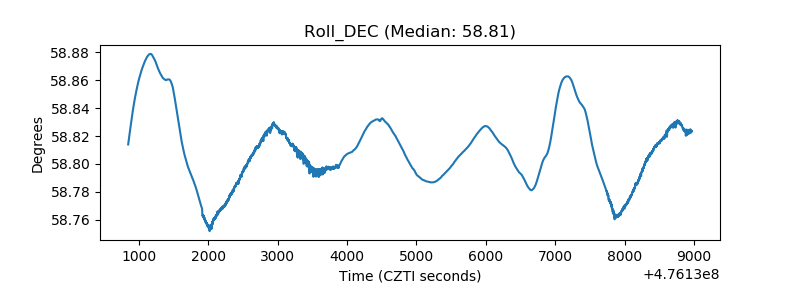 |
| _Roll_RA | 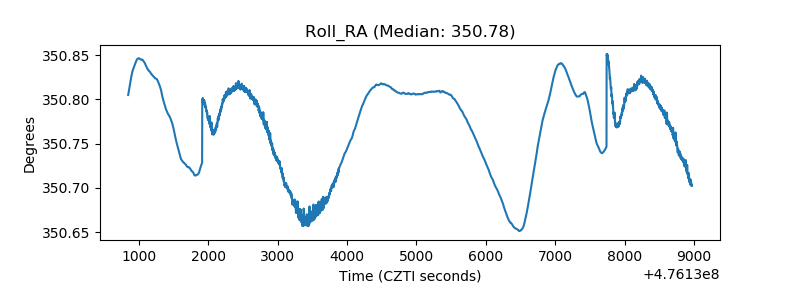 |
| Veto Counter | 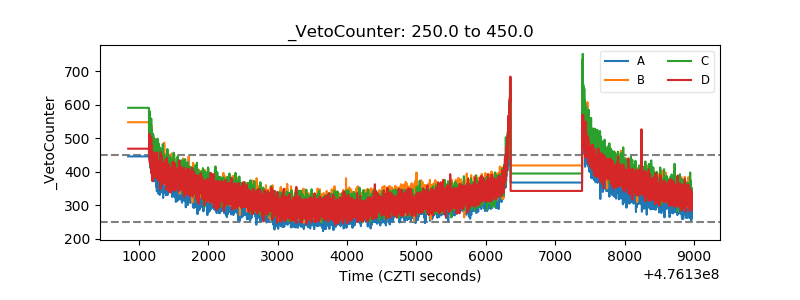 |