| Param | Original file | Final file |
|---|---|---|
| Filename | modeM0/AS1T05_239T01_9000006444_50564cztM0_level2.fits | modeM0/AS1T05_239T01_9000006444_50564cztM0_level2_quad_clean.evt |
| Size (bytes) | 631,938,240 | 91,353,600 |
| Size | 602.7 MB | 87.1 MB |
| Events in quadrant A | 4,935,687 | 615,826 |
| Events in quadrant B | 4,525,081 | 673,080 |
| Events in quadrant C | 6,877,372 | 516,484 |
| Events in quadrant D | 6,547,309 | 504,696 |
| Mode M0 | |||
|---|---|---|---|
| Quadrant | BADHDUFLAG | Total packets | Discarded packets |
| A | 0 | 19061 | 1 |
| B | 0 | 18072 | 1 |
| C | 0 | 24803 | 1 |
| D | 0 | 23980 | 5 |
| Mode M9 | |||
|---|---|---|---|
| Quadrant | BADHDUFLAG | Total packets | Discarded packets |
| A | 0 | 19 | 0 |
| B | 0 | 20 | 0 |
| C | 0 | 20 | 0 |
| D | 0 | 20 | 0 |
| Mode SS | |||
|---|---|---|---|
| Quadrant | BADHDUFLAG | Total packets | Discarded packets |
| A | 0 | 132 | 0 |
| B | 0 | 132 | 0 |
| C | 0 | 132 | 0 |
| D | 0 | 132 | 0 |
| Quadrant | Total seconds | Saturated seconds | Saturation percentage |
|---|---|---|---|
| A | 6538 | 331 | 5.062710% |
| B | 6538 | 367 | 5.613337% |
| C | 6538 | 1291 | 19.746100% |
| D | 6537 | 996 | 15.236347% |
Noise dominated data is calculated using 1-second bins in cleaned event files. If a bin has >2000 counts, and if more than 50% of those come from <1% of pixels, then it is considered to be noise-dominated and hence unusable.
| Quadrant | # 1 sec bins | Bins with >0 counts | Bins with >2000 counts | High rate bins dominated by noise | Noise dominated (total time) | Noise dominated (detector-on time) | Marked lightcurve |
|---|---|---|---|---|---|---|---|
| A | 7723 | 6539 | 322 | 322 | 4.17% | 4.92% | 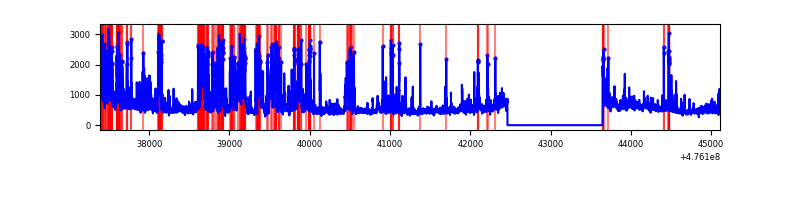 |
| B | 7723 | 6538 | 263 | 263 | 3.41% | 4.02% | 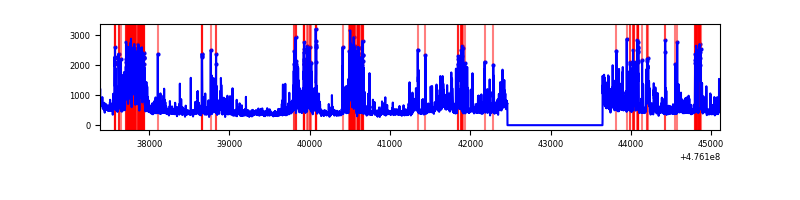 |
| C | 7723 | 6538 | 1157 | 1157 | 14.98% | 17.70% | 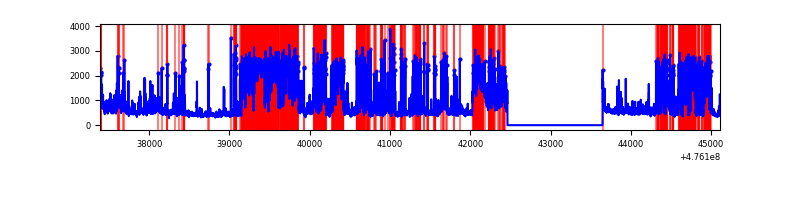 |
| D | 7722 | 6538 | 1019 | 1019 | 13.20% | 15.59% | 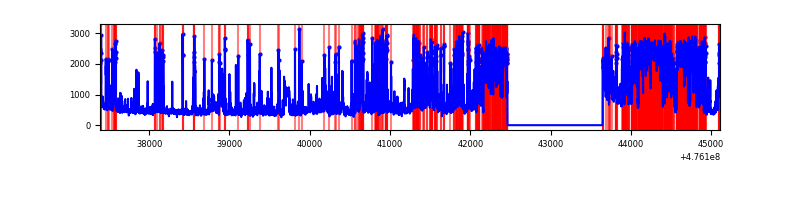 |
Top three noisy pixels from each quadrant. If the there are fewer than three noisy pixels in the level2.evt file, extra rows are filled as -1
| Pixel properties | Quadrant properties | ||||||
|---|---|---|---|---|---|---|---|
| Quadrant | DetID | PixID | Counts | Sigma | Mean | Median | Sigma |
| A | 8 | 247 | 558164 | 3220.21 | 691 | 672 | 173.1 |
| A | 12 | 250 | 492449 | 2840.63 | 691 | 672 | 173.1 |
| A | 3 | 130 | 349279 | 2013.64 | 691 | 672 | 173.1 |
| B | 0 | 229 | 603409 | 4114.54 | 689 | 666 | 146.5 |
| B | 7 | 0 | 537439 | 3664.21 | 689 | 666 | 146.5 |
| B | 1 | 255 | 91062 | 617.08 | 689 | 666 | 146.5 |
| C | 15 | 196 | 1634698 | 9440.88 | 631 | 626 | 173.1 |
| C | 15 | 214 | 761157 | 4393.98 | 631 | 626 | 173.1 |
| C | 15 | 178 | 568155 | 3278.91 | 631 | 626 | 173.1 |
| D | 8 | 246 | 1980439 | 11011.09 | 644 | 621 | 179.8 |
| D | 6 | 42 | 586462 | 3258.25 | 644 | 621 | 179.8 |
| D | 11 | 161 | 332067 | 1843.39 | 644 | 621 | 179.8 |
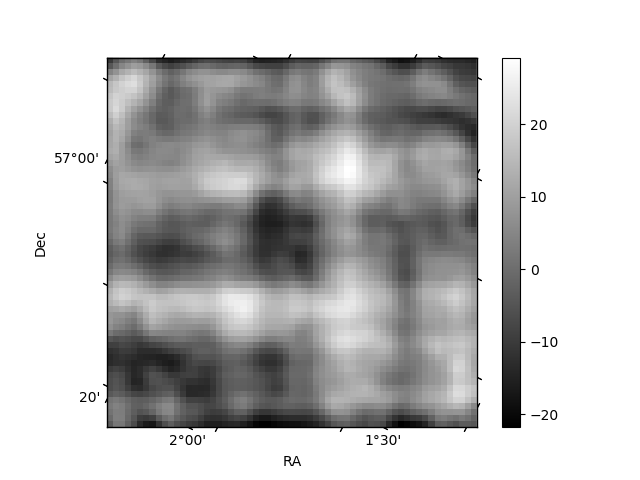
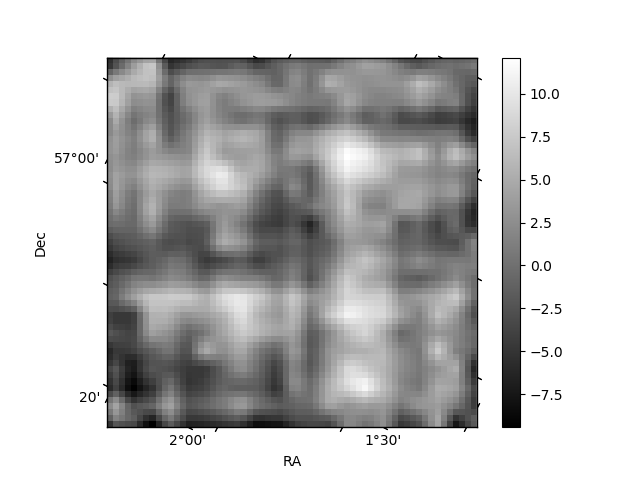
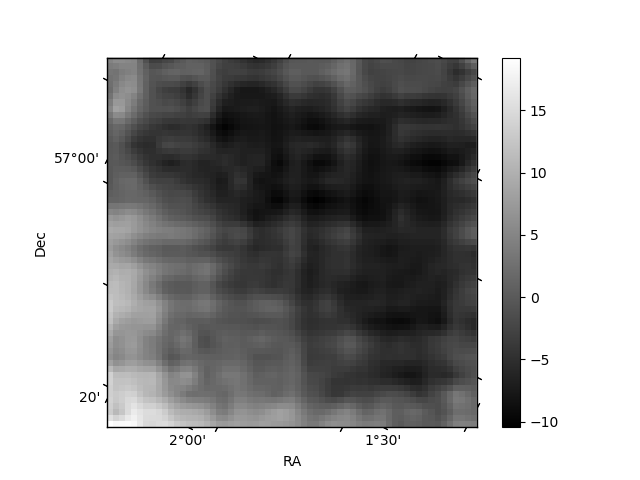
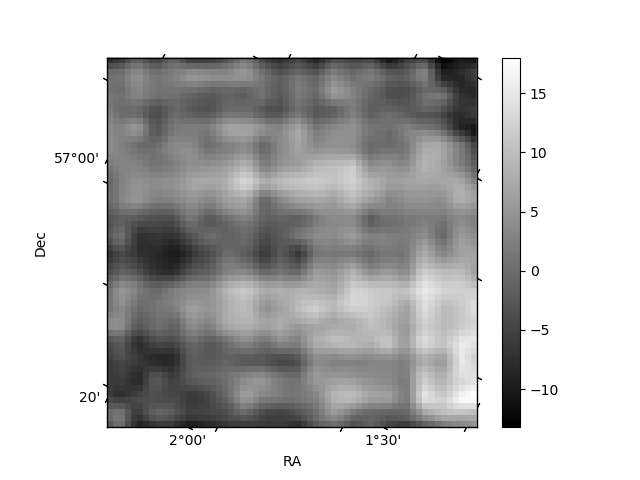
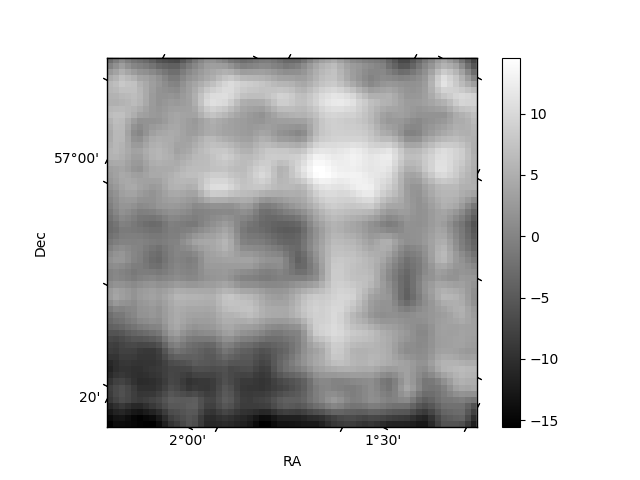
Histogram calculated using DETX and DETY for each event in the final _common_clean file
| Quadrant A | 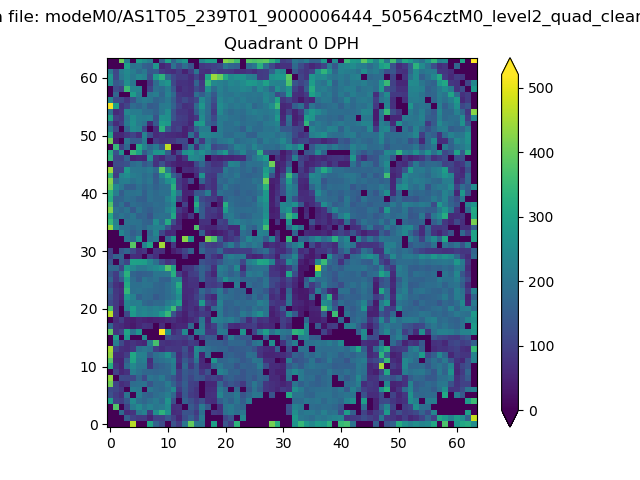 |
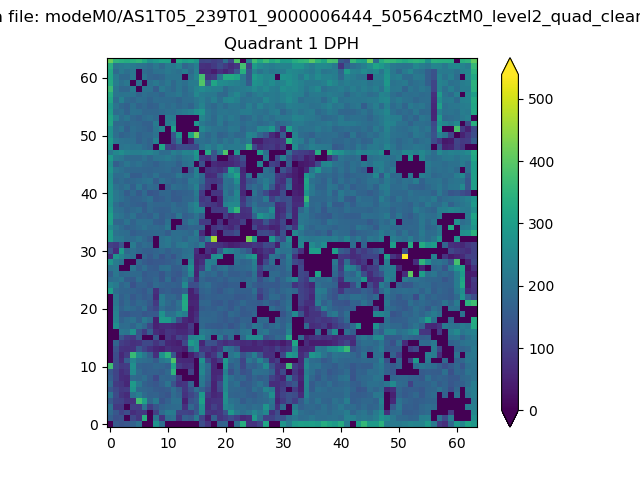 |
Quadrant B |
|---|---|---|---|
| Quadrant D | 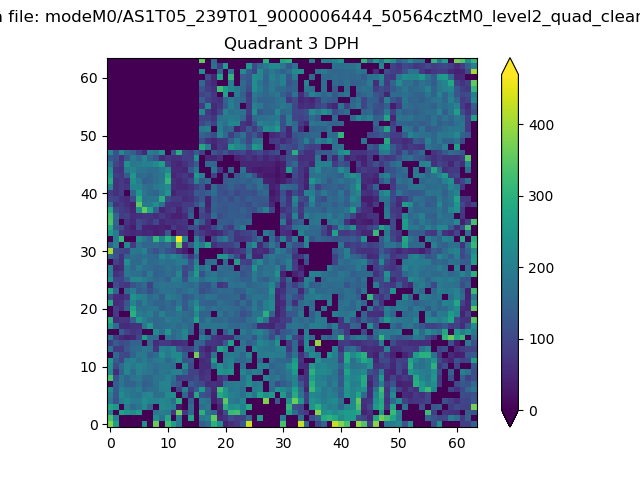 |
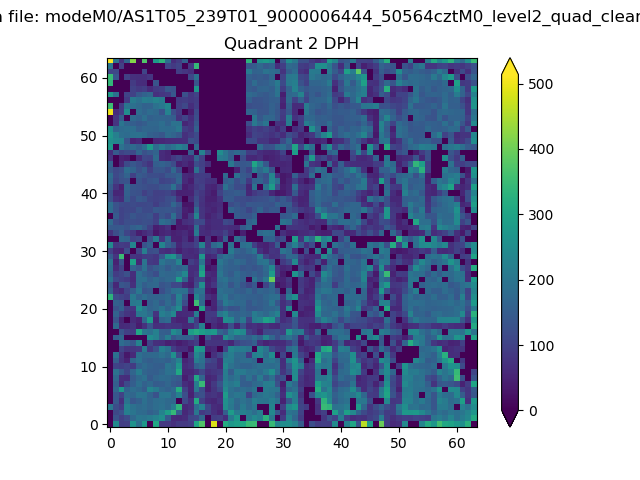 |
Quadrant C |
| Plot type | Count rate plots | Images |
|---|---|---|
| Comparison with Poisson distribution Blue bars denote a histogram of data divided into 1 sec bins. Red curve is a Poisson curve with rate = median count rate of data. |
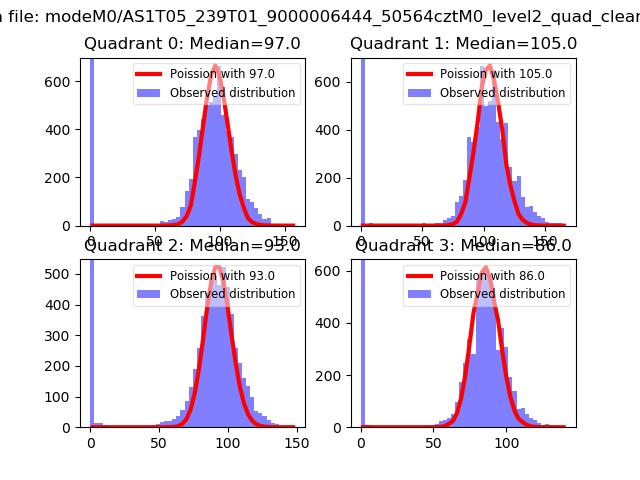 |
 |
| Quadrant-wise count rates Data is divided into 100 sec bins |
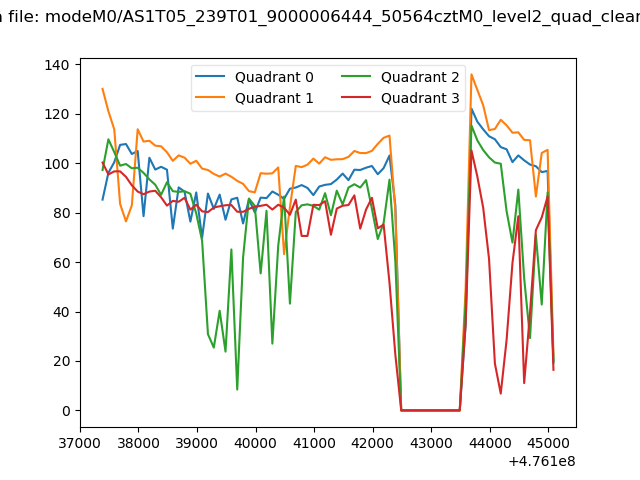 |
|
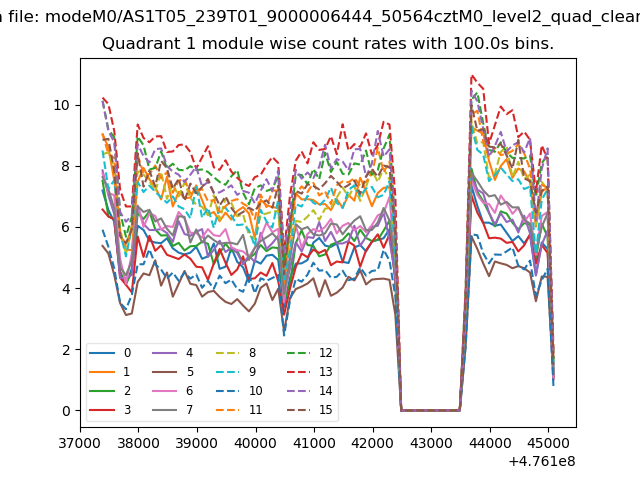
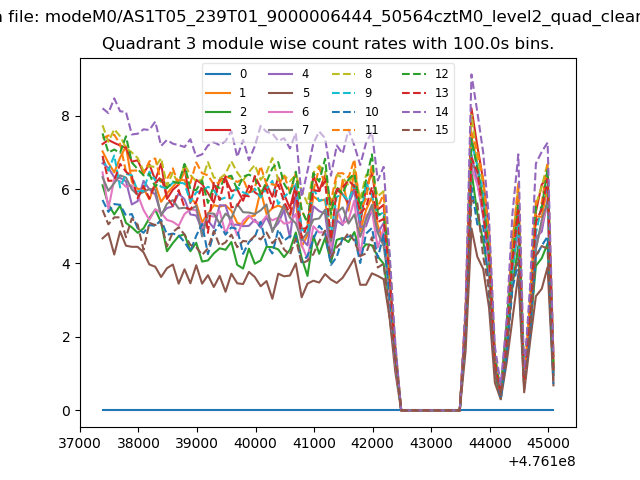
| Module-wise count rates for Quadrant A Data is divided into 100 sec bins |
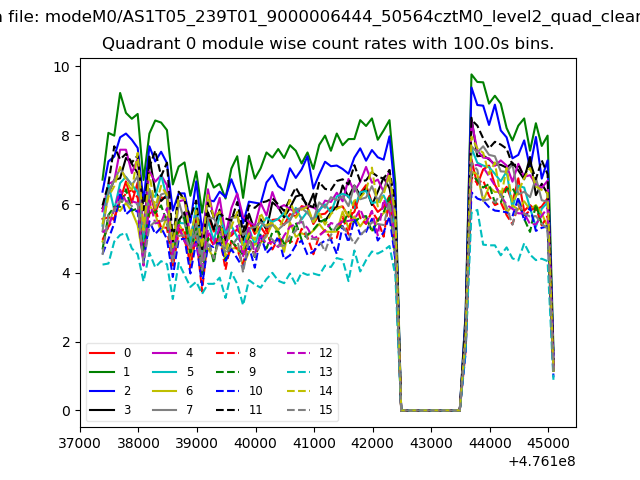 |
 |
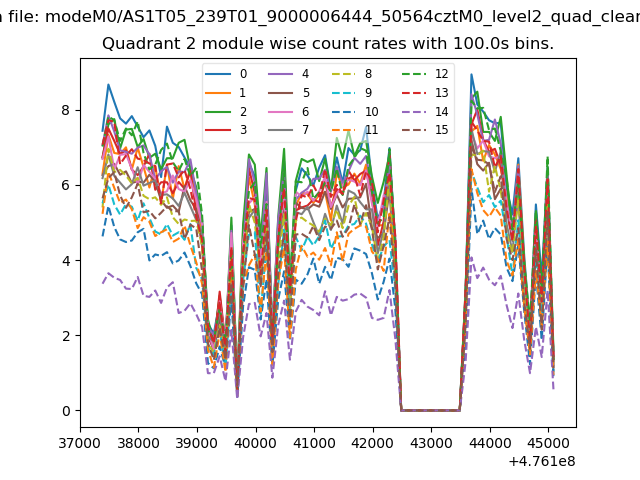
| Module-wise count rates for Quadrant B Data is divided into 100 sec bins |
 |
 |
| Module-wise count rates for Quadrant C Data is divided into 100 sec bins |
 |
 |
| Module-wise count rates for Quadrant D Data is divided into 100 sec bins |
 |
 |
| Parameter | Plot |
|---|---|
| CZT HV Monitor | 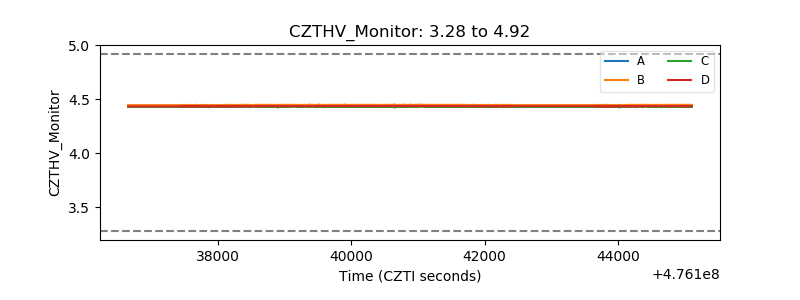 |
| D_VDD | 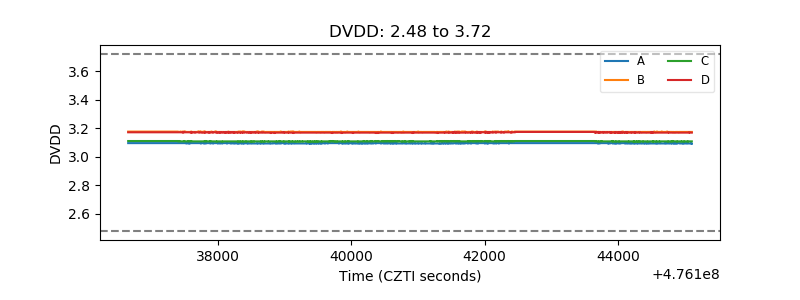 |
| Temperature 1 | 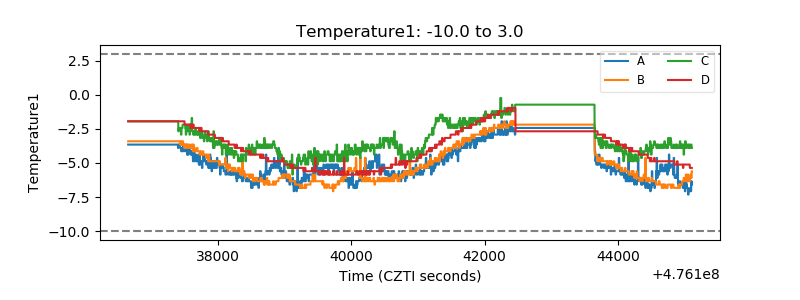 |
| Veto HV Monitor | 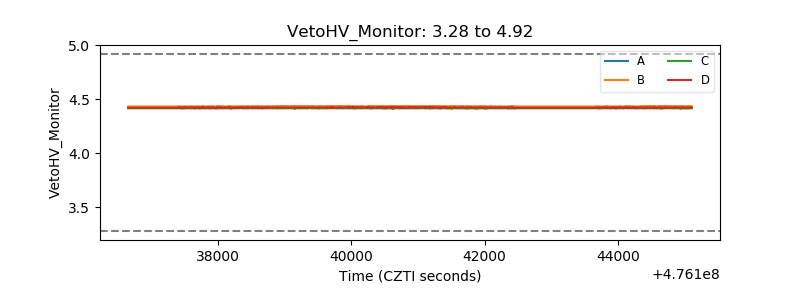 |
| Veto LLD | 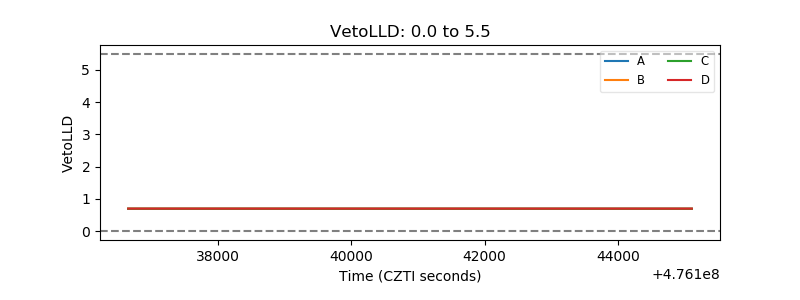 |
| Alpha Counter | 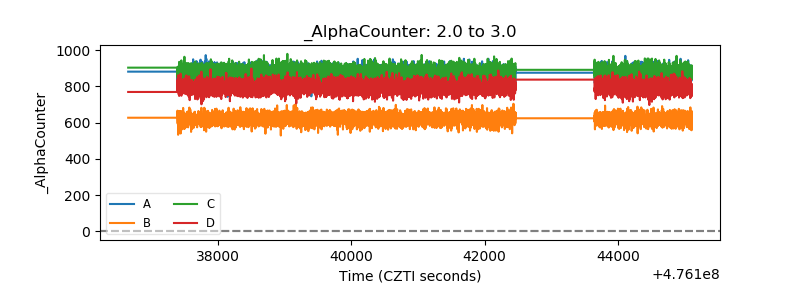 |
| _CPM_Rate | 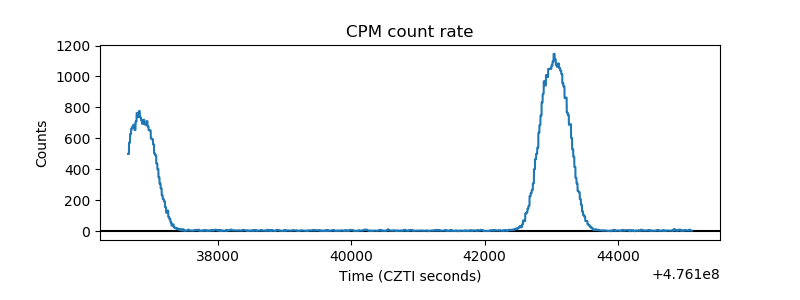 |
| CZT Counter | 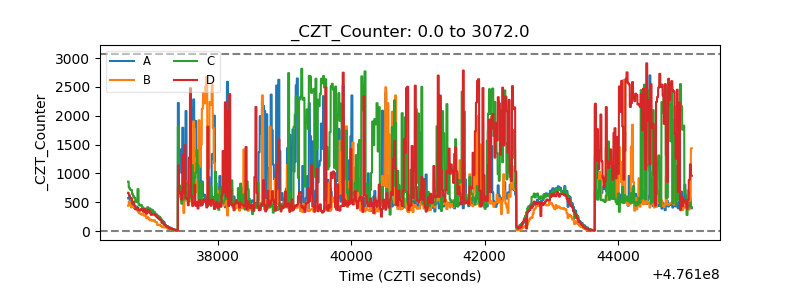 |
| +2.5 Volts monitor | 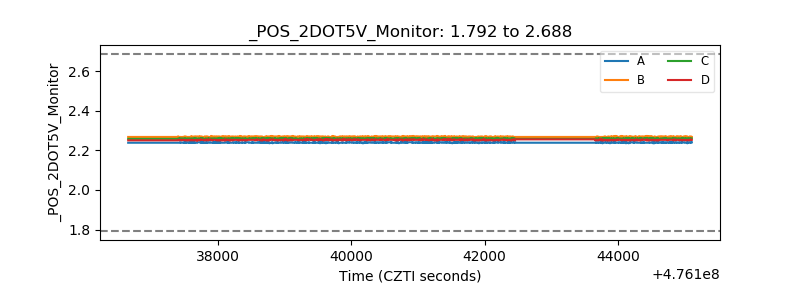 |
| +5 Volts monitor | 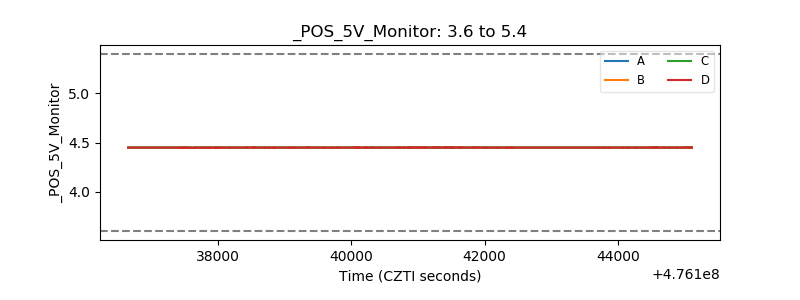 |
| _ROLL_ROT | 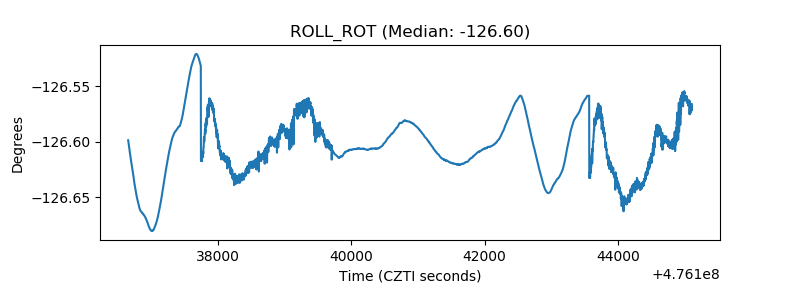 |
| _Roll_DEC | 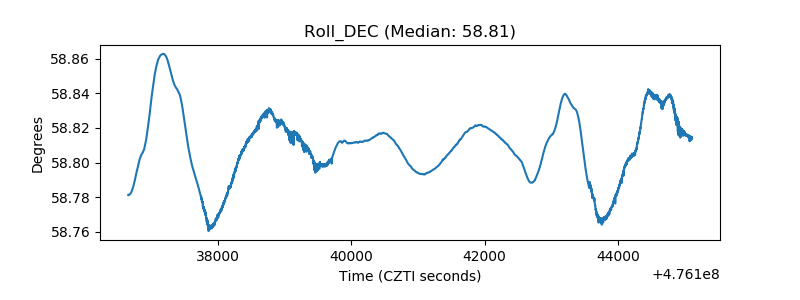 |
| _Roll_RA | 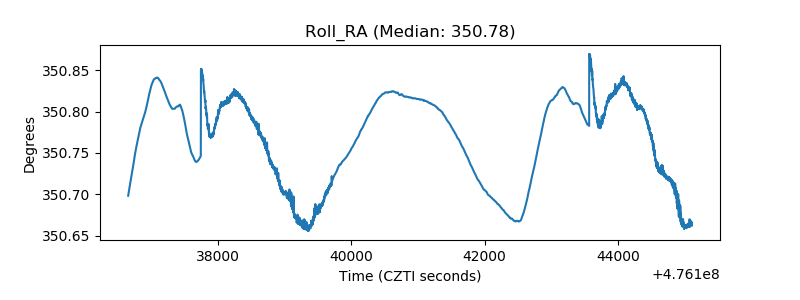 |
| Veto Counter | 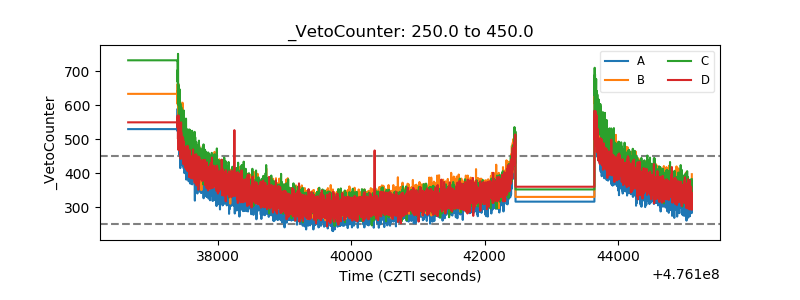 |