| Param | Original file | Final file |
|---|---|---|
| Filename | modeM0/AS1T05_239T01_9000006444_50566cztM0_level2.fits | modeM0/AS1T05_239T01_9000006444_50566cztM0_level2_quad_clean.evt |
| Size (bytes) | 552,464,640 | 93,922,560 |
| Size | 526.9 MB | 89.6 MB |
| Events in quadrant A | 3,688,858 | 639,688 |
| Events in quadrant B | 4,504,307 | 690,736 |
| Events in quadrant C | 7,924,255 | 476,313 |
| Events in quadrant D | 3,823,439 | 580,510 |
| Mode M0 | |||
|---|---|---|---|
| Quadrant | BADHDUFLAG | Total packets | Discarded packets |
| A | 0 | 15354 | 3 |
| B | 0 | 17946 | 2 |
| C | 0 | 28011 | 2 |
| D | 0 | 16169 | 2 |
| Mode M9 | |||
|---|---|---|---|
| Quadrant | BADHDUFLAG | Total packets | Discarded packets |
| A | 0 | 19 | 0 |
| B | 0 | 19 | 0 |
| C | 0 | 20 | 0 |
| D | 0 | 20 | 0 |
| Mode SS | |||
|---|---|---|---|
| Quadrant | BADHDUFLAG | Total packets | Discarded packets |
| A | 0 | 132 | 0 |
| B | 0 | 132 | 0 |
| C | 0 | 132 | 0 |
| D | 0 | 132 | 0 |
| Quadrant | Total seconds | Saturated seconds | Saturation percentage |
|---|---|---|---|
| A | 6560 | 153 | 2.332317% |
| B | 6560 | 354 | 5.396341% |
| C | 6560 | 1869 | 28.490854% |
| D | 6560 | 183 | 2.789634% |
Noise dominated data is calculated using 1-second bins in cleaned event files. If a bin has >2000 counts, and if more than 50% of those come from <1% of pixels, then it is considered to be noise-dominated and hence unusable.
| Quadrant | # 1 sec bins | Bins with >0 counts | Bins with >2000 counts | High rate bins dominated by noise | Noise dominated (total time) | Noise dominated (detector-on time) | Marked lightcurve |
|---|---|---|---|---|---|---|---|
| A | 7755 | 6560 | 78 | 78 | 1.01% | 1.19% | 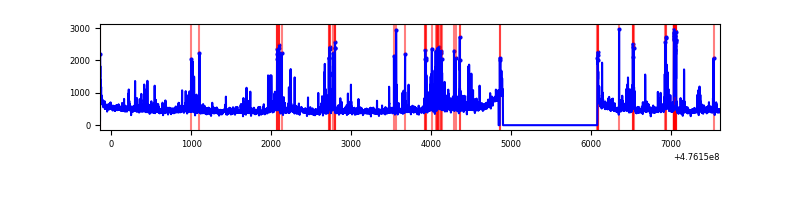 |
| B | 7755 | 6560 | 220 | 220 | 2.84% | 3.35% | 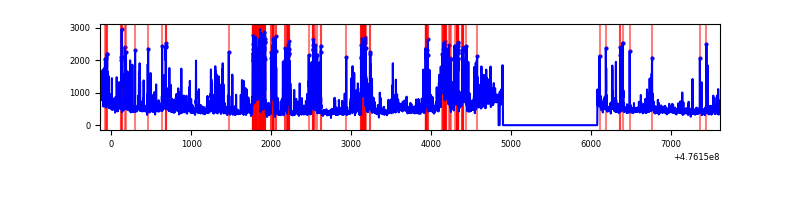 |
| C | 7755 | 6561 | 1680 | 1680 | 21.66% | 25.61% | 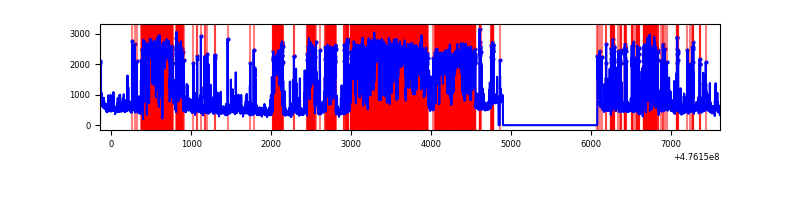 |
| D | 7755 | 6561 | 117 | 117 | 1.51% | 1.78% | 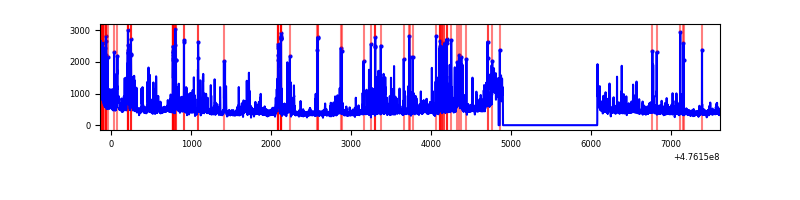 |
Top three noisy pixels from each quadrant. If the there are fewer than three noisy pixels in the level2.evt file, extra rows are filled as -1
| Pixel properties | Quadrant properties | ||||||
|---|---|---|---|---|---|---|---|
| Quadrant | DetID | PixID | Counts | Sigma | Mean | Median | Sigma |
| A | 4 | 3 | 133968 | 763.87 | 709 | 691 | 174.5 |
| A | 3 | 130 | 116348 | 662.88 | 709 | 691 | 174.5 |
| A | 5 | 240 | 96029 | 546.42 | 709 | 691 | 174.5 |
| B | 7 | 0 | 819907 | 5520.55 | 705 | 680 | 148.4 |
| B | 0 | 229 | 251138 | 1687.77 | 705 | 680 | 148.4 |
| B | 0 | 172 | 211565 | 1421.1 | 705 | 680 | 148.4 |
| C | 15 | 196 | 2165875 | 12587.87 | 615 | 610 | 172.0 |
| C | 15 | 195 | 1756850 | 10209.98 | 615 | 610 | 172.0 |
| C | 15 | 178 | 357475 | 2074.65 | 615 | 610 | 172.0 |
| D | 2 | 249 | 256278 | 1343.61 | 683 | 659 | 190.2 |
| D | 6 | 42 | 182197 | 954.22 | 683 | 659 | 190.2 |
| D | 11 | 161 | 129204 | 675.67 | 683 | 659 | 190.2 |
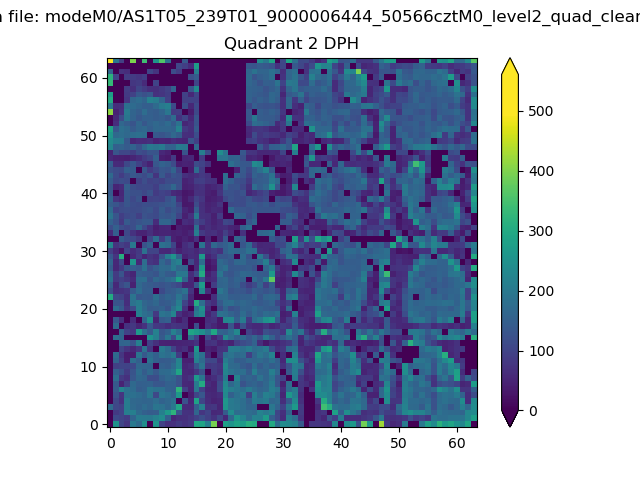
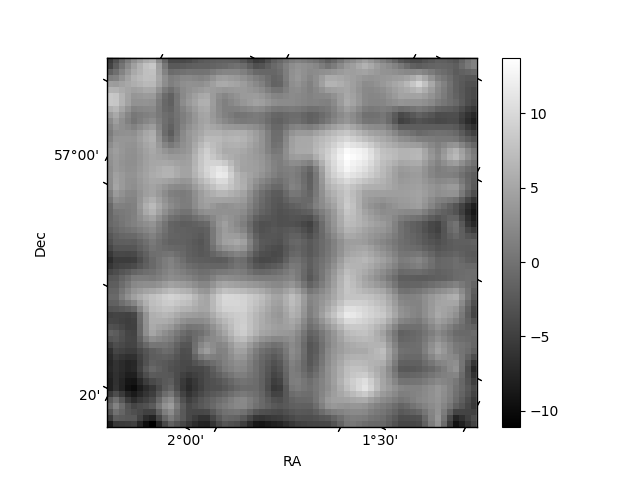
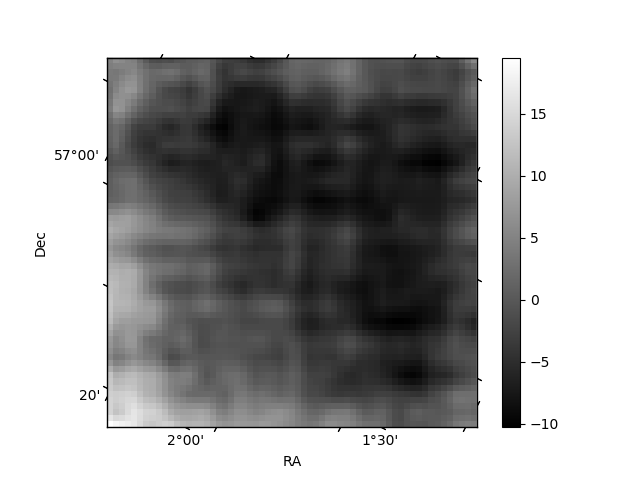
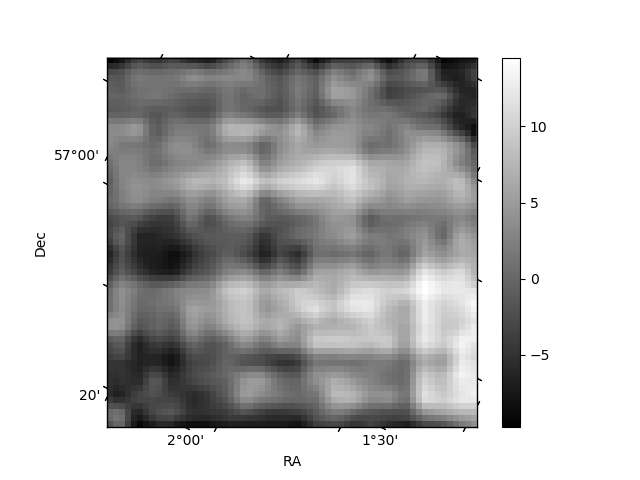
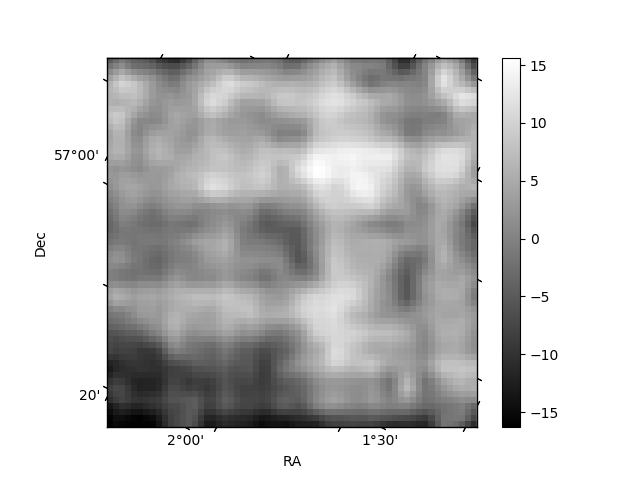
Histogram calculated using DETX and DETY for each event in the final _common_clean file
| Quadrant A | 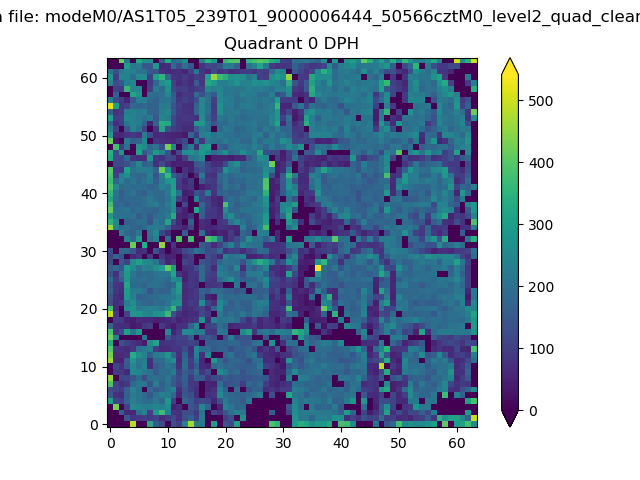 |
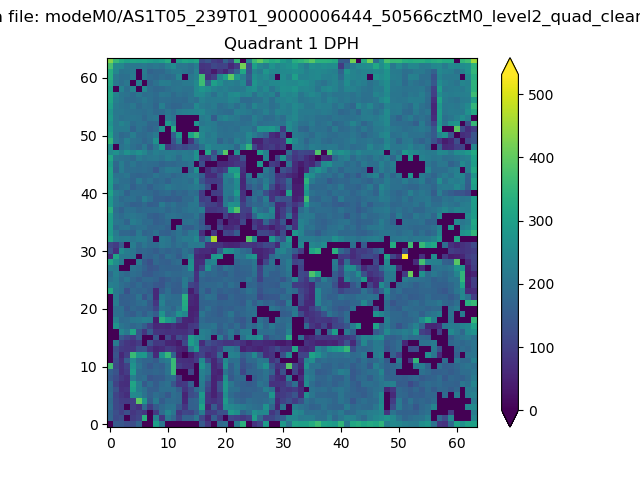 |
Quadrant B |
|---|---|---|---|
| Quadrant D | 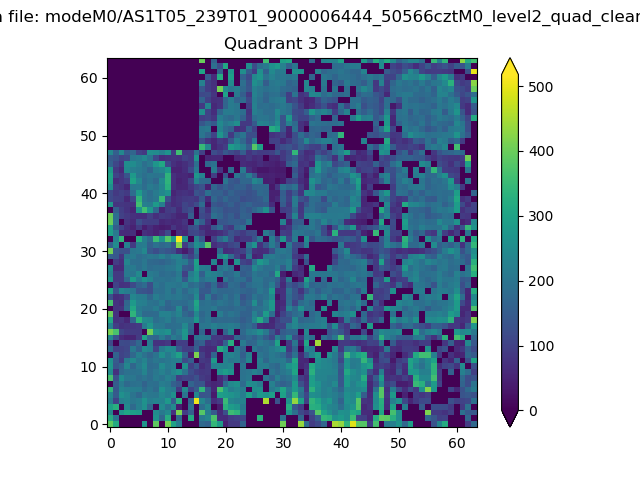 |
 |
Quadrant C |
| Plot type | Count rate plots | Images |
|---|---|---|
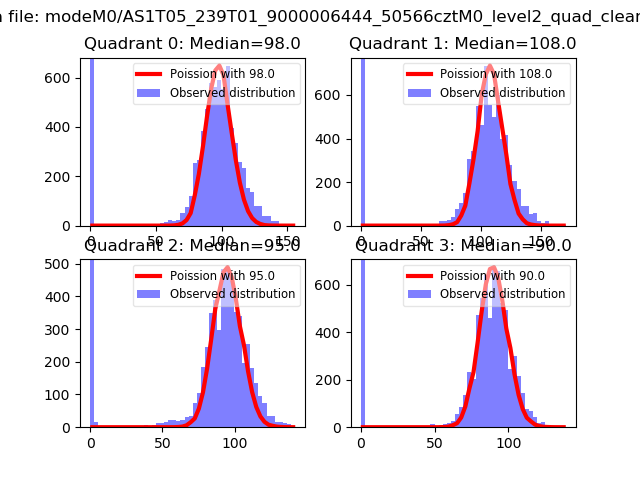
| Comparison with Poisson distribution Blue bars denote a histogram of data divided into 1 sec bins. Red curve is a Poisson curve with rate = median count rate of data. |
 |
 |
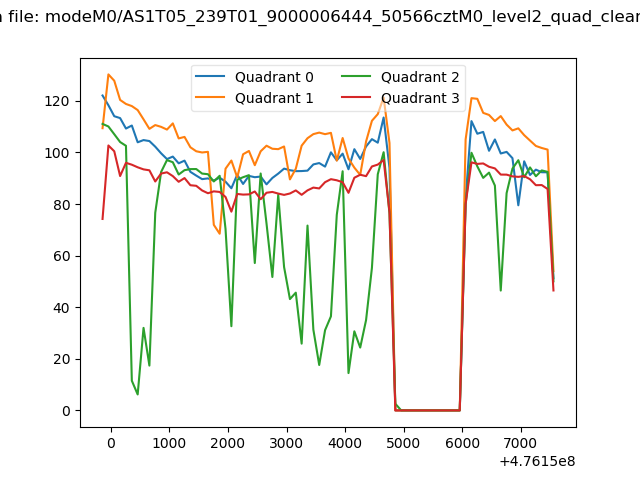
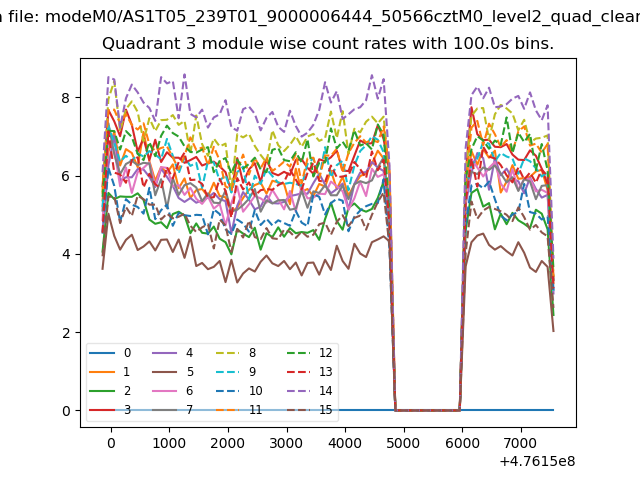
| Quadrant-wise count rates Data is divided into 100 sec bins |
 |
|
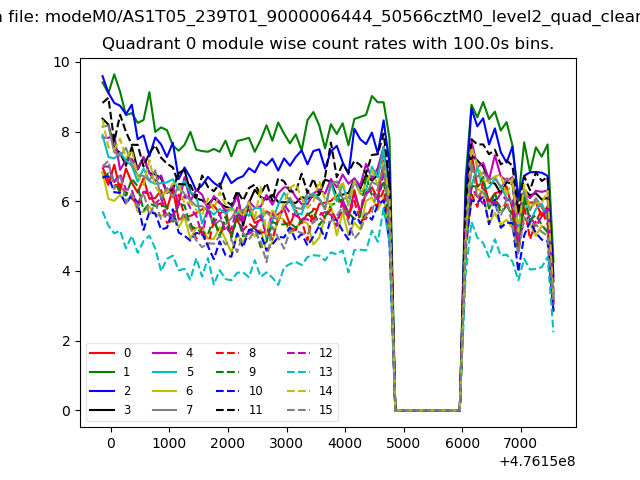
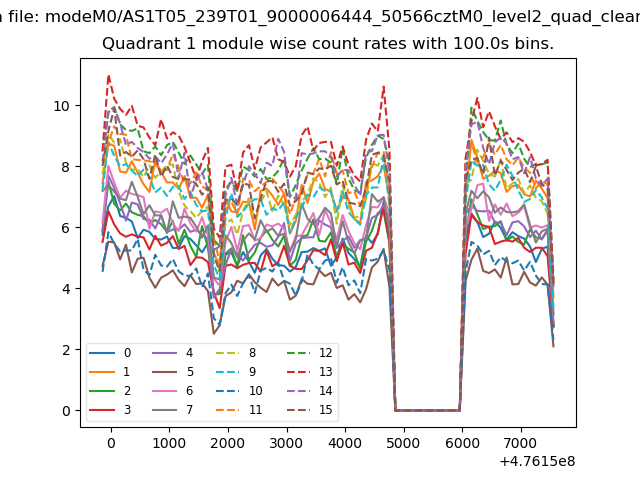
| Module-wise count rates for Quadrant A Data is divided into 100 sec bins |
 |
 |
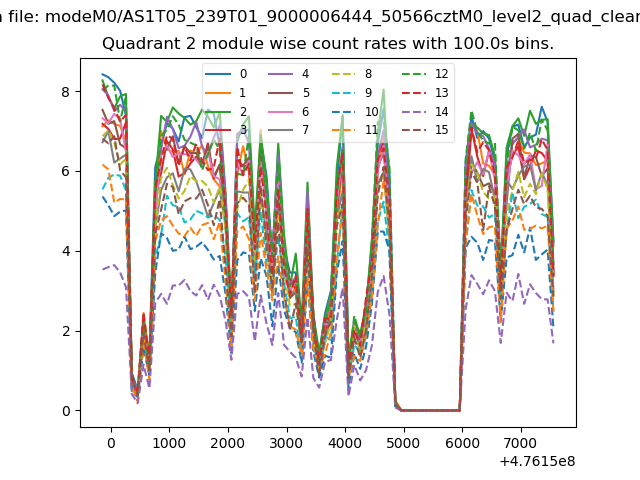
| Module-wise count rates for Quadrant B Data is divided into 100 sec bins |
 |
 |
| Module-wise count rates for Quadrant C Data is divided into 100 sec bins |
 |
 |
| Module-wise count rates for Quadrant D Data is divided into 100 sec bins |
 |
 |
| Parameter | Plot |
|---|---|
| CZT HV Monitor | 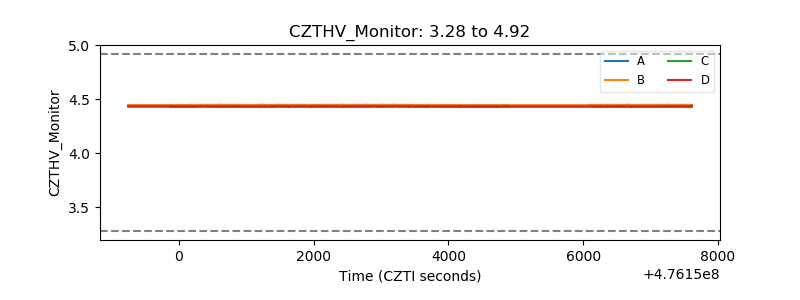 |
| D_VDD | 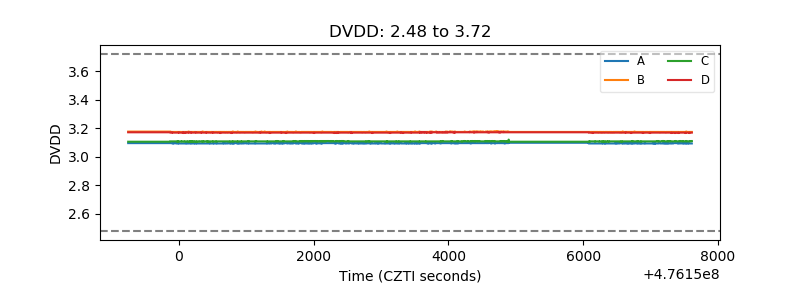 |
| Temperature 1 | 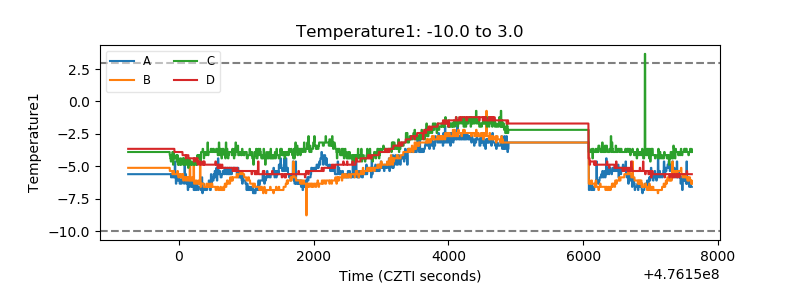 |
| Veto HV Monitor | 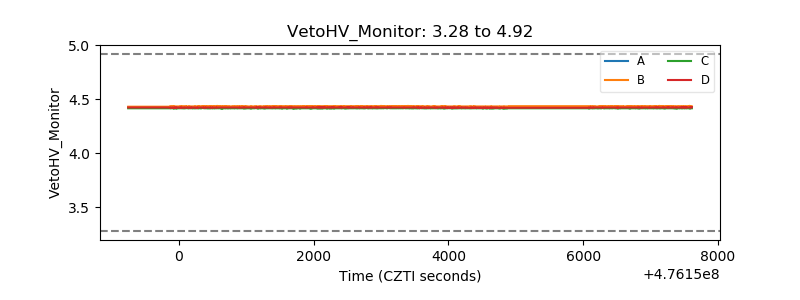 |
| Veto LLD | 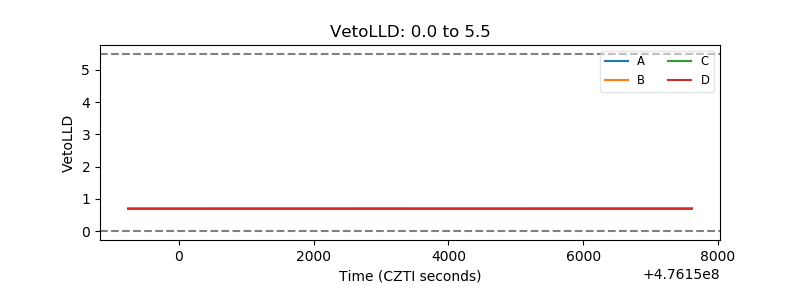 |
| Alpha Counter | 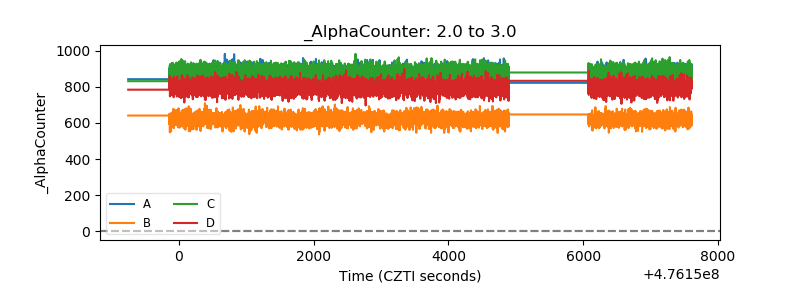 |
| _CPM_Rate | 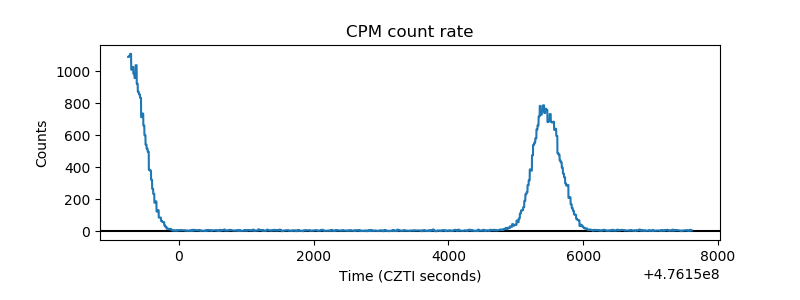 |
| CZT Counter | 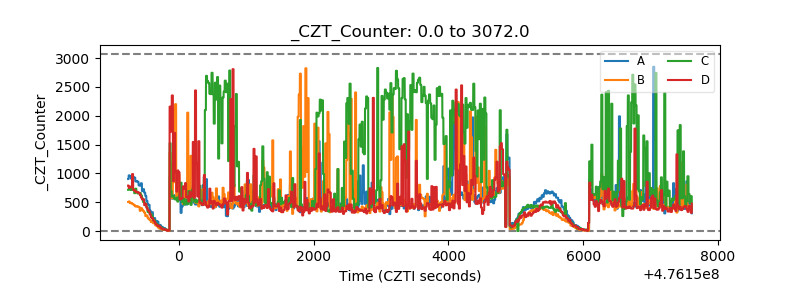 |
| +2.5 Volts monitor | 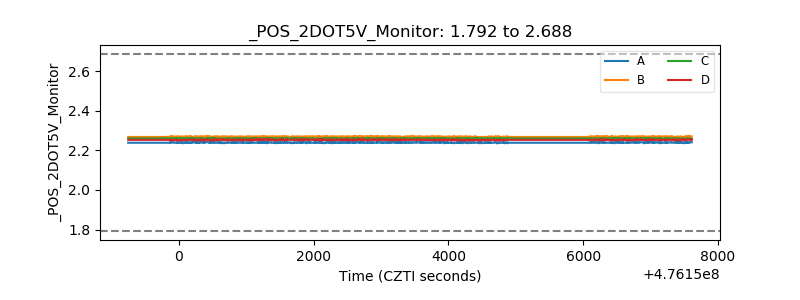 |
| +5 Volts monitor |  |
| _ROLL_ROT | 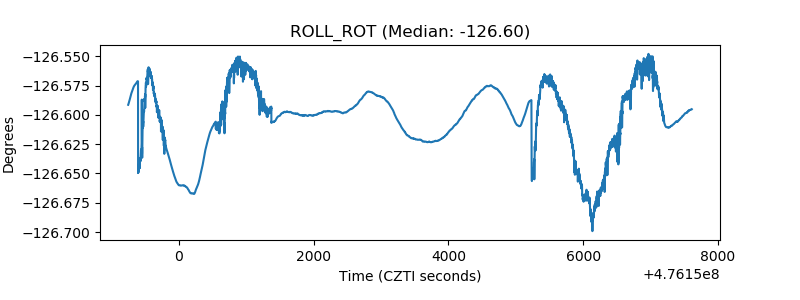 |
| _Roll_DEC | 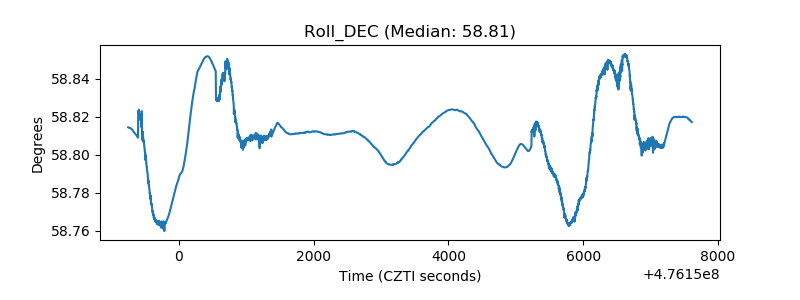 |
| _Roll_RA | 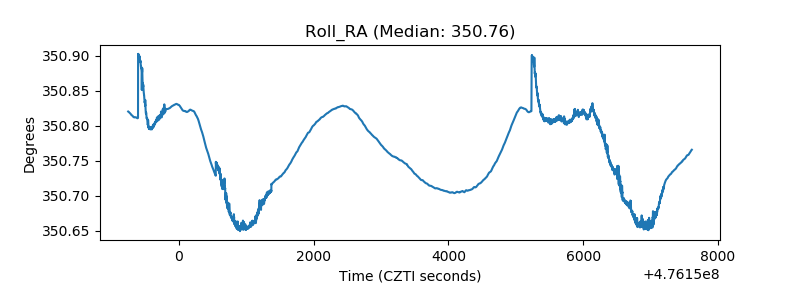 |
| Veto Counter | 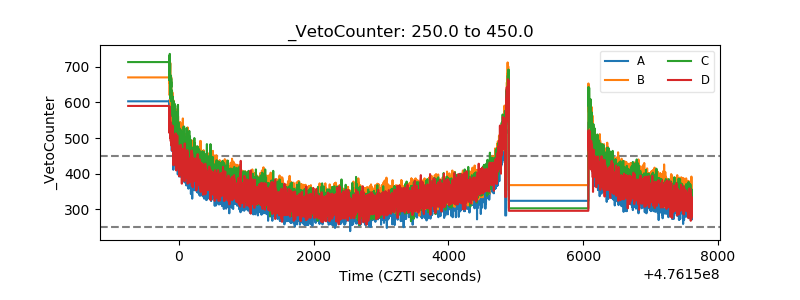 |