| Param | Original file | Final file |
|---|---|---|
| Filename | modeM0/AS1T05_239T01_9000006444_50567cztM0_level2.fits | modeM0/AS1T05_239T01_9000006444_50567cztM0_level2_quad_clean.evt |
| Size (bytes) | 498,706,560 | 97,398,720 |
| Size | 475.6 MB | 92.9 MB |
| Events in quadrant A | 4,266,319 | 628,729 |
| Events in quadrant B | 3,745,927 | 693,211 |
| Events in quadrant C | 5,460,939 | 595,161 |
| Events in quadrant D | 4,468,398 | 566,294 |
| Mode M0 | |||
|---|---|---|---|
| Quadrant | BADHDUFLAG | Total packets | Discarded packets |
| A | 0 | 17174 | 2 |
| B | 0 | 15939 | 2 |
| C | 0 | 20813 | 2 |
| D | 0 | 18140 | 2 |
| Mode M9 | |||
|---|---|---|---|
| Quadrant | BADHDUFLAG | Total packets | Discarded packets |
| A | 0 | 23 | 0 |
| B | 0 | 23 | 0 |
| C | 0 | 23 | 0 |
| D | 0 | 23 | 0 |
| Mode SS | |||
|---|---|---|---|
| Quadrant | BADHDUFLAG | Total packets | Discarded packets |
| A | 0 | 136 | 0 |
| B | 0 | 136 | 0 |
| C | 0 | 136 | 0 |
| D | 0 | 136 | 0 |
| Quadrant | Total seconds | Saturated seconds | Saturation percentage |
|---|---|---|---|
| A | 6681 | 234 | 3.502470% |
| B | 6681 | 185 | 2.769047% |
| C | 6682 | 492 | 7.363065% |
| D | 6682 | 304 | 4.549536% |
Noise dominated data is calculated using 1-second bins in cleaned event files. If a bin has >2000 counts, and if more than 50% of those come from <1% of pixels, then it is considered to be noise-dominated and hence unusable.
| Quadrant | # 1 sec bins | Bins with >0 counts | Bins with >2000 counts | High rate bins dominated by noise | Noise dominated (total time) | Noise dominated (detector-on time) | Marked lightcurve |
|---|---|---|---|---|---|---|---|
| A | 8966 | 6681 | 142 | 142 | 1.58% | 2.13% | 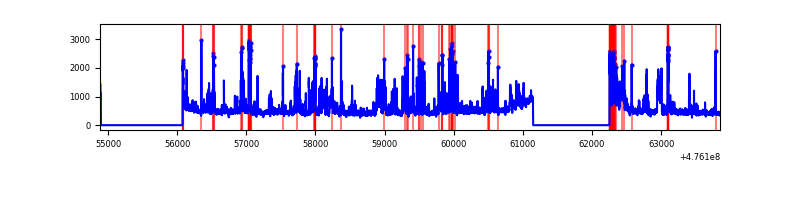 |
| B | 8966 | 6681 | 59 | 59 | 0.66% | 0.88% | 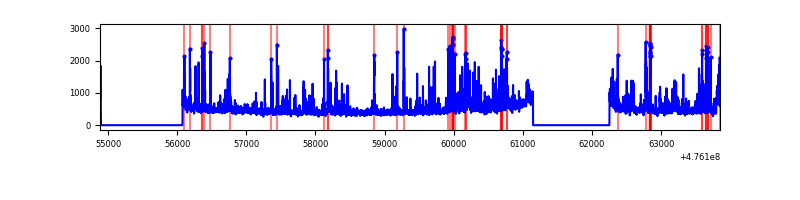 |
| C | 8967 | 6682 | 381 | 381 | 4.25% | 5.70% | 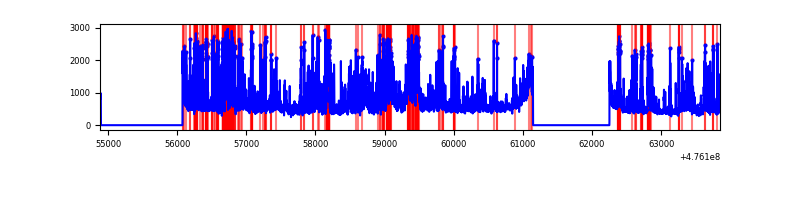 |
| D | 8967 | 6683 | 253 | 253 | 2.82% | 3.79% | 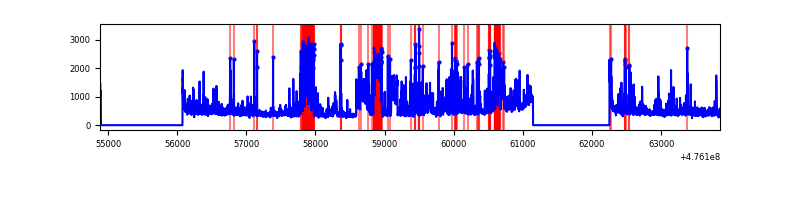 |
Top three noisy pixels from each quadrant. If the there are fewer than three noisy pixels in the level2.evt file, extra rows are filled as -1
| Pixel properties | Quadrant properties | ||||||
|---|---|---|---|---|---|---|---|
| Quadrant | DetID | PixID | Counts | Sigma | Mean | Median | Sigma |
| A | 12 | 250 | 331611 | 1868.06 | 711 | 691 | 177.1 |
| A | 3 | 63 | 316107 | 1780.54 | 711 | 691 | 177.1 |
| A | 4 | 3 | 165897 | 932.59 | 711 | 691 | 177.1 |
| B | 7 | 0 | 266691 | 1757.03 | 716 | 693 | 151.4 |
| B | 5 | 185 | 187276 | 1232.46 | 716 | 693 | 151.4 |
| B | 0 | 229 | 138240 | 908.56 | 716 | 693 | 151.4 |
| C | 15 | 195 | 1083123 | 5707.09 | 685 | 679 | 189.7 |
| C | 15 | 196 | 451565 | 2377.25 | 685 | 679 | 189.7 |
| C | 10 | 69 | 269929 | 1419.6 | 685 | 679 | 189.7 |
| D | 8 | 246 | 377747 | 1983.36 | 681 | 656 | 190.1 |
| D | 6 | 42 | 374612 | 1966.87 | 681 | 656 | 190.1 |
| D | 2 | 120 | 257278 | 1349.73 | 681 | 656 | 190.1 |
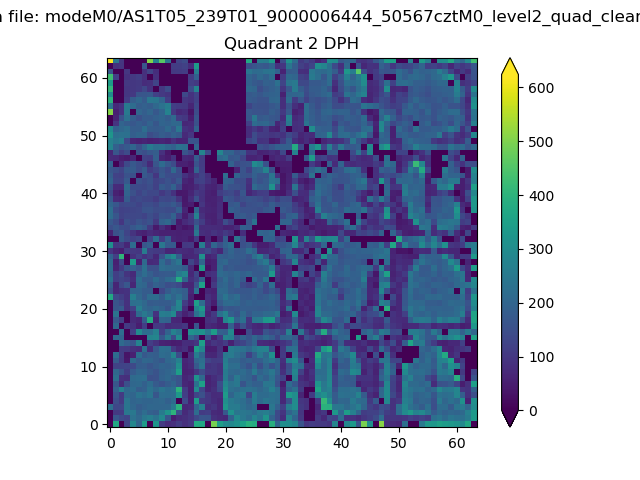
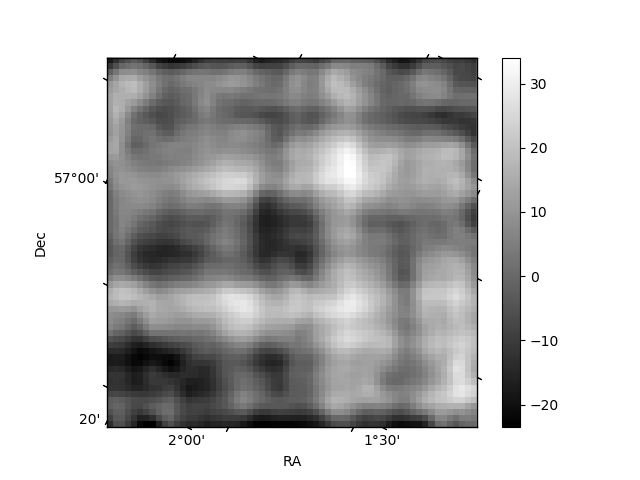
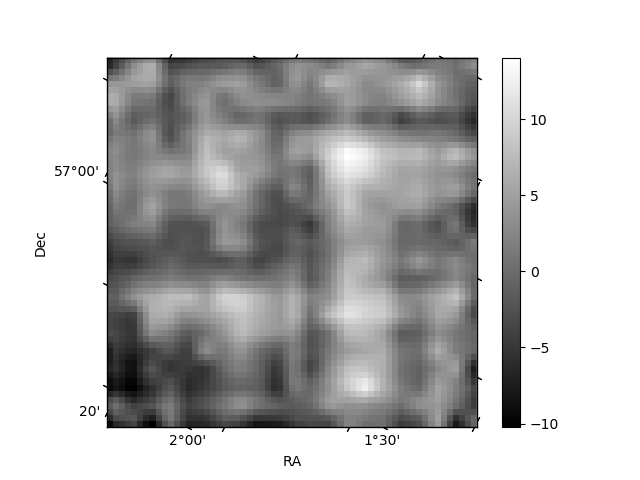
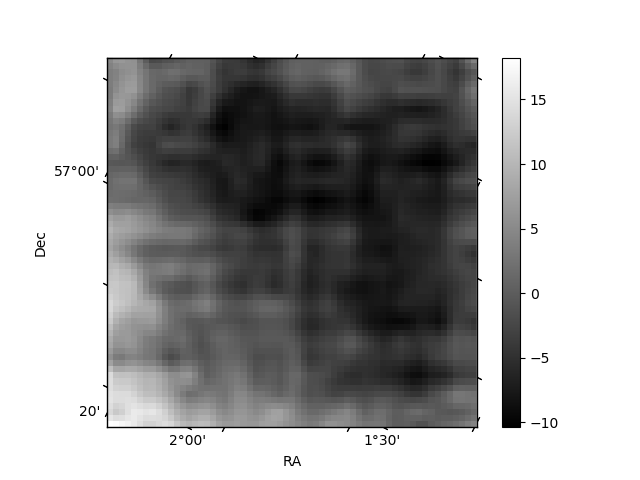
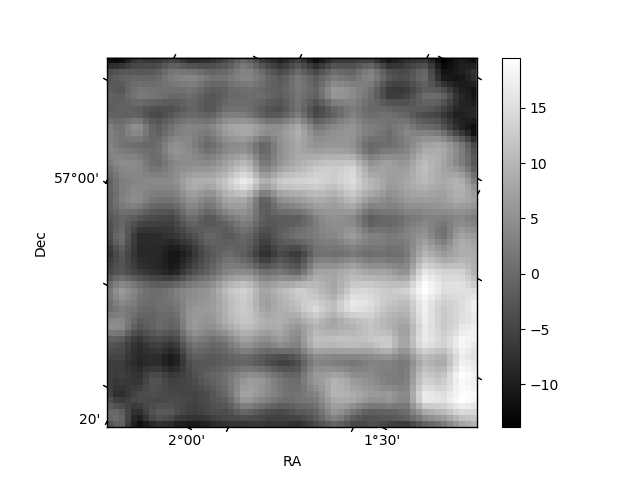
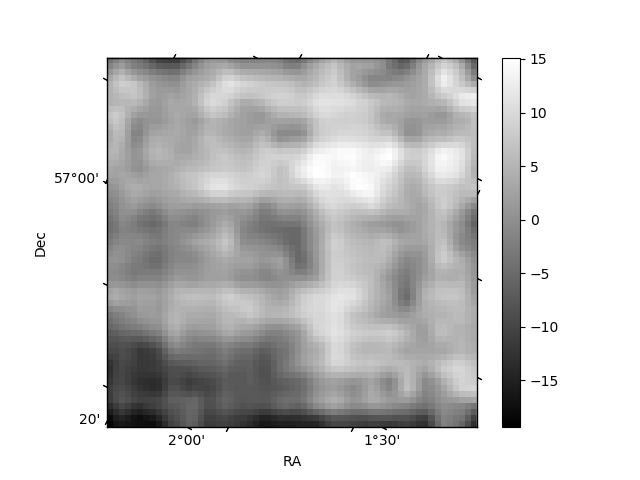
Histogram calculated using DETX and DETY for each event in the final _common_clean file
| Quadrant A | 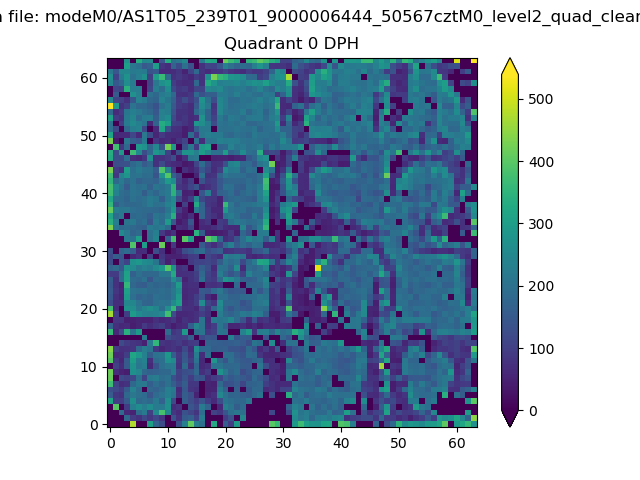 |
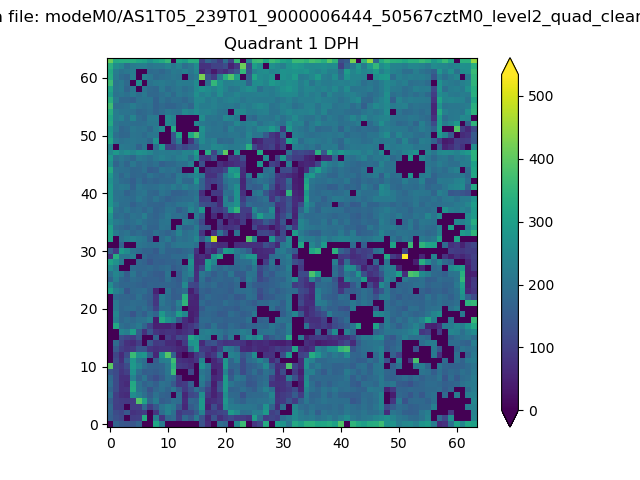 |
Quadrant B |
|---|---|---|---|
| Quadrant D | 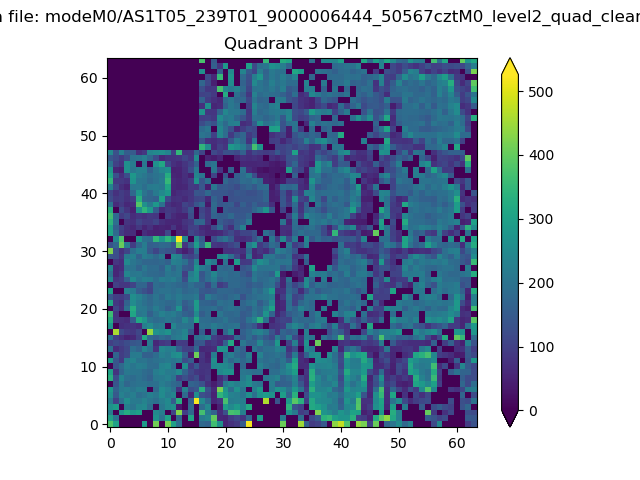 |
 |
Quadrant C |
| Plot type | Count rate plots | Images |
|---|---|---|
| Comparison with Poisson distribution Blue bars denote a histogram of data divided into 1 sec bins. Red curve is a Poisson curve with rate = median count rate of data. |
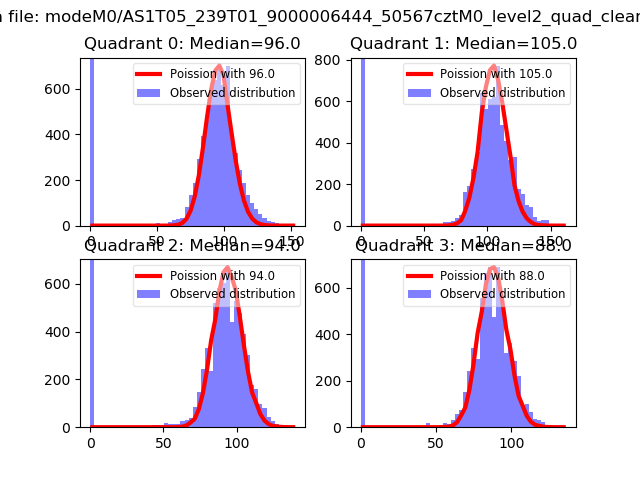 |
 |
| Quadrant-wise count rates Data is divided into 100 sec bins |
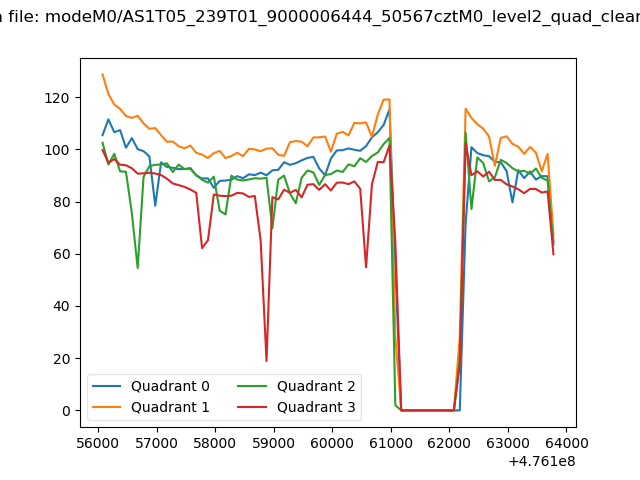 |
|
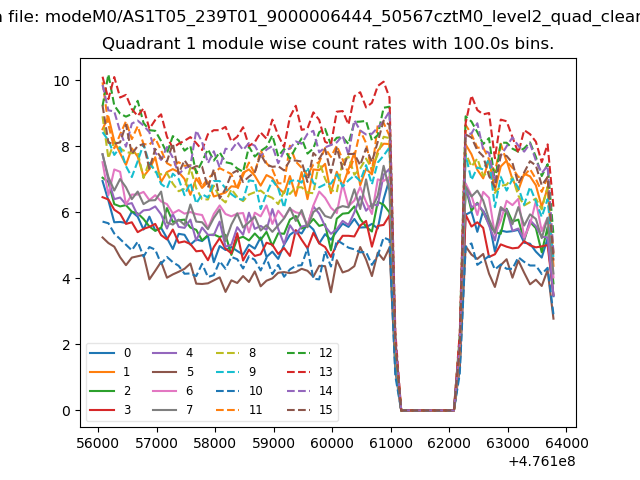
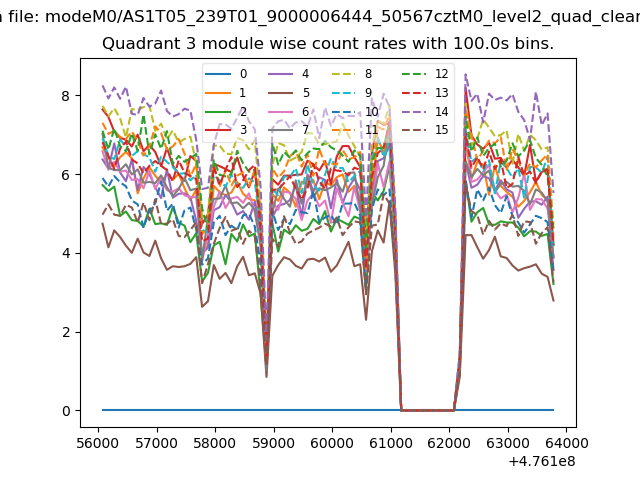
| Module-wise count rates for Quadrant A Data is divided into 100 sec bins |
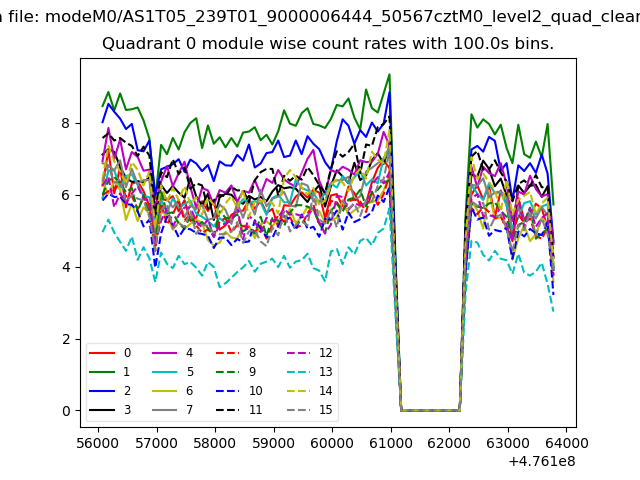 |
 |
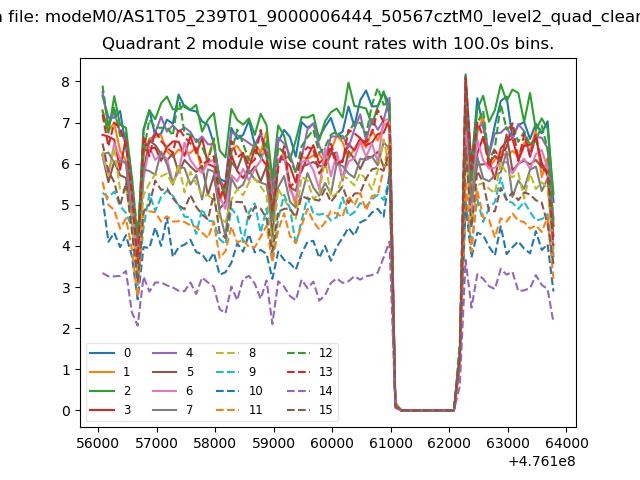
| Module-wise count rates for Quadrant B Data is divided into 100 sec bins |
 |
 |
| Module-wise count rates for Quadrant C Data is divided into 100 sec bins |
 |
 |
| Module-wise count rates for Quadrant D Data is divided into 100 sec bins |
 |
 |
| Parameter | Plot |
|---|---|
| CZT HV Monitor | 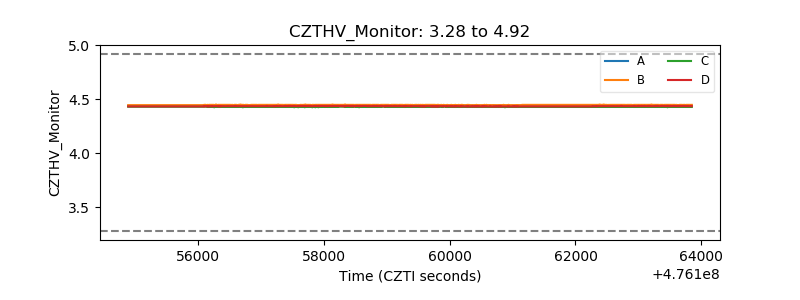 |
| D_VDD | 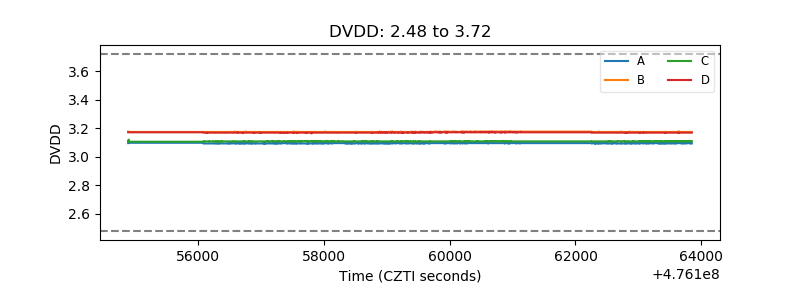 |
| Temperature 1 | 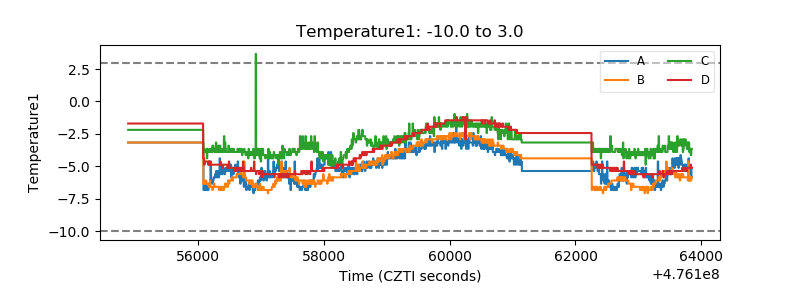 |
| Veto HV Monitor | 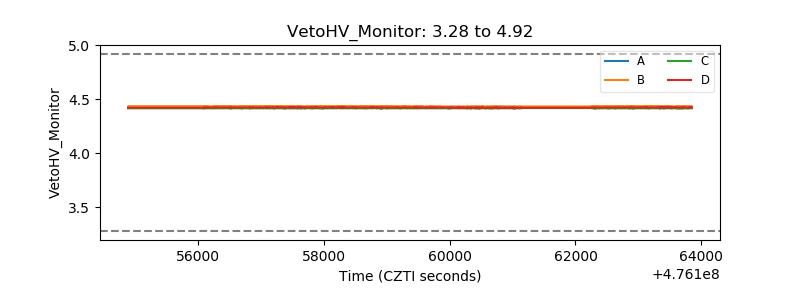 |
| Veto LLD | 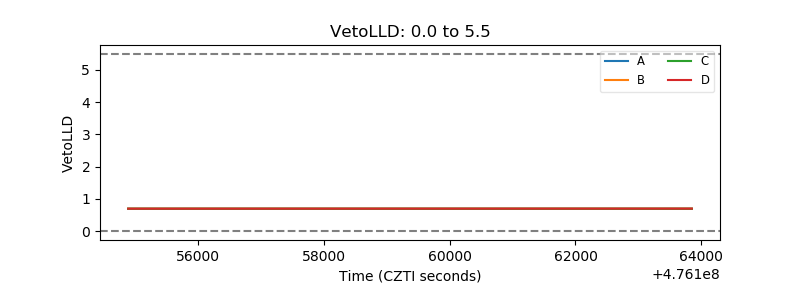 |
| Alpha Counter | 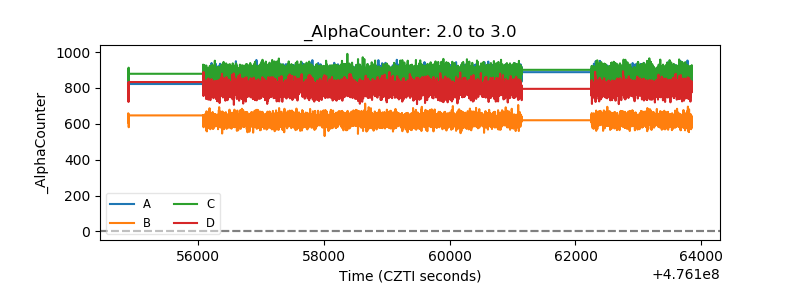 |
| _CPM_Rate | 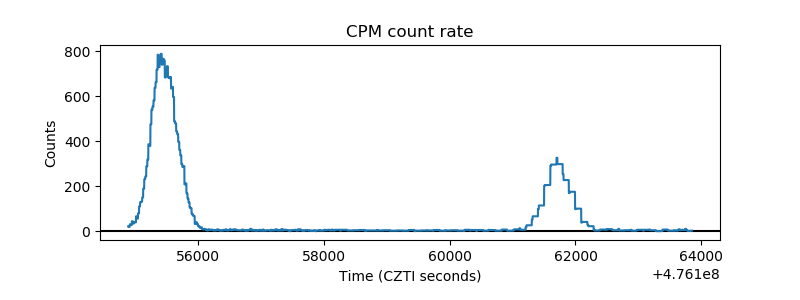 |
| CZT Counter | 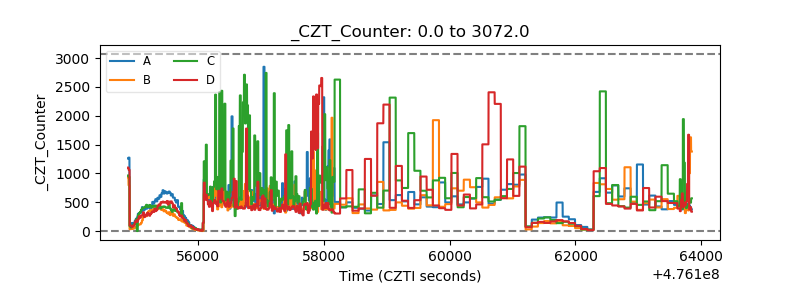 |
| +2.5 Volts monitor | 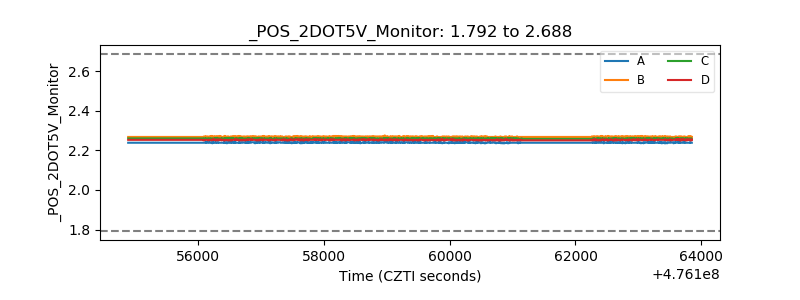 |
| +5 Volts monitor |  |
| _ROLL_ROT | 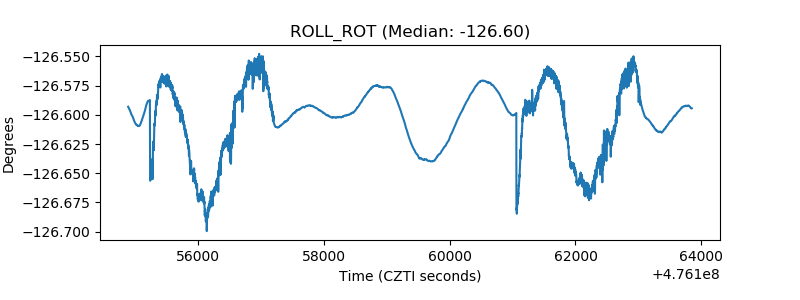 |
| _Roll_DEC | 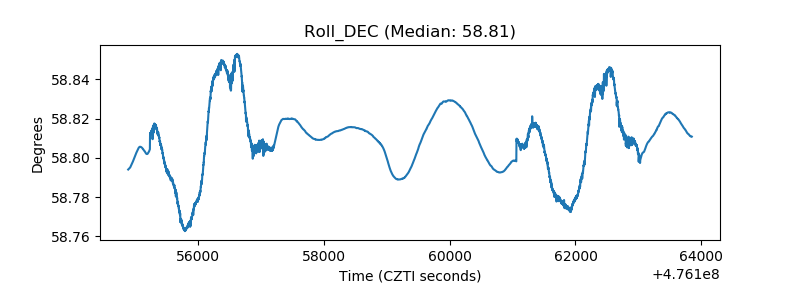 |
| _Roll_RA | 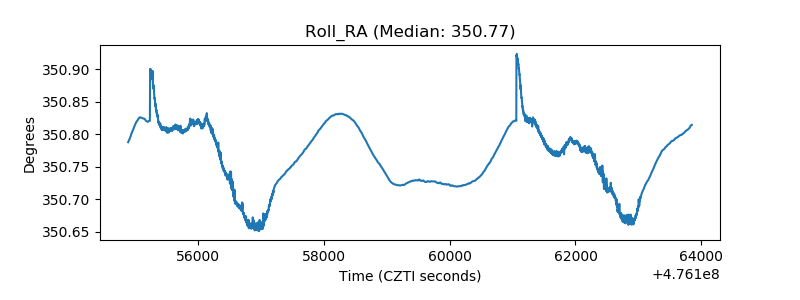 |
| Veto Counter | 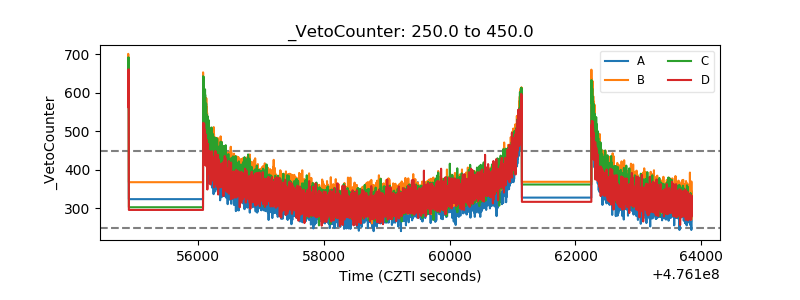 |