| Param | Original file | Final file |
|---|---|---|
| Filename | modeM0/AS1T05_239T01_9000006444_50568cztM0_level2.fits | modeM0/AS1T05_239T01_9000006444_50568cztM0_level2_quad_clean.evt |
| Size (bytes) | 526,150,080 | 82,941,120 |
| Size | 501.8 MB | 79.1 MB |
| Events in quadrant A | 4,534,300 | 548,489 |
| Events in quadrant B | 3,787,200 | 616,007 |
| Events in quadrant C | 6,778,354 | 414,853 |
| Events in quadrant D | 3,906,406 | 509,828 |
| Mode M0 | |||
|---|---|---|---|
| Quadrant | BADHDUFLAG | Total packets | Discarded packets |
| A | 0 | 17540 | 2 |
| B | 0 | 15482 | 1 |
| C | 0 | 24371 | 1 |
| D | 0 | 16022 | 1 |
| Mode M9 | |||
|---|---|---|---|
| Quadrant | BADHDUFLAG | Total packets | Discarded packets |
| A | 0 | 8 | 0 |
| B | 0 | 8 | 0 |
| C | 0 | 8 | 0 |
| D | 0 | 8 | 0 |
| Mode SS | |||
|---|---|---|---|
| Quadrant | BADHDUFLAG | Total packets | Discarded packets |
| A | 0 | 122 | 0 |
| B | 0 | 122 | 0 |
| C | 0 | 122 | 0 |
| D | 0 | 122 | 0 |
| Quadrant | Total seconds | Saturated seconds | Saturation percentage |
|---|---|---|---|
| A | 6049 | 407 | 6.728385% |
| B | 6049 | 217 | 3.587370% |
| C | 6050 | 1647 | 27.223140% |
| D | 6050 | 178 | 2.942149% |
Noise dominated data is calculated using 1-second bins in cleaned event files. If a bin has >2000 counts, and if more than 50% of those come from <1% of pixels, then it is considered to be noise-dominated and hence unusable.
| Quadrant | # 1 sec bins | Bins with >0 counts | Bins with >2000 counts | High rate bins dominated by noise | Noise dominated (total time) | Noise dominated (detector-on time) | Marked lightcurve |
|---|---|---|---|---|---|---|---|
| A | 6884 | 6049 | 279 | 279 | 4.05% | 4.61% | 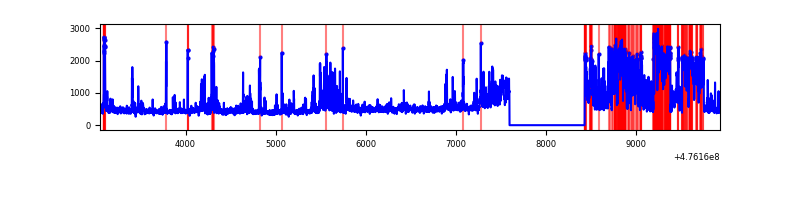 |
| B | 6884 | 6049 | 77 | 77 | 1.12% | 1.27% | 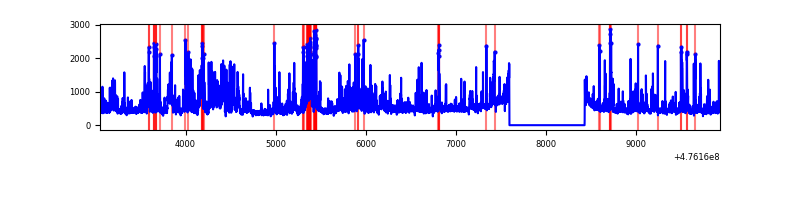 |
| C | 6885 | 6050 | 1470 | 1470 | 21.35% | 24.30% | 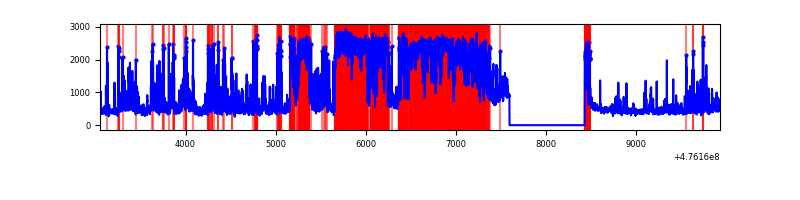 |
| D | 6885 | 6050 | 144 | 144 | 2.09% | 2.38% | 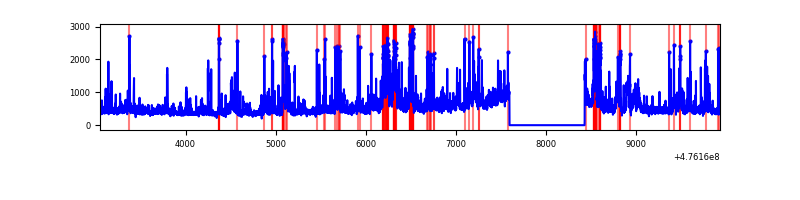 |
Top three noisy pixels from each quadrant. If the there are fewer than three noisy pixels in the level2.evt file, extra rows are filled as -1
| Pixel properties | Quadrant properties | ||||||
|---|---|---|---|---|---|---|---|
| Quadrant | DetID | PixID | Counts | Sigma | Mean | Median | Sigma |
| A | 12 | 80 | 1127627 | 7225.56 | 632 | 617 | 156.0 |
| A | 12 | 250 | 224315 | 1434.19 | 632 | 617 | 156.0 |
| A | 4 | 3 | 180478 | 1153.14 | 632 | 617 | 156.0 |
| B | 7 | 0 | 563179 | 4140.96 | 635 | 613 | 135.9 |
| B | 5 | 185 | 253815 | 1863.78 | 635 | 613 | 135.9 |
| B | 0 | 229 | 109078 | 798.39 | 635 | 613 | 135.9 |
| C | 15 | 196 | 2169420 | 14696.94 | 534 | 531 | 147.6 |
| C | 15 | 195 | 838640 | 5679.24 | 534 | 531 | 147.6 |
| C | 0 | 208 | 561375 | 3800.42 | 534 | 531 | 147.6 |
| D | 8 | 246 | 222559 | 1305.68 | 612 | 591 | 170.0 |
| D | 2 | 249 | 217573 | 1276.35 | 612 | 591 | 170.0 |
| D | 2 | 165 | 173814 | 1018.95 | 612 | 591 | 170.0 |
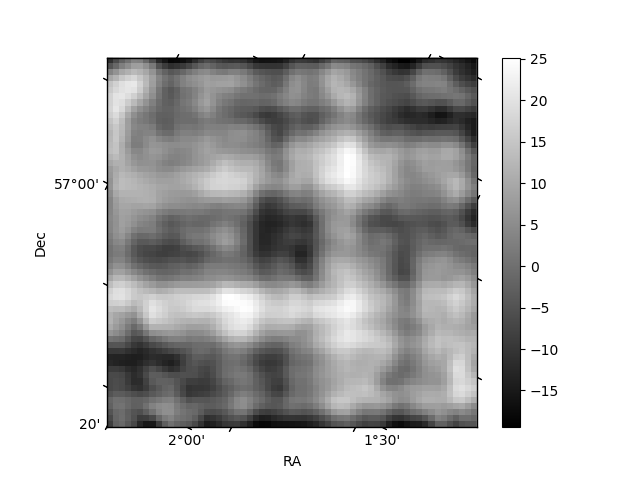
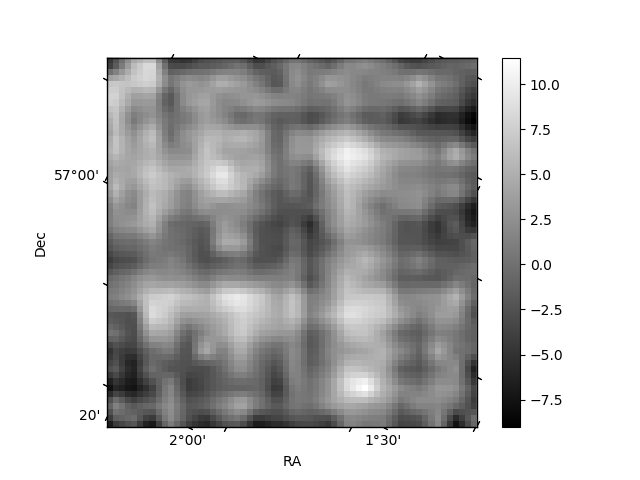
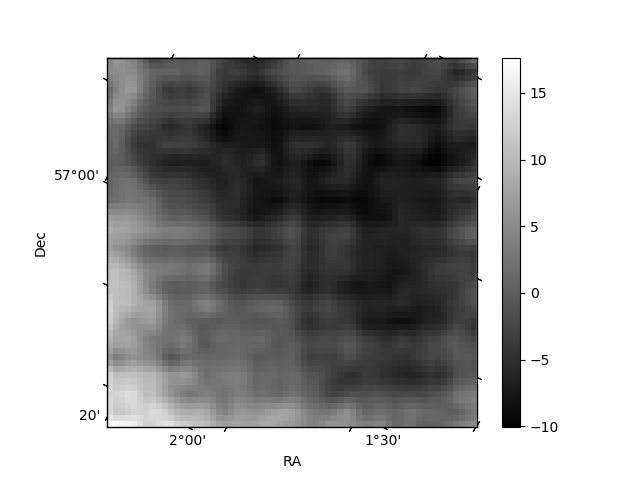
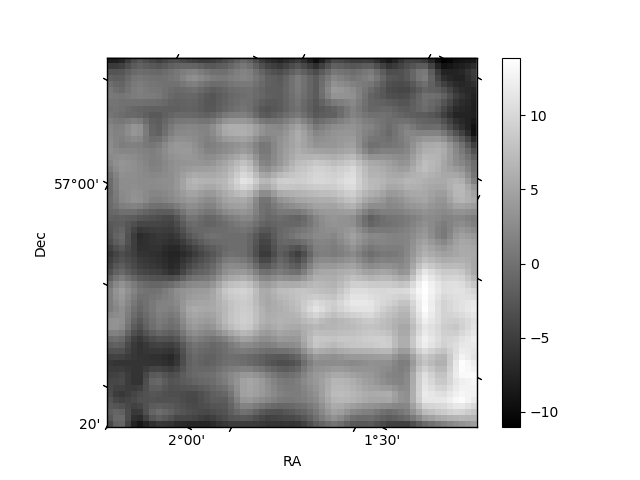
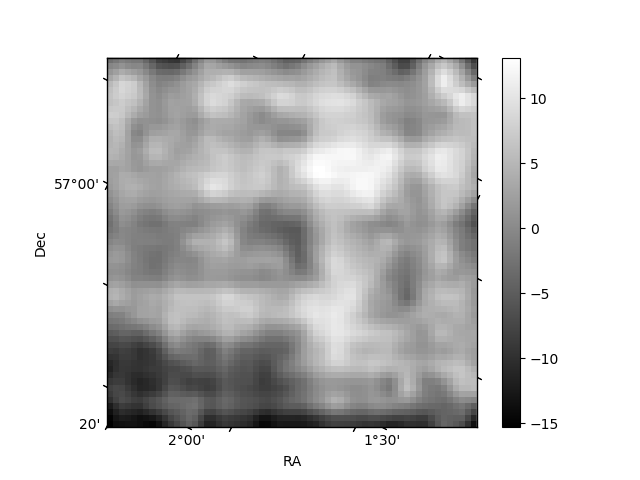
Histogram calculated using DETX and DETY for each event in the final _common_clean file
| Quadrant A | 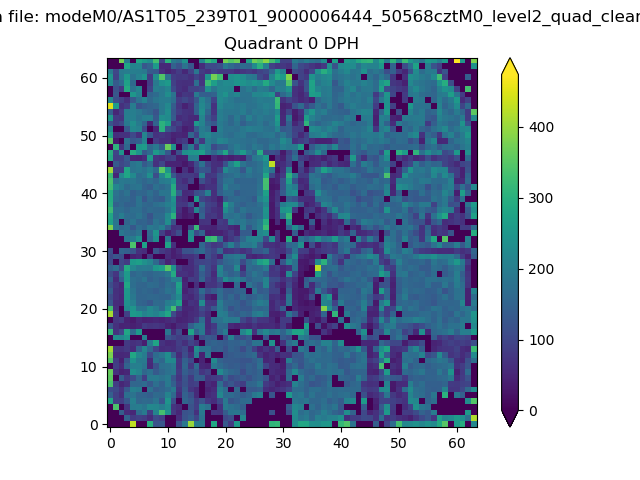 |
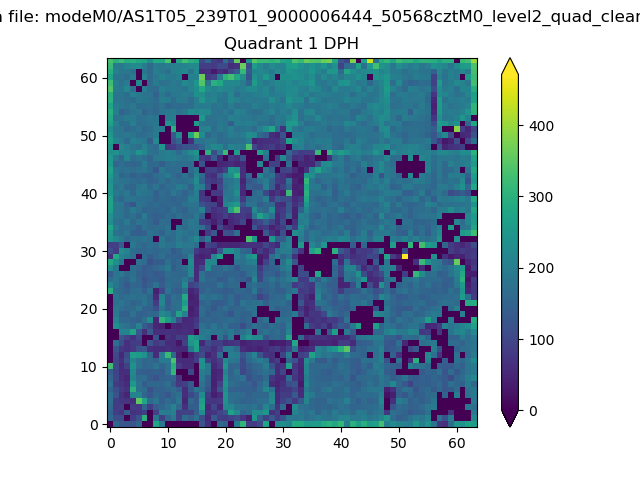 |
Quadrant B |
|---|---|---|---|
| Quadrant D | 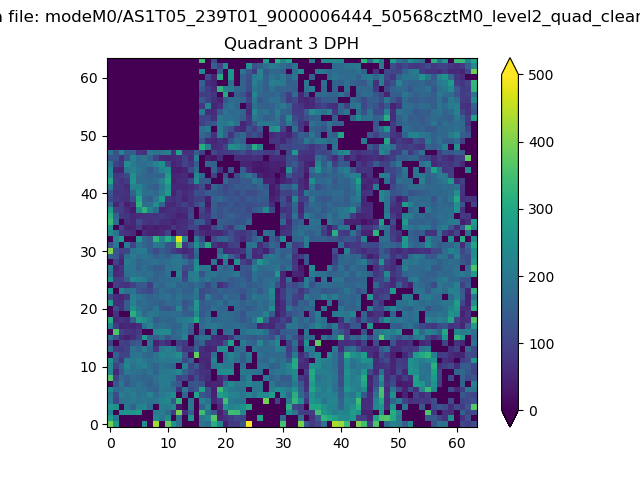 |
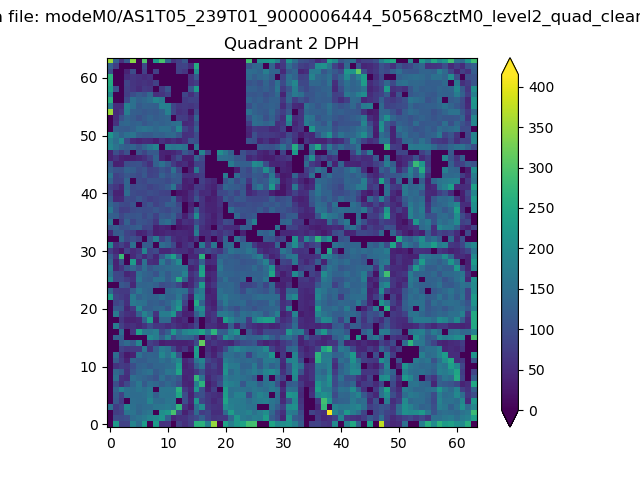 |
Quadrant C |
| Plot type | Count rate plots | Images |
|---|---|---|
| Comparison with Poisson distribution Blue bars denote a histogram of data divided into 1 sec bins. Red curve is a Poisson curve with rate = median count rate of data. |
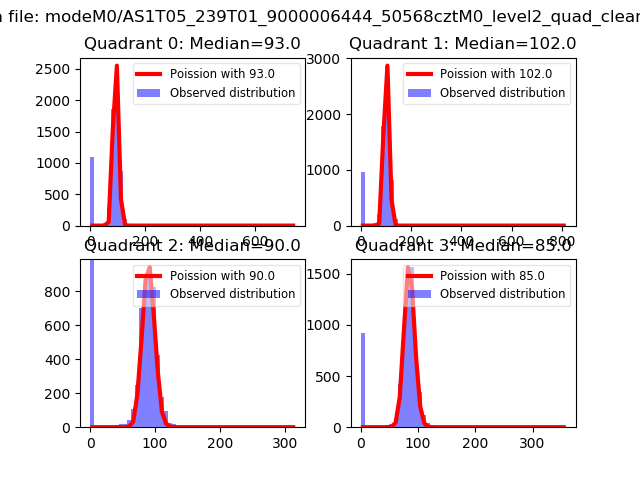 |
 |
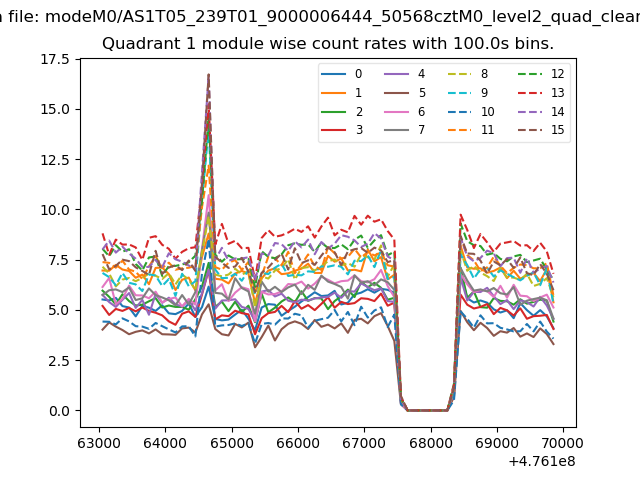
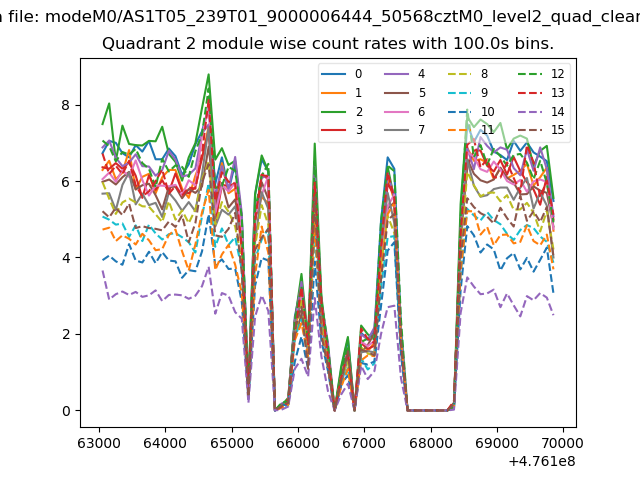
| Quadrant-wise count rates Data is divided into 100 sec bins |
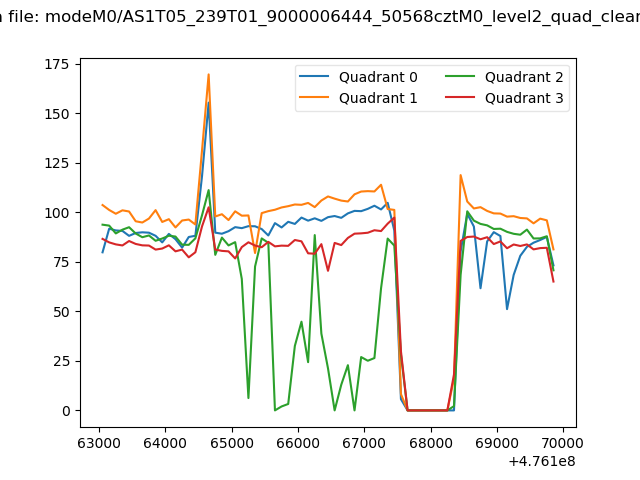 |
|
| Module-wise count rates for Quadrant A Data is divided into 100 sec bins |
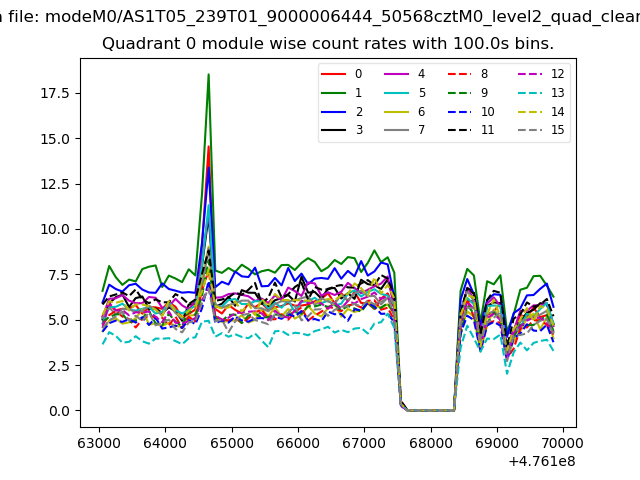 |
 |
| Module-wise count rates for Quadrant B Data is divided into 100 sec bins |
 |
 |
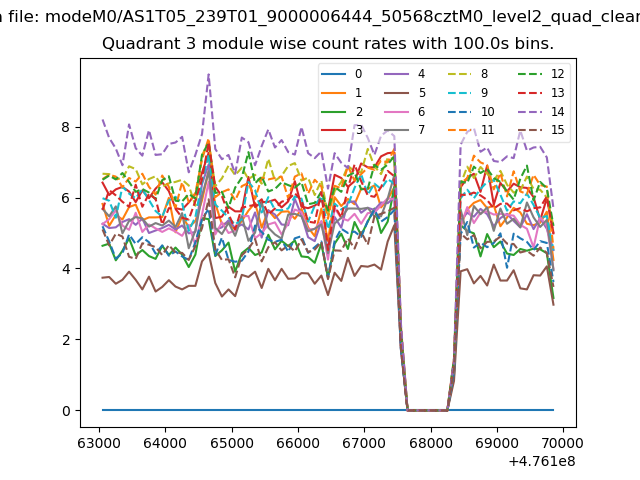
| Module-wise count rates for Quadrant C Data is divided into 100 sec bins |
 |
 |
| Module-wise count rates for Quadrant D Data is divided into 100 sec bins |
 |
 |
| Parameter | Plot |
|---|---|
| CZT HV Monitor | 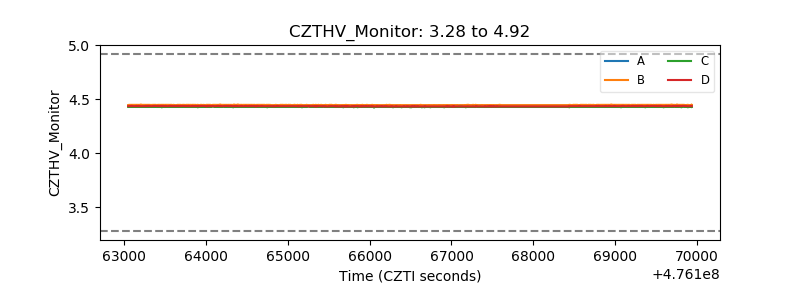 |
| D_VDD | 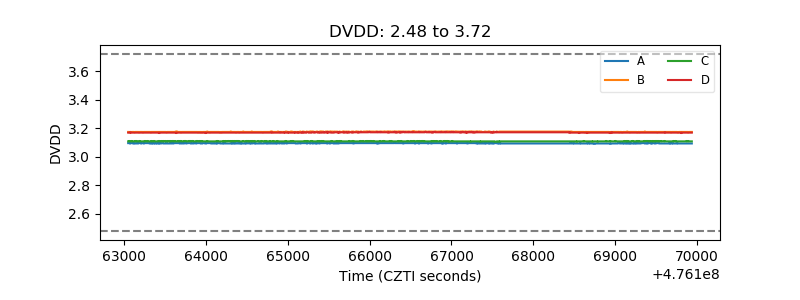 |
| Temperature 1 | 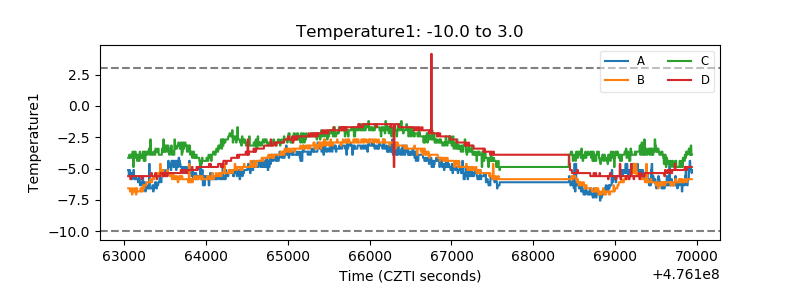 |
| Veto HV Monitor | 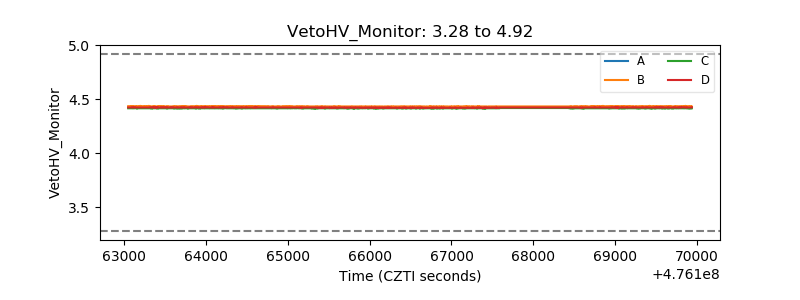 |
| Veto LLD | 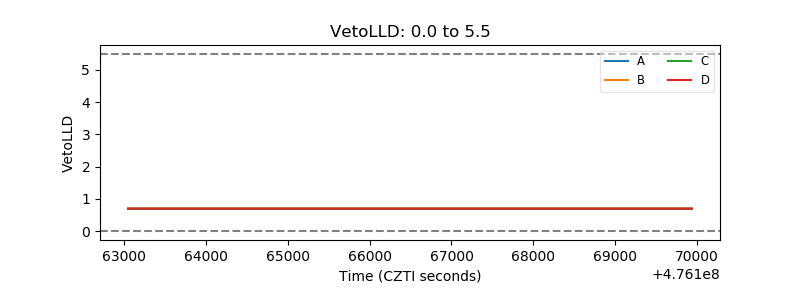 |
| Alpha Counter | 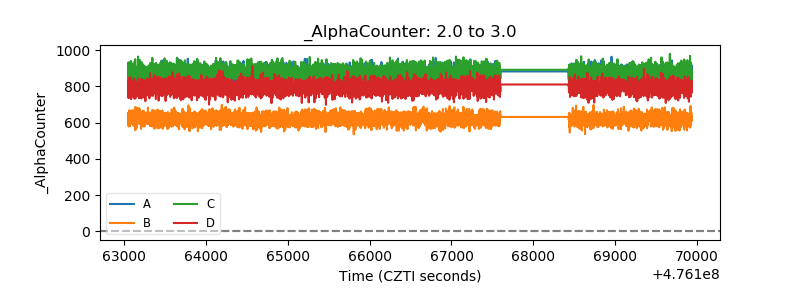 |
| _CPM_Rate | 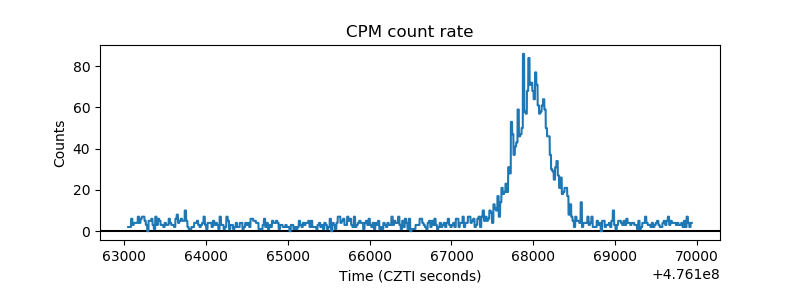 |
| CZT Counter | 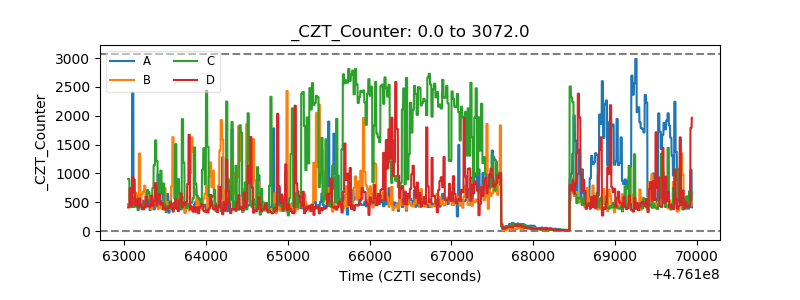 |
| +2.5 Volts monitor | 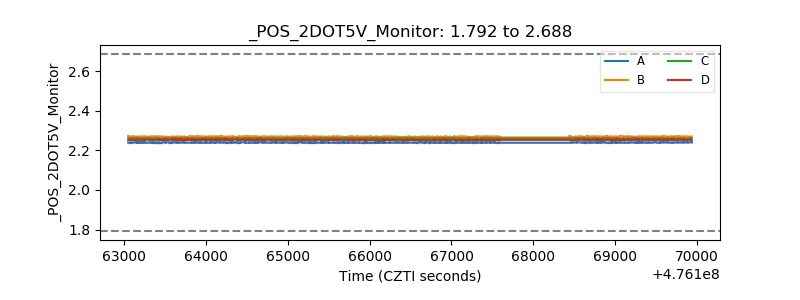 |
| +5 Volts monitor |  |
| _ROLL_ROT | 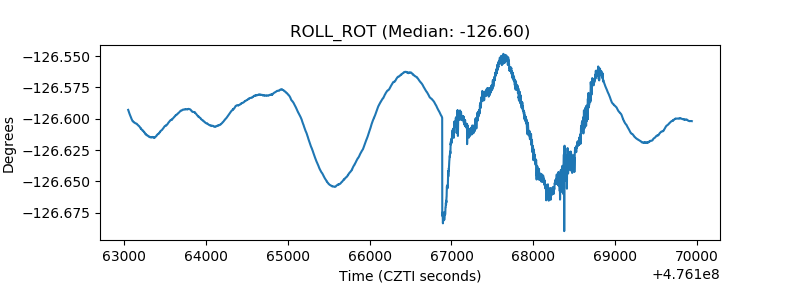 |
| _Roll_DEC | 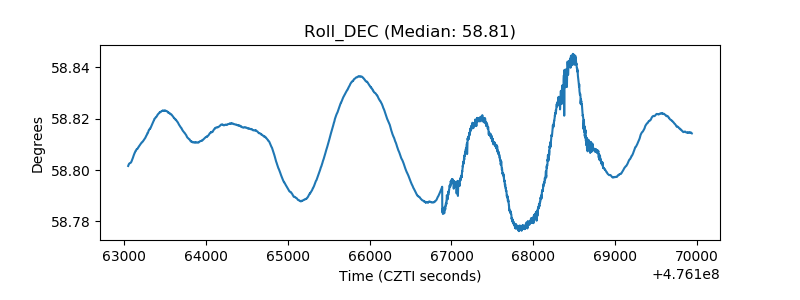 |
| _Roll_RA | 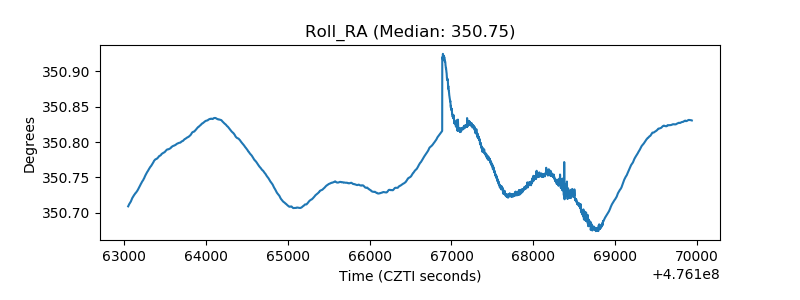 |
| Veto Counter | 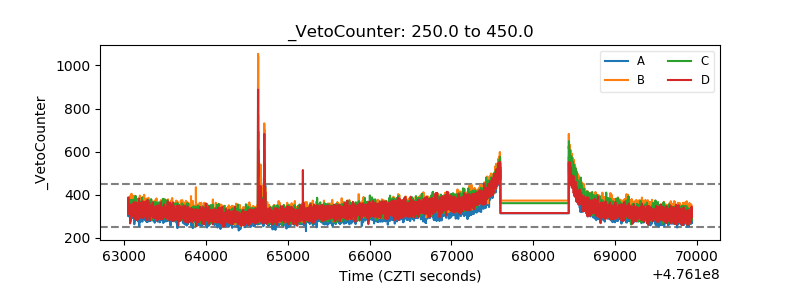 |