| Param | Original file | Final file |
|---|---|---|
| Filename | modeM0/AS1T05_239T01_9000006444_50569cztM0_level2.fits | modeM0/AS1T05_239T01_9000006444_50569cztM0_level2_quad_clean.evt |
| Size (bytes) | 686,358,720 | 96,649,920 |
| Size | 654.6 MB | 92.2 MB |
| Events in quadrant A | 5,379,545 | 640,454 |
| Events in quadrant B | 4,273,911 | 718,921 |
| Events in quadrant C | 8,511,628 | 506,859 |
| Events in quadrant D | 6,680,358 | 555,624 |
| Mode M0 | |||
|---|---|---|---|
| Quadrant | BADHDUFLAG | Total packets | Discarded packets |
| A | 0 | 20756 | 1 |
| B | 0 | 17843 | 1 |
| C | 0 | 30430 | 1 |
| D | 0 | 25036 | 1 |
| Mode M9 | |||
|---|---|---|---|
| Quadrant | BADHDUFLAG | Total packets | Discarded packets |
| A | 0 | 1 | 0 |
| B | 0 | 1 | 0 |
| C | 0 | 1 | 0 |
| D | 0 | 1 | 0 |
| Mode SS | |||
|---|---|---|---|
| Quadrant | BADHDUFLAG | Total packets | Discarded packets |
| A | 0 | 148 | 0 |
| B | 0 | 148 | 0 |
| C | 0 | 148 | 0 |
| D | 0 | 148 | 0 |
| Quadrant | Total seconds | Saturated seconds | Saturation percentage |
|---|---|---|---|
| A | 7239 | 490 | 6.768891% |
| B | 7239 | 313 | 4.323802% |
| C | 7240 | 1855 | 25.621547% |
| D | 7240 | 875 | 12.085635% |
Noise dominated data is calculated using 1-second bins in cleaned event files. If a bin has >2000 counts, and if more than 50% of those come from <1% of pixels, then it is considered to be noise-dominated and hence unusable.
| Quadrant | # 1 sec bins | Bins with >0 counts | Bins with >2000 counts | High rate bins dominated by noise | Noise dominated (total time) | Noise dominated (detector-on time) | Marked lightcurve |
|---|---|---|---|---|---|---|---|
| A | 7378 | 7238 | 307 | 307 | 4.16% | 4.24% | 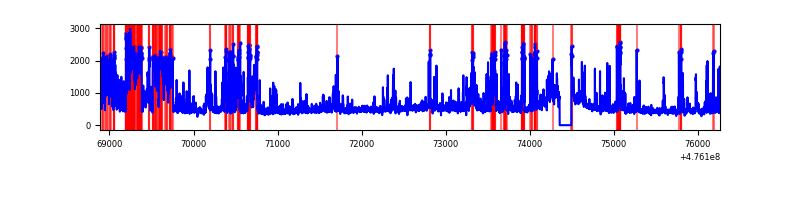 |
| B | 7378 | 7238 | 89 | 89 | 1.21% | 1.23% | 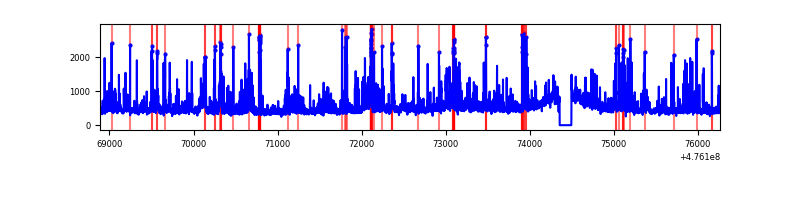 |
| C | 7379 | 7239 | 1747 | 1747 | 23.68% | 24.13% | 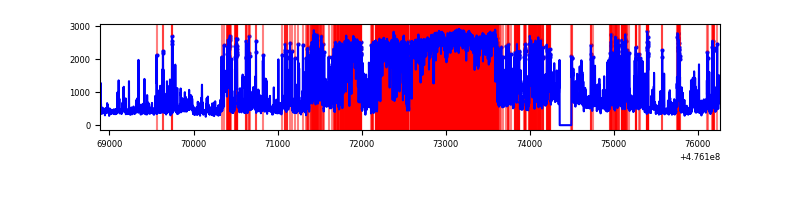 |
| D | 7379 | 7239 | 945 | 945 | 12.81% | 13.05% | 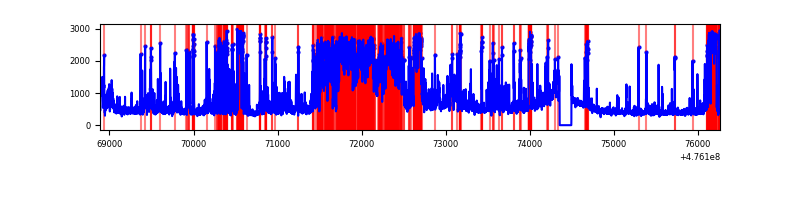 |
Top three noisy pixels from each quadrant. If the there are fewer than three noisy pixels in the level2.evt file, extra rows are filled as -1
| Pixel properties | Quadrant properties | ||||||
|---|---|---|---|---|---|---|---|
| Quadrant | DetID | PixID | Counts | Sigma | Mean | Median | Sigma |
| A | 12 | 80 | 985727 | 5209.56 | 765 | 746 | 189.1 |
| A | 12 | 250 | 415122 | 2191.63 | 765 | 746 | 189.1 |
| A | 4 | 3 | 251107 | 1324.16 | 765 | 746 | 189.1 |
| B | 7 | 0 | 268869 | 1638.86 | 766 | 739 | 163.6 |
| B | 5 | 185 | 177944 | 1083.11 | 766 | 739 | 163.6 |
| B | 0 | 229 | 142208 | 864.69 | 766 | 739 | 163.6 |
| C | 15 | 196 | 3773600 | 21651.47 | 637 | 633 | 174.3 |
| C | 13 | 3 | 626769 | 3593.13 | 637 | 633 | 174.3 |
| C | 0 | 208 | 325619 | 1864.96 | 637 | 633 | 174.3 |
| D | 8 | 246 | 1546482 | 7641.31 | 719 | 691 | 202.3 |
| D | 6 | 42 | 529711 | 2615.11 | 719 | 691 | 202.3 |
| D | 12 | 128 | 317570 | 1566.43 | 719 | 691 | 202.3 |
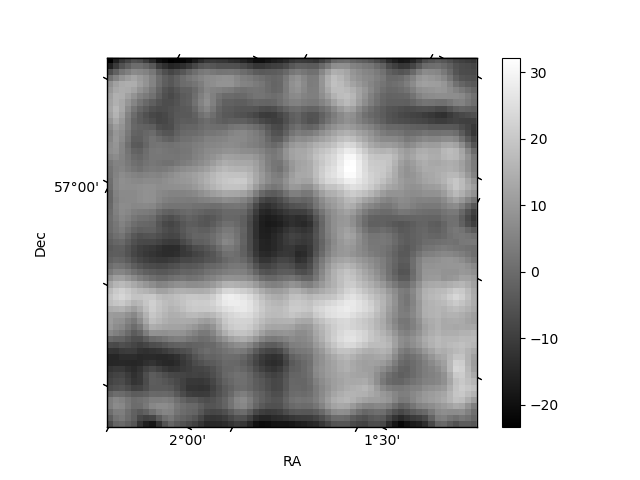
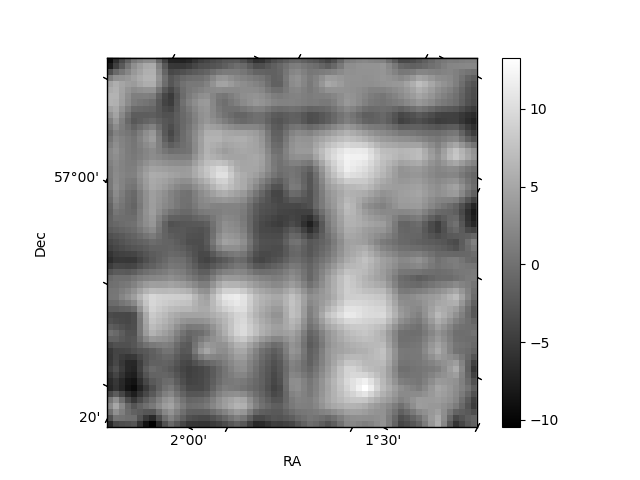
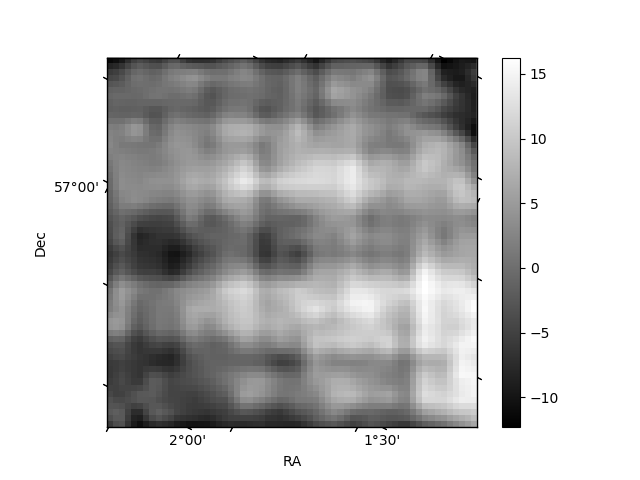
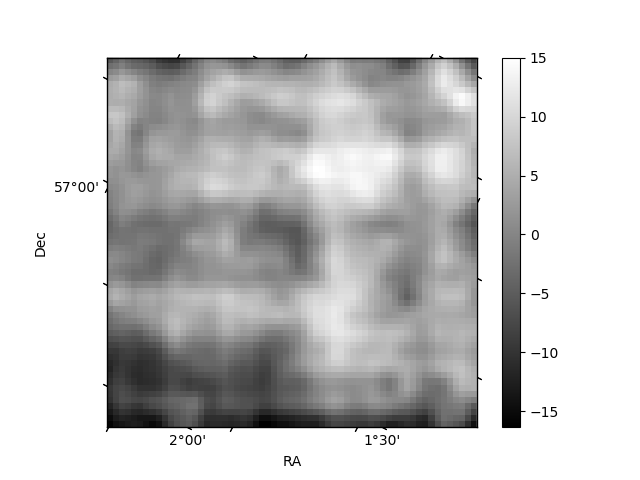
Histogram calculated using DETX and DETY for each event in the final _common_clean file
| Quadrant A | 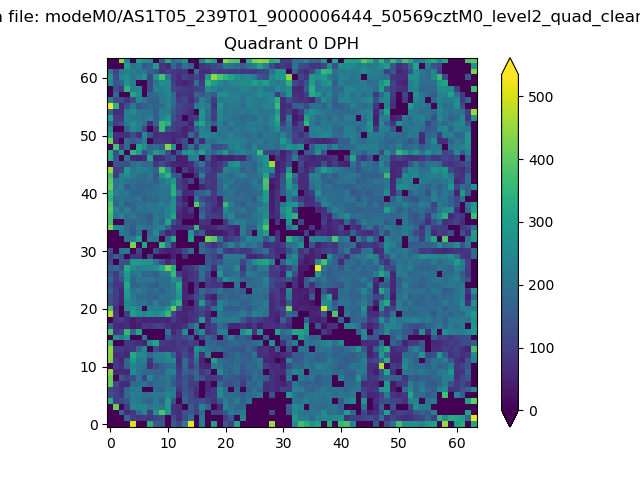 |
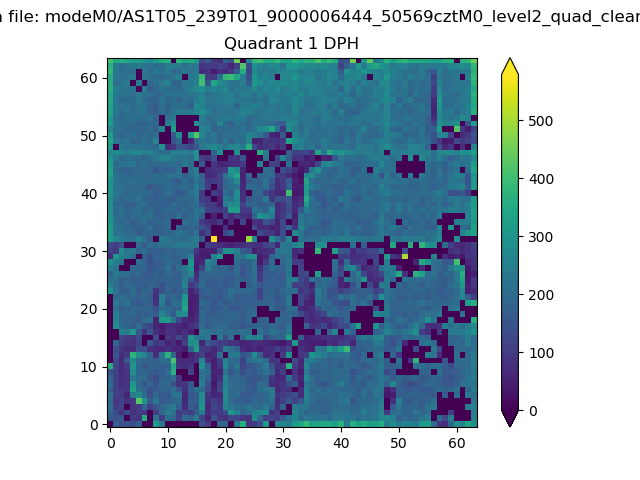 |
Quadrant B |
|---|---|---|---|
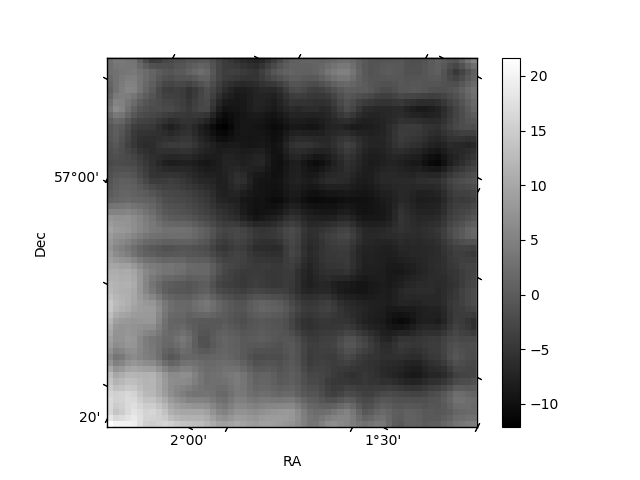
| Quadrant D | 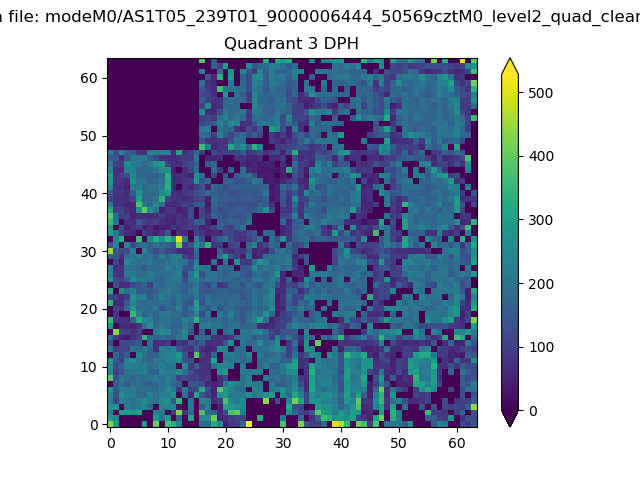 |
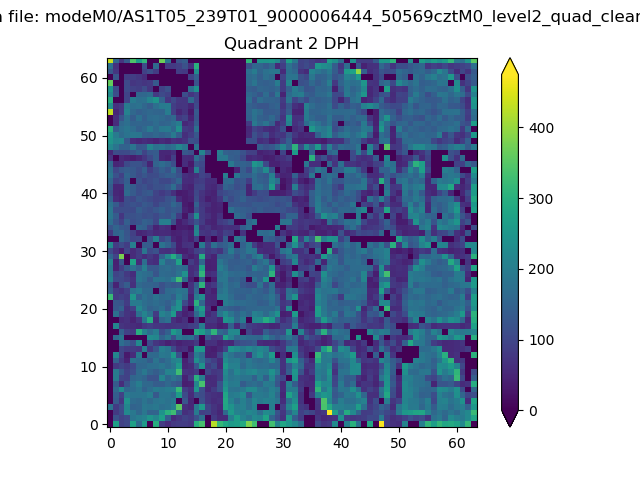 |
Quadrant C |
| Plot type | Count rate plots | Images |
|---|---|---|
| Comparison with Poisson distribution Blue bars denote a histogram of data divided into 1 sec bins. Red curve is a Poisson curve with rate = median count rate of data. |
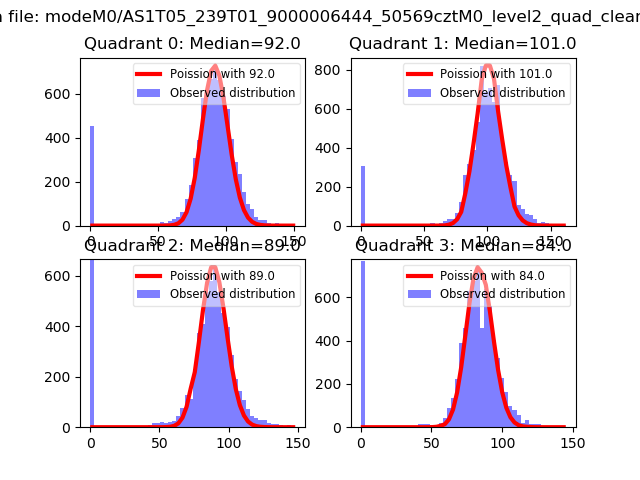 |
 |
| Quadrant-wise count rates Data is divided into 100 sec bins |
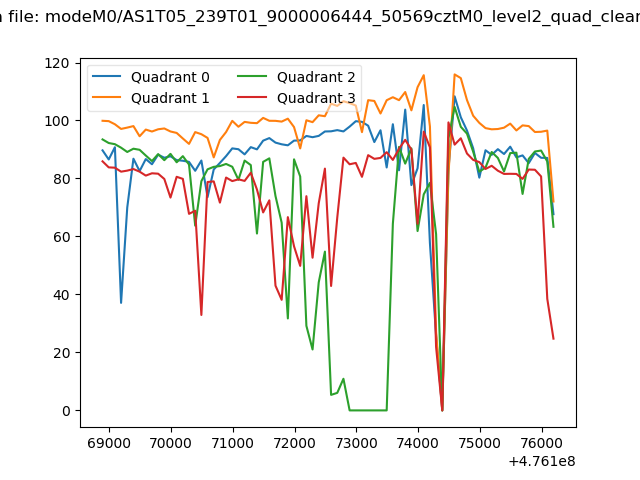 |
|
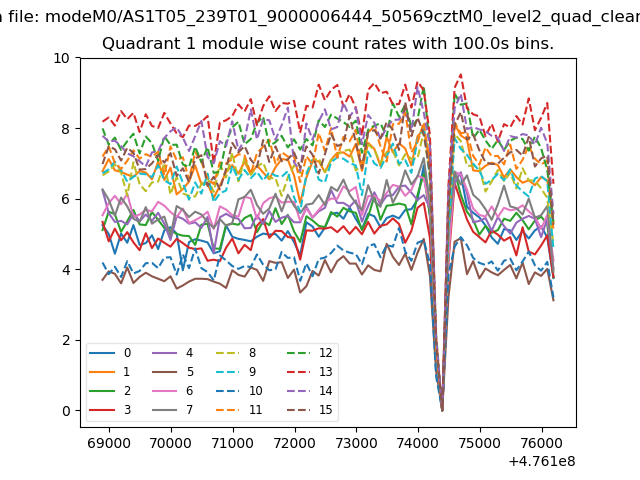
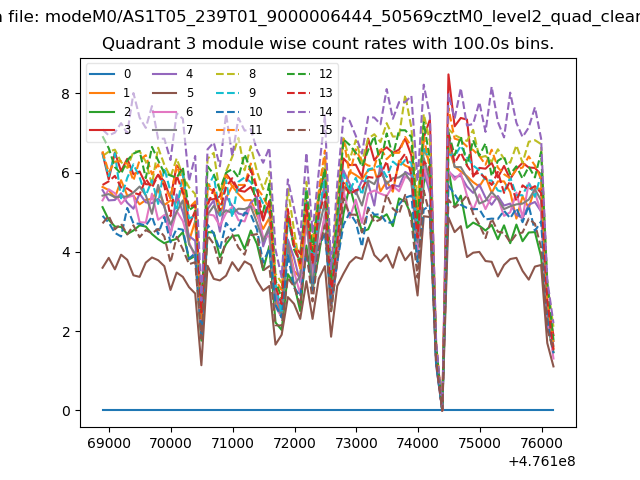
| Module-wise count rates for Quadrant A Data is divided into 100 sec bins |
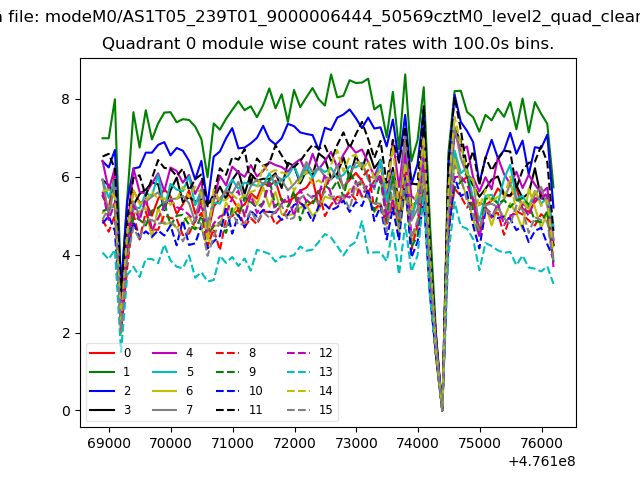 |
 |
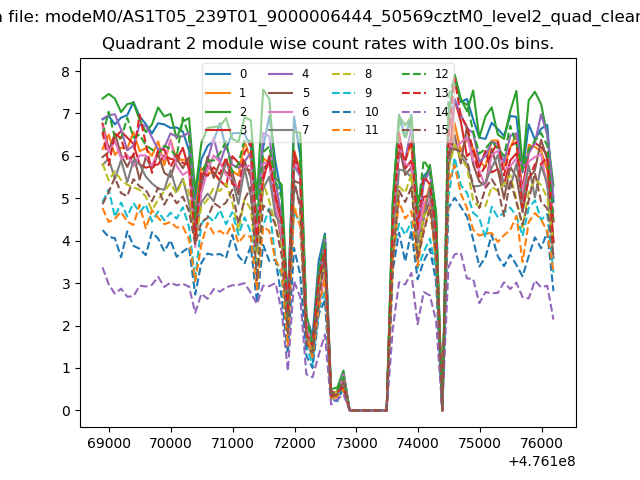
| Module-wise count rates for Quadrant B Data is divided into 100 sec bins |
 |
 |
| Module-wise count rates for Quadrant C Data is divided into 100 sec bins |
 |
 |
| Module-wise count rates for Quadrant D Data is divided into 100 sec bins |
 |
 |
| Parameter | Plot |
|---|---|
| CZT HV Monitor | 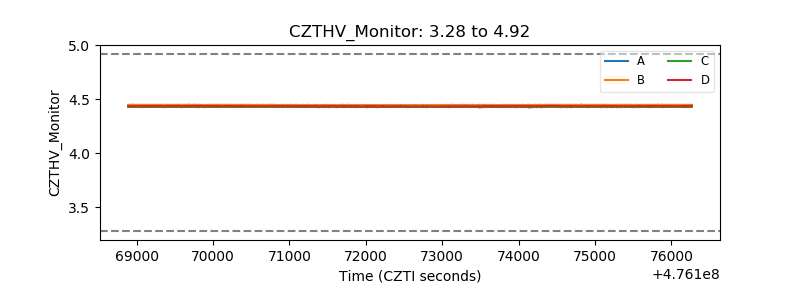 |
| D_VDD | 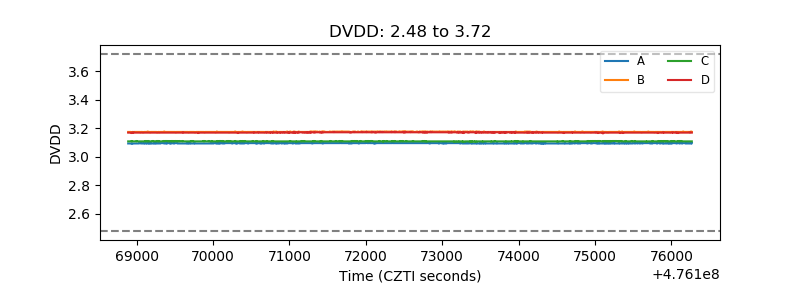 |
| Temperature 1 | 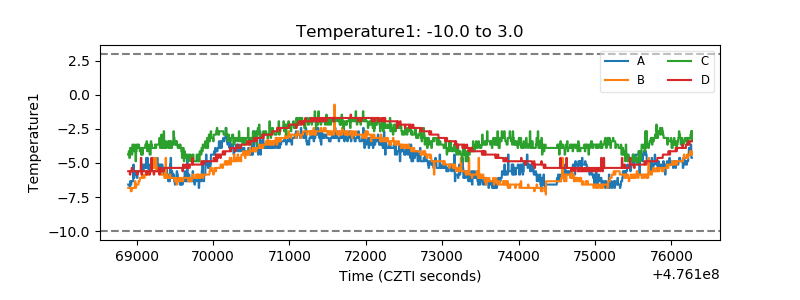 |
| Veto HV Monitor | 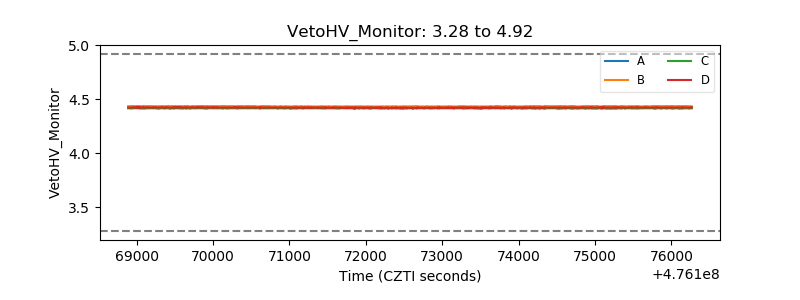 |
| Veto LLD | 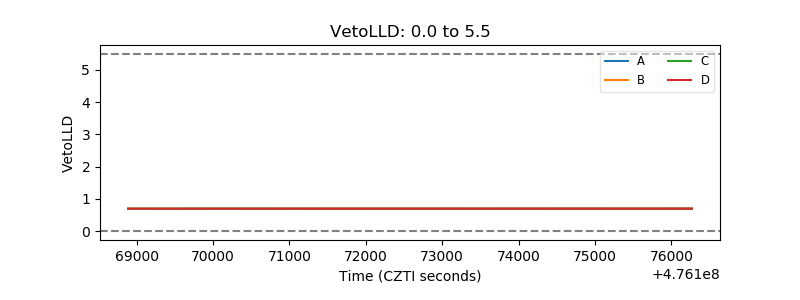 |
| Alpha Counter | 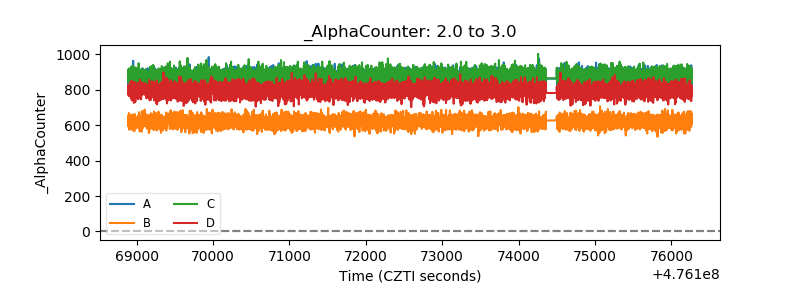 |
| _CPM_Rate | 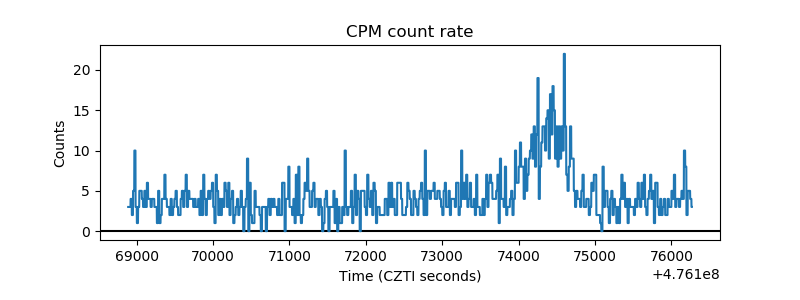 |
| CZT Counter | 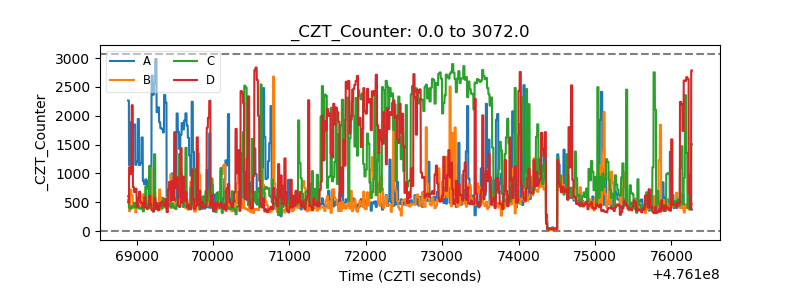 |
| +2.5 Volts monitor | 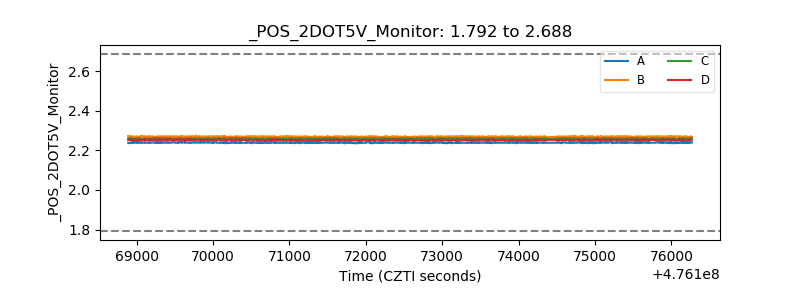 |
| +5 Volts monitor |  |
| _ROLL_ROT | 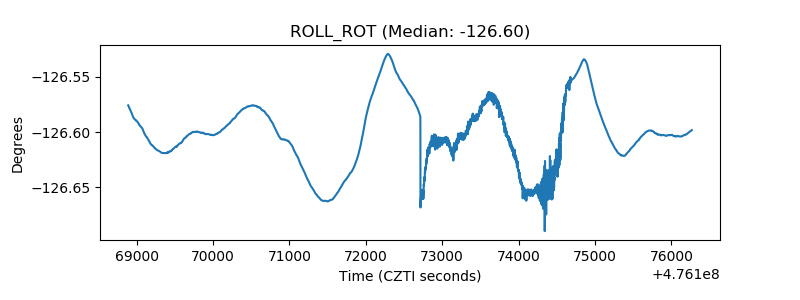 |
| _Roll_DEC | 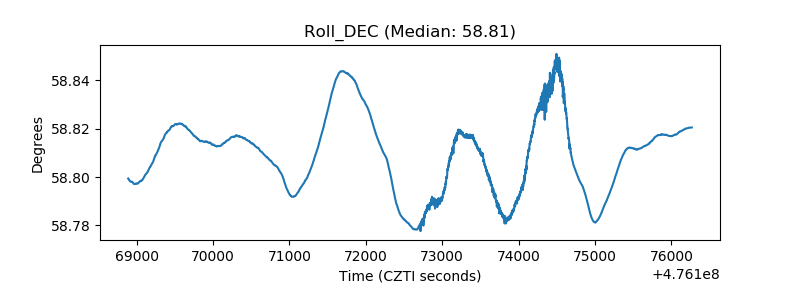 |
| _Roll_RA | 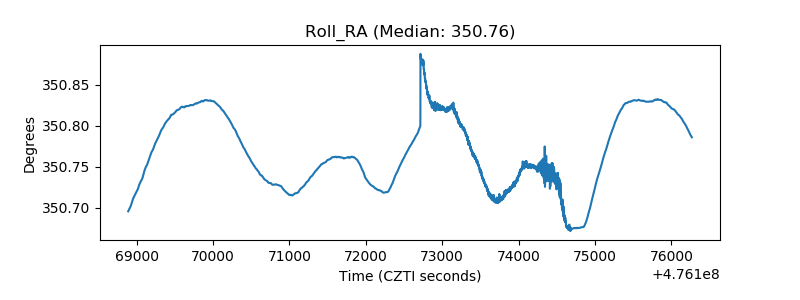 |
| Veto Counter | 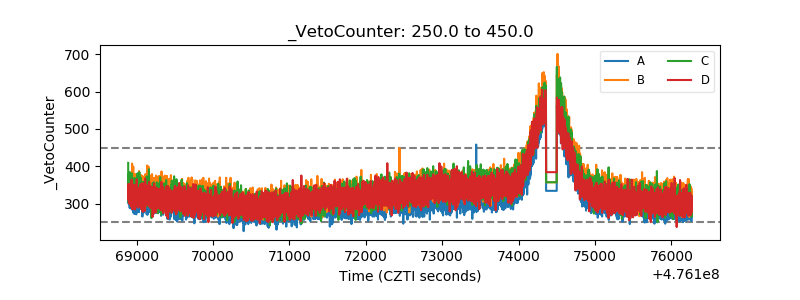 |