| Param | Original file | Final file |
|---|---|---|
| Filename | modeM0/AS1T05_239T01_9000006444_50570cztM0_level2.fits | modeM0/AS1T05_239T01_9000006444_50570cztM0_level2_quad_clean.evt |
| Size (bytes) | 609,413,760 | 102,170,880 |
| Size | 581.2 MB | 97.4 MB |
| Events in quadrant A | 4,197,254 | 674,837 |
| Events in quadrant B | 4,747,201 | 729,088 |
| Events in quadrant C | 7,558,795 | 577,118 |
| Events in quadrant D | 5,481,646 | 597,526 |
| Mode M0 | |||
|---|---|---|---|
| Quadrant | BADHDUFLAG | Total packets | Discarded packets |
| A | 0 | 17372 | 0 |
| B | 0 | 19444 | 0 |
| C | 0 | 27678 | 0 |
| D | 0 | 21522 | 0 |
| Mode SS | |||
|---|---|---|---|
| Quadrant | BADHDUFLAG | Total packets | Discarded packets |
| A | 0 | 148 | 0 |
| B | 0 | 148 | 0 |
| C | 0 | 148 | 0 |
| D | 0 | 148 | 0 |
| Quadrant | Total seconds | Saturated seconds | Saturation percentage |
|---|---|---|---|
| A | 7398 | 132 | 1.784266% |
| B | 7398 | 256 | 3.460395% |
| C | 7398 | 1153 | 15.585293% |
| D | 7399 | 329 | 4.446547% |
Noise dominated data is calculated using 1-second bins in cleaned event files. If a bin has >2000 counts, and if more than 50% of those come from <1% of pixels, then it is considered to be noise-dominated and hence unusable.
| Quadrant | # 1 sec bins | Bins with >0 counts | Bins with >2000 counts | High rate bins dominated by noise | Noise dominated (total time) | Noise dominated (detector-on time) | Marked lightcurve |
|---|---|---|---|---|---|---|---|
| A | 7397 | 7397 | 102 | 102 | 1.38% | 1.38% | 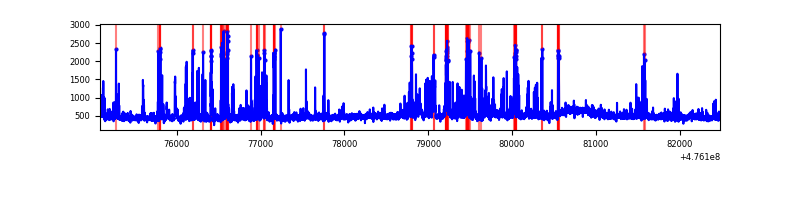 |
| B | 7397 | 7397 | 169 | 169 | 2.28% | 2.28% | 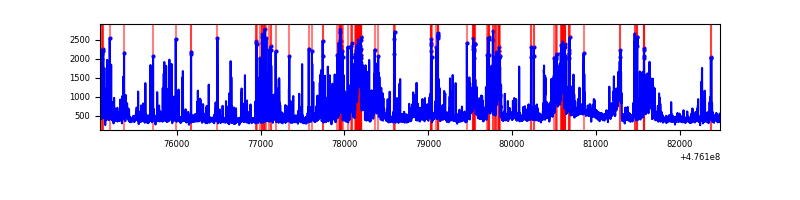 |
| C | 7397 | 7397 | 1146 | 1146 | 15.49% | 15.49% | 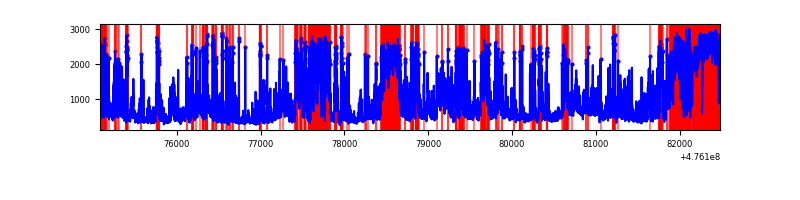 |
| D | 7398 | 7398 | 345 | 345 | 4.66% | 4.66% | 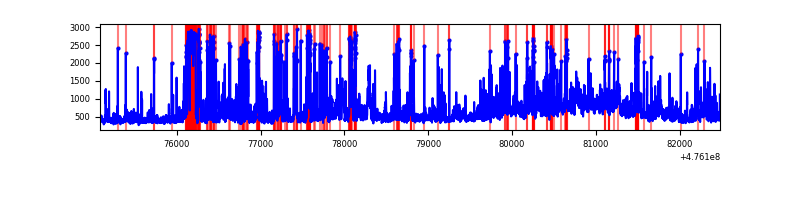 |
Top three noisy pixels from each quadrant. If the there are fewer than three noisy pixels in the level2.evt file, extra rows are filled as -1
| Pixel properties | Quadrant properties | ||||||
|---|---|---|---|---|---|---|---|
| Quadrant | DetID | PixID | Counts | Sigma | Mean | Median | Sigma |
| A | 12 | 250 | 342362 | 1813.06 | 768 | 752 | 188.4 |
| A | 4 | 3 | 298509 | 1580.31 | 768 | 752 | 188.4 |
| A | 5 | 240 | 137570 | 726.15 | 768 | 752 | 188.4 |
| B | 7 | 0 | 535155 | 3294.04 | 760 | 734 | 162.2 |
| B | 2 | 249 | 263537 | 1619.86 | 760 | 734 | 162.2 |
| B | 0 | 229 | 226589 | 1392.12 | 760 | 734 | 162.2 |
| C | 15 | 196 | 2287832 | 11877.17 | 698 | 695 | 192.6 |
| C | 15 | 195 | 463820 | 2405.02 | 698 | 695 | 192.6 |
| C | 10 | 69 | 406350 | 2106.58 | 698 | 695 | 192.6 |
| D | 6 | 42 | 670875 | 3298.21 | 729 | 704 | 203.2 |
| D | 7 | 61 | 399740 | 1963.83 | 729 | 704 | 203.2 |
| D | 2 | 249 | 264512 | 1298.31 | 729 | 704 | 203.2 |
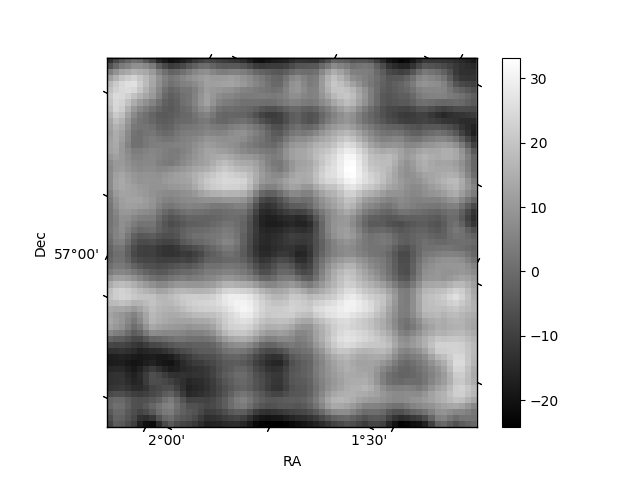
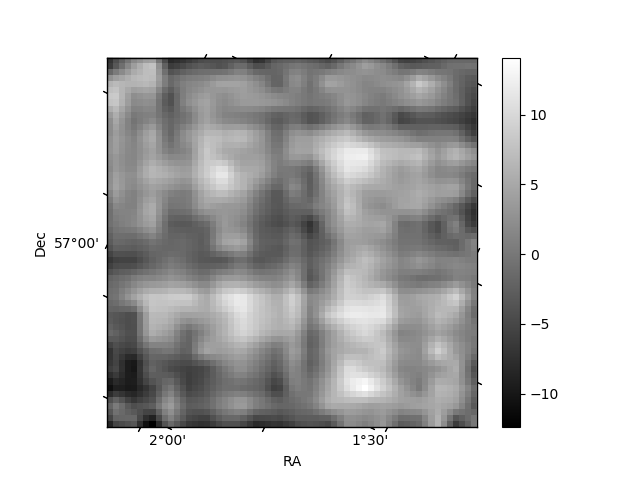
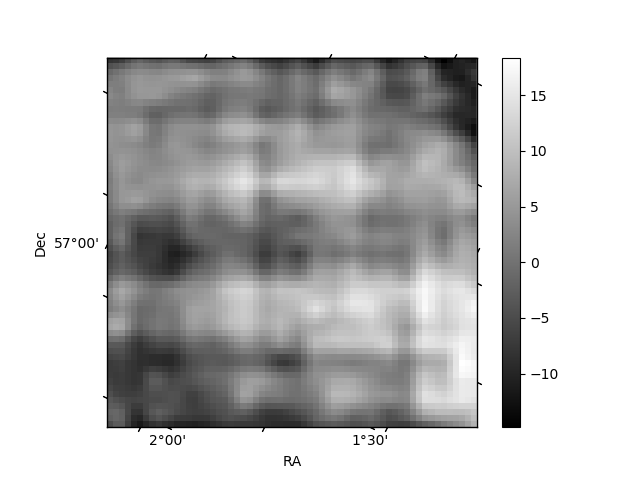
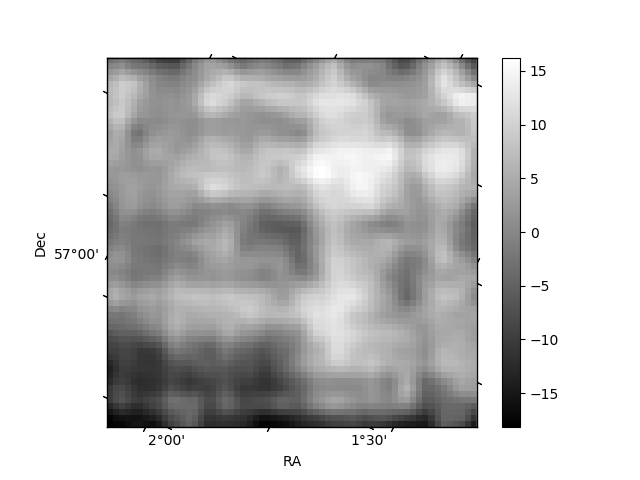
Histogram calculated using DETX and DETY for each event in the final _common_clean file
| Quadrant A | 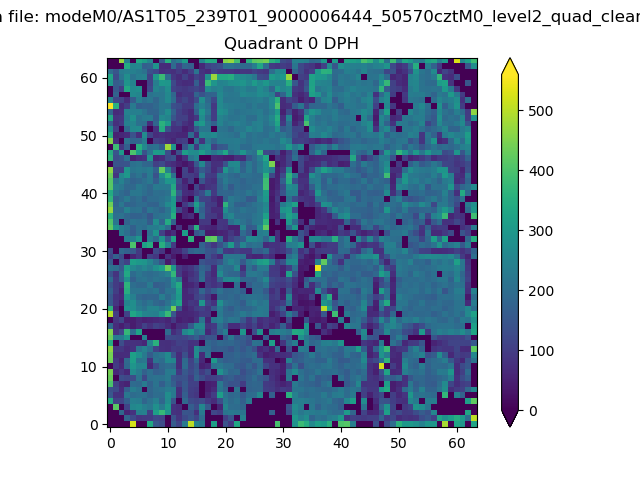 |
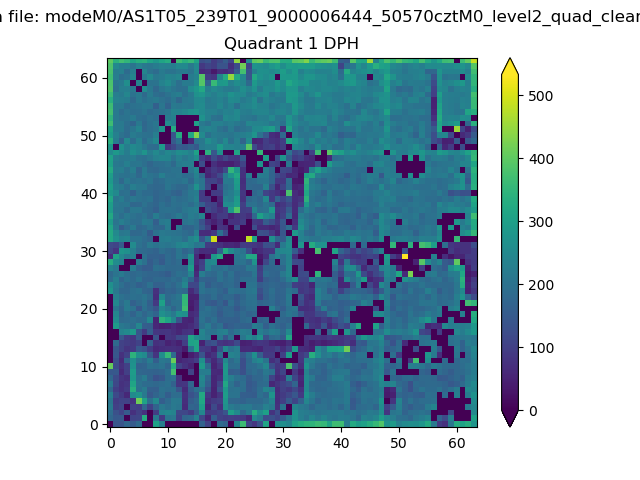 |
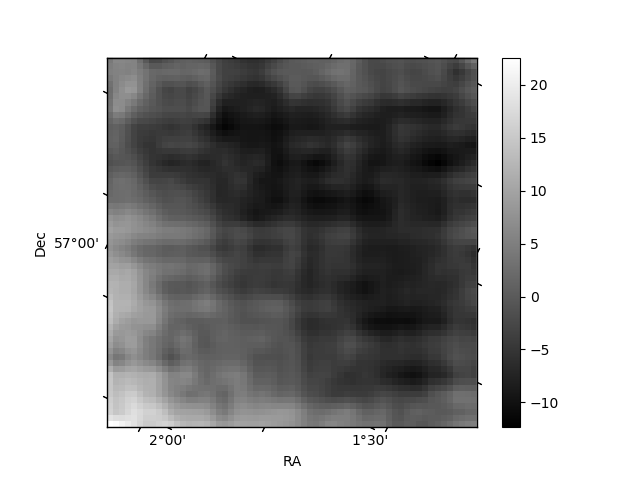
Quadrant B |
|---|---|---|---|
| Quadrant D | 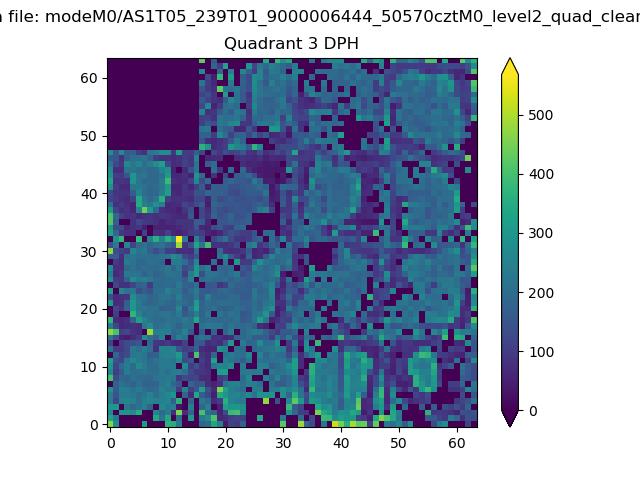 |
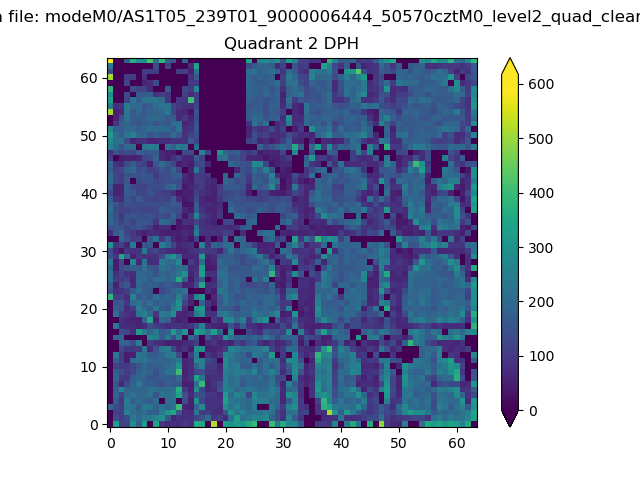 |
Quadrant C |
| Plot type | Count rate plots | Images |
|---|---|---|
| Comparison with Poisson distribution Blue bars denote a histogram of data divided into 1 sec bins. Red curve is a Poisson curve with rate = median count rate of data. |
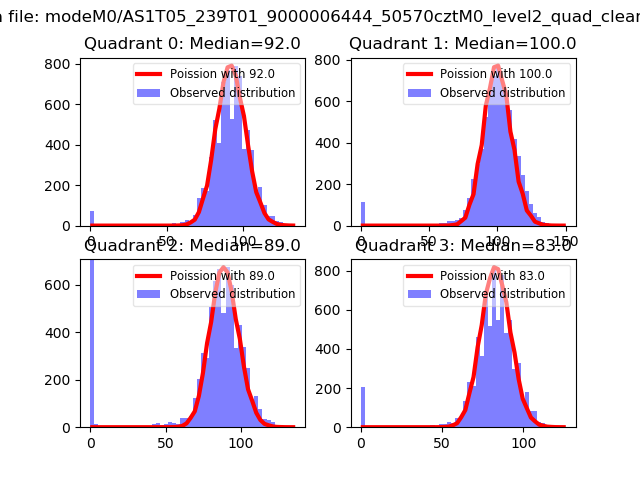 |
 |
| Quadrant-wise count rates Data is divided into 100 sec bins |
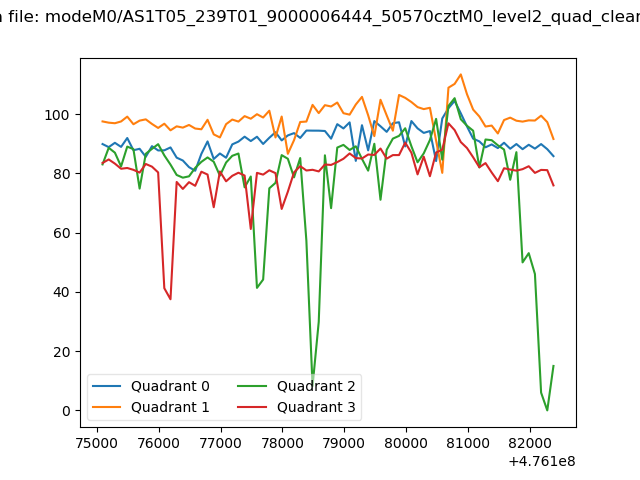 |
|
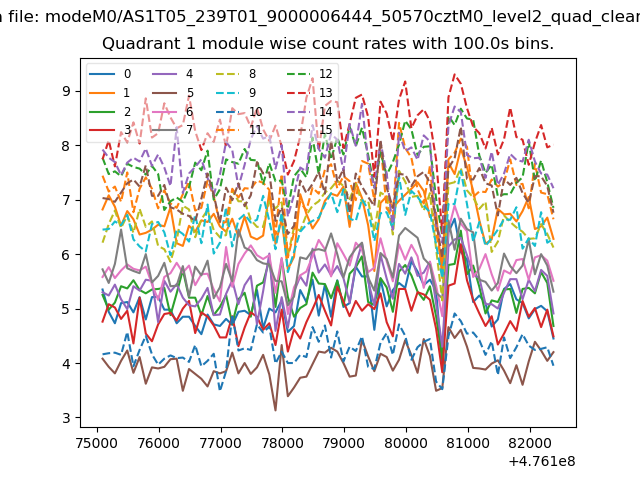
| Module-wise count rates for Quadrant A Data is divided into 100 sec bins |
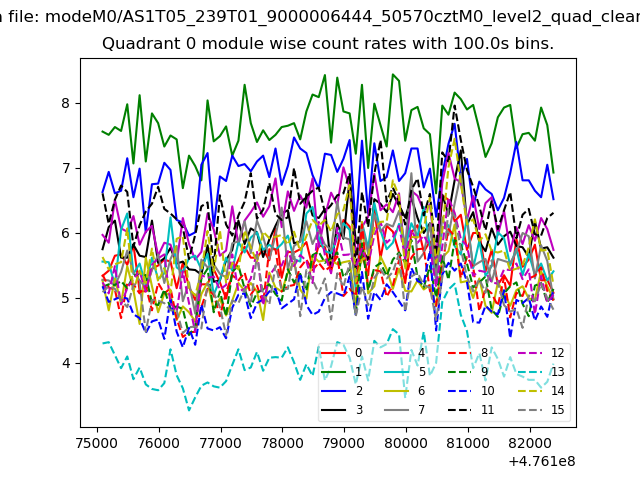 |
 |
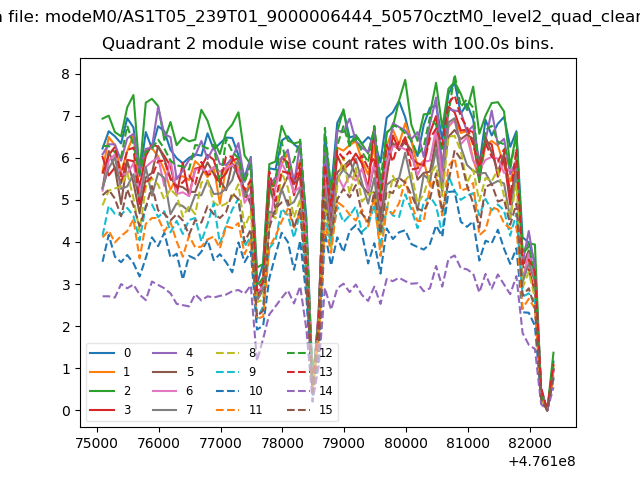
| Module-wise count rates for Quadrant B Data is divided into 100 sec bins |
 |
 |
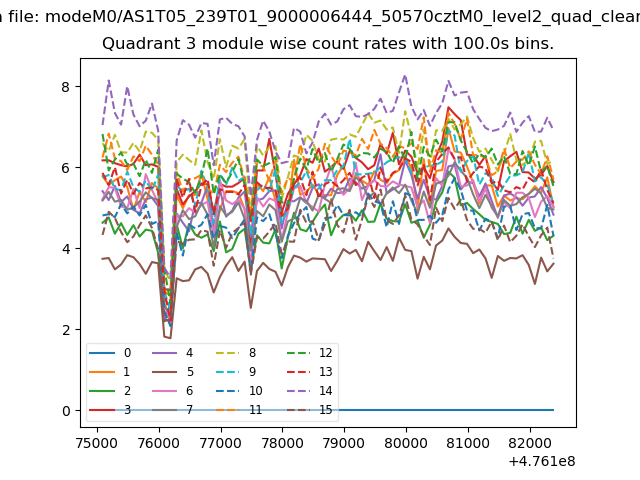
| Module-wise count rates for Quadrant C Data is divided into 100 sec bins |
 |
 |
| Module-wise count rates for Quadrant D Data is divided into 100 sec bins |
 |
 |
| Parameter | Plot |
|---|---|
| CZT HV Monitor | 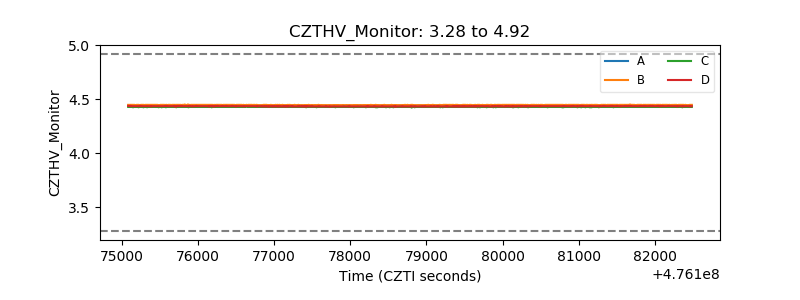 |
| D_VDD | 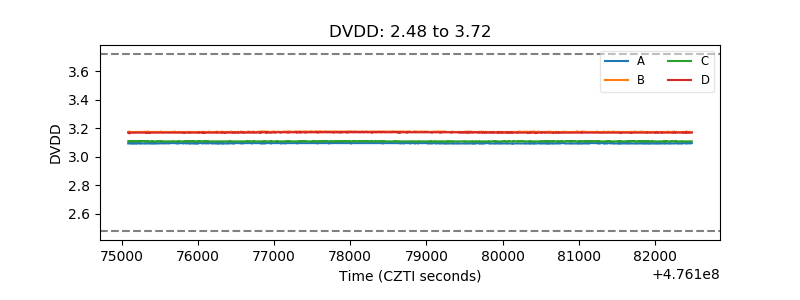 |
| Temperature 1 | 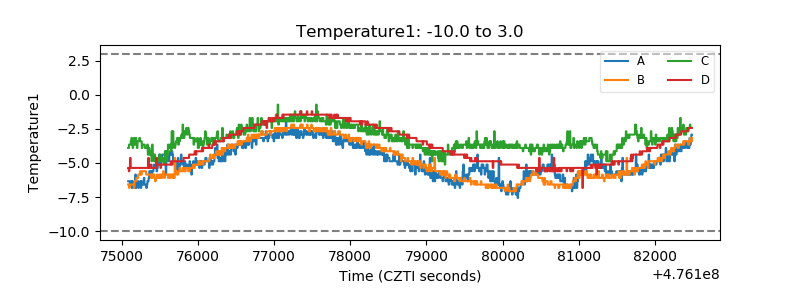 |
| Veto HV Monitor | 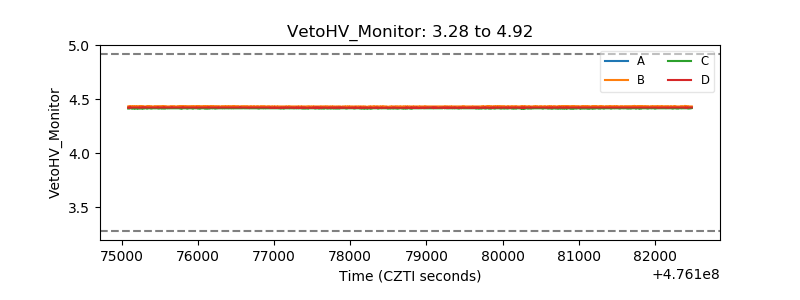 |
| Veto LLD | 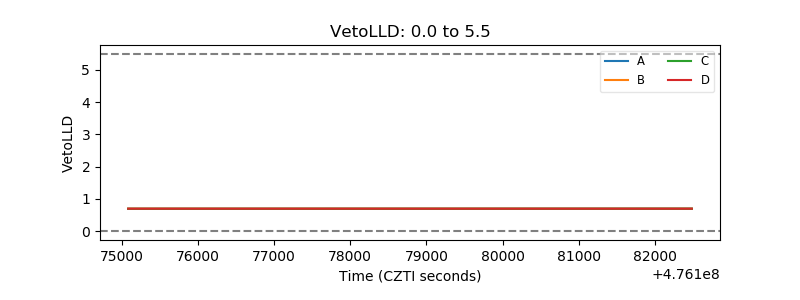 |
| Alpha Counter | 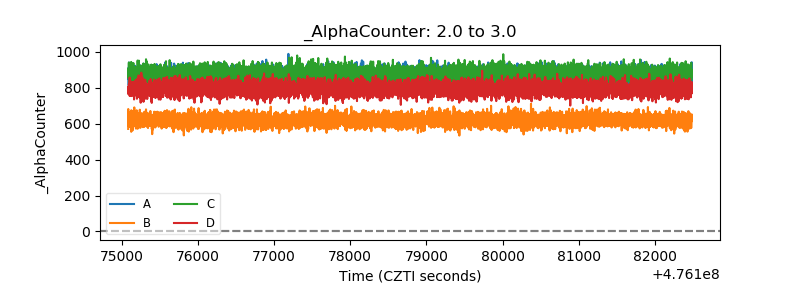 |
| _CPM_Rate | 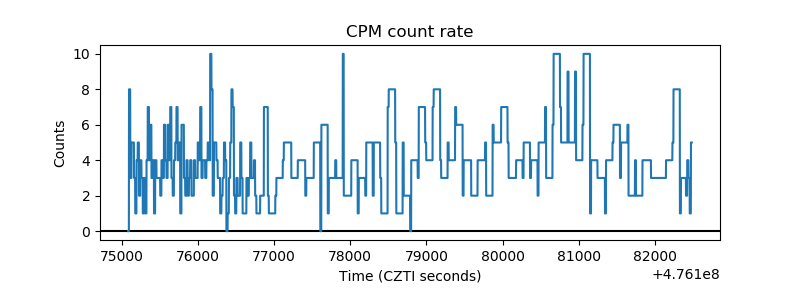 |
| CZT Counter | 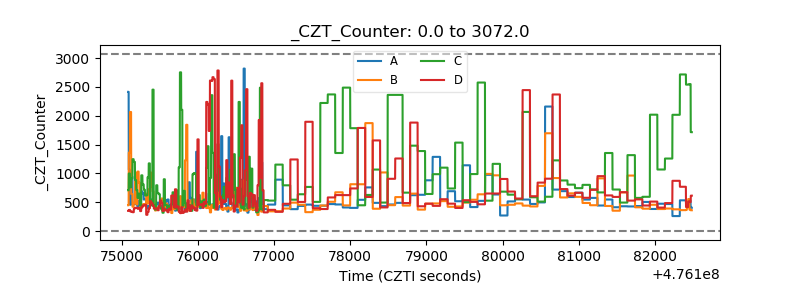 |
| +2.5 Volts monitor | 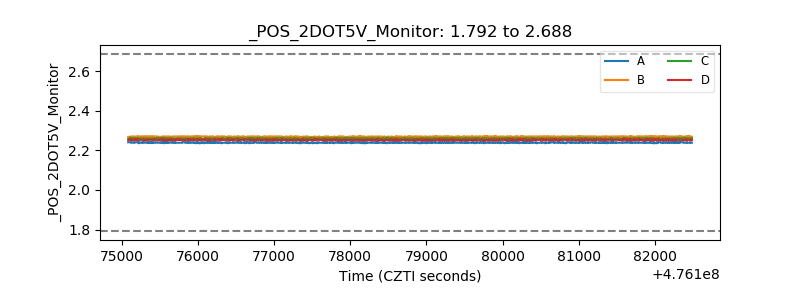 |
| +5 Volts monitor |  |
| _ROLL_ROT | 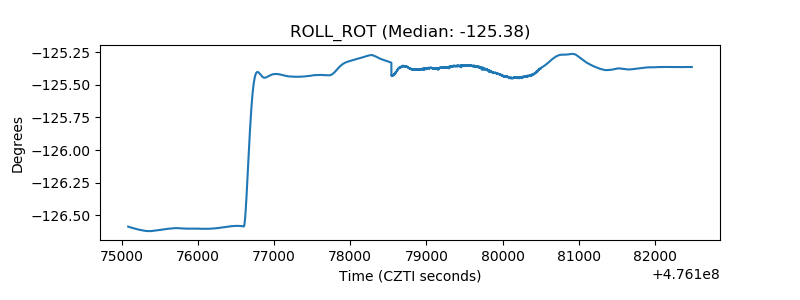 |
| _Roll_DEC | 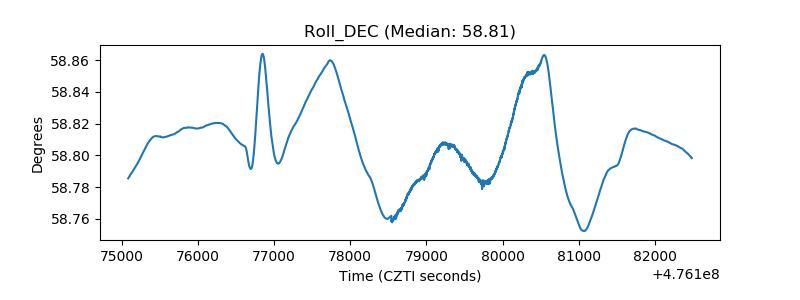 |
| _Roll_RA | 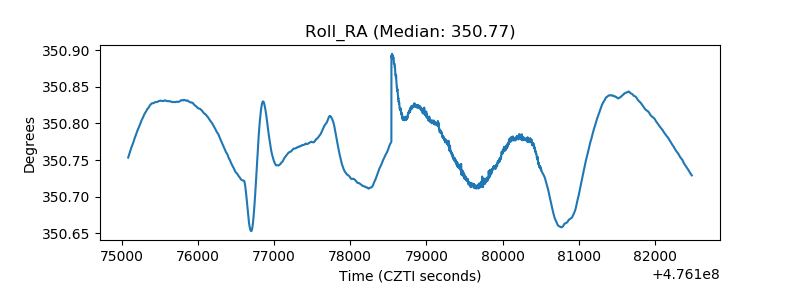 |
| Veto Counter | 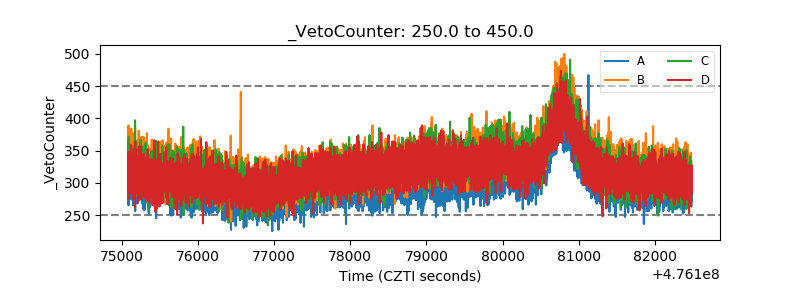 |