| Param | Original file | Final file |
|---|---|---|
| Filename | modeM0/AS1T05_239T01_9000006444_50574cztM0_level2.fits | modeM0/AS1T05_239T01_9000006444_50574cztM0_level2_quad_clean.evt |
| Size (bytes) | 2,450,183,040 | 215,936,640 |
| Size | 2.3 GB | 205.9 MB |
| Events in quadrant A | 13,064,883 | 1,676,790 |
| Events in quadrant B | 15,436,215 | 1,745,047 |
| Events in quadrant C | 32,864,332 | 717,020 |
| Events in quadrant D | 27,890,204 | 1,106,314 |
| Mode M0 | |||
|---|---|---|---|
| Quadrant | BADHDUFLAG | Total packets | Discarded packets |
| A | 0 | 51025 | 2 |
| B | 0 | 58885 | 2 |
| C | 0 | 110502 | 2 |
| D | 0 | 95911 | 2 |
| Mode M9 | |||
|---|---|---|---|
| Quadrant | BADHDUFLAG | Total packets | Discarded packets |
| A | 0 | 9 | 0 |
| B | 0 | 9 | 0 |
| C | 0 | 9 | 0 |
| D | 0 | 9 | 0 |
| Mode SS | |||
|---|---|---|---|
| Quadrant | BADHDUFLAG | Total packets | Discarded packets |
| A | 0 | 378 | 0 |
| B | 0 | 378 | 0 |
| C | 0 | 378 | 0 |
| D | 0 | 378 | 0 |
| Quadrant | Total seconds | Saturated seconds | Saturation percentage |
|---|---|---|---|
| A | 18740 | 787 | 4.199573% |
| B | 18741 | 1392 | 7.427565% |
| C | 18741 | 11270 | 60.135532% |
| D | 18740 | 5408 | 28.858058% |
Noise dominated data is calculated using 1-second bins in cleaned event files. If a bin has >2000 counts, and if more than 50% of those come from <1% of pixels, then it is considered to be noise-dominated and hence unusable.
| Quadrant | # 1 sec bins | Bins with >0 counts | Bins with >2000 counts | High rate bins dominated by noise | Noise dominated (total time) | Noise dominated (detector-on time) | Marked lightcurve |
|---|---|---|---|---|---|---|---|
| A | 19600 | 18742 | 468 | 468 | 2.39% | 2.50% | 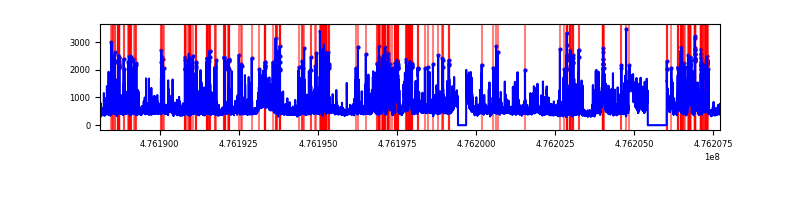 |
| B | 19601 | 18743 | 838 | 838 | 4.28% | 4.47% | 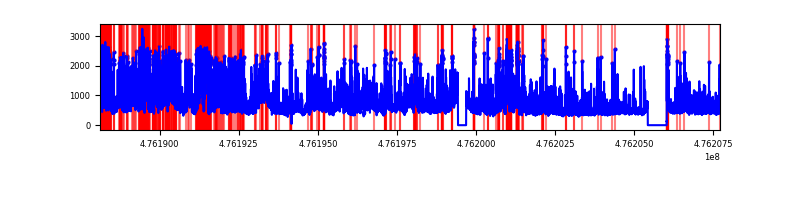 |
| C | 19601 | 18743 | 8726 | 8726 | 44.52% | 46.56% | 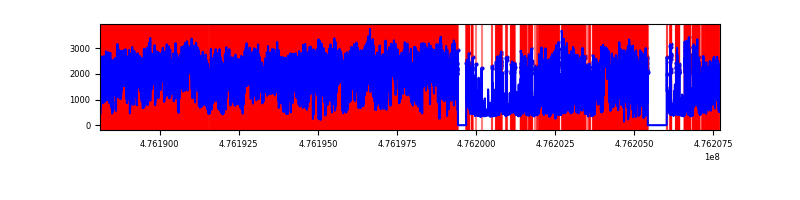 |
| D | 19600 | 18742 | 5479 | 5479 | 27.95% | 29.23% | 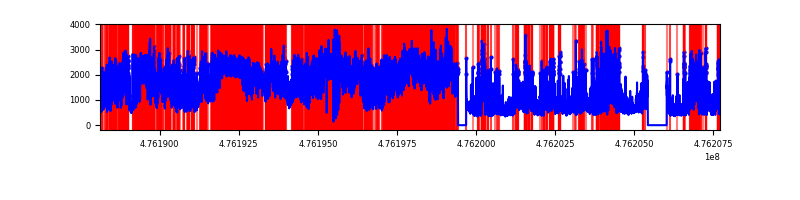 |
Top three noisy pixels from each quadrant. If the there are fewer than three noisy pixels in the level2.evt file, extra rows are filled as -1
| Pixel properties | Quadrant properties | ||||||
|---|---|---|---|---|---|---|---|
| Quadrant | DetID | PixID | Counts | Sigma | Mean | Median | Sigma |
| A | 12 | 80 | 1068370 | 2205.78 | 1972 | 1922 | 483.5 |
| A | 12 | 250 | 926643 | 1912.64 | 1972 | 1922 | 483.5 |
| A | 4 | 3 | 730484 | 1506.92 | 1972 | 1922 | 483.5 |
| B | 4 | 170 | 4373435 | 10614.13 | 1941 | 1873 | 411.9 |
| B | 0 | 229 | 899207 | 2178.72 | 1941 | 1873 | 411.9 |
| B | 5 | 185 | 416384 | 1006.43 | 1941 | 1873 | 411.9 |
| C | 15 | 214 | 9462297 | 26127.39 | 1288 | 1280 | 362.1 |
| C | 15 | 196 | 4405180 | 12161.74 | 1288 | 1280 | 362.1 |
| C | 15 | 195 | 1932597 | 5333.49 | 1288 | 1280 | 362.1 |
| D | 7 | 61 | 9063370 | 18652.99 | 1727 | 1662 | 485.8 |
| D | 7 | 60 | 2487646 | 5117.25 | 1727 | 1662 | 485.8 |
| D | 8 | 246 | 1433039 | 2946.41 | 1727 | 1662 | 485.8 |
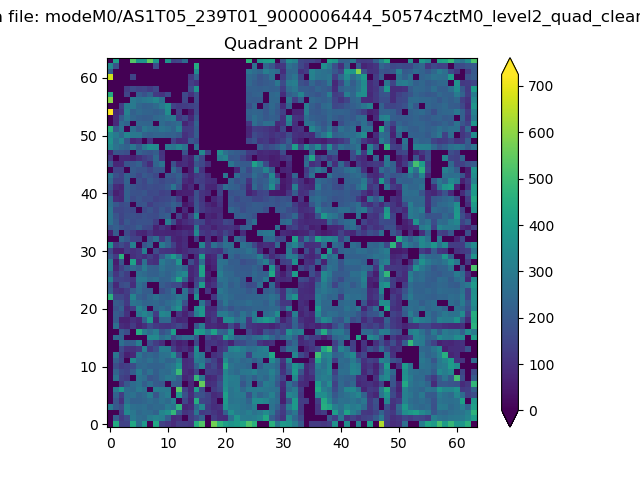
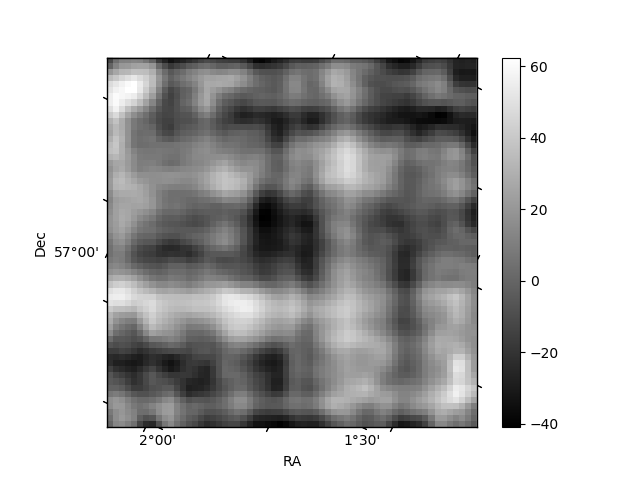
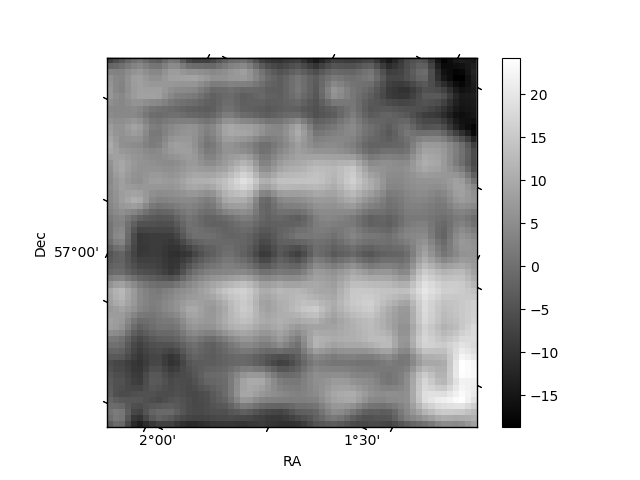
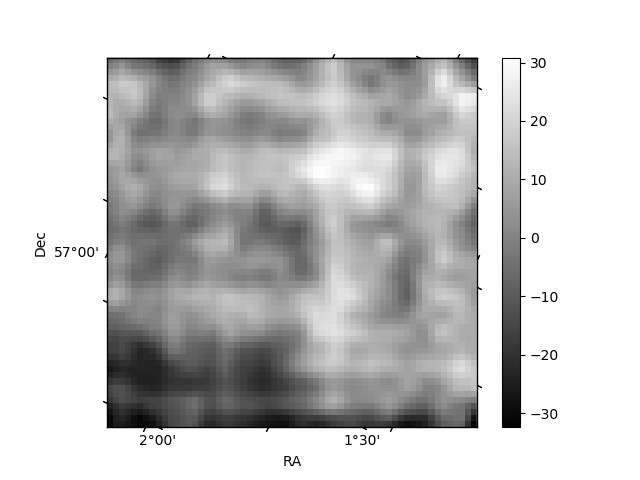
Histogram calculated using DETX and DETY for each event in the final _common_clean file
| Quadrant A | 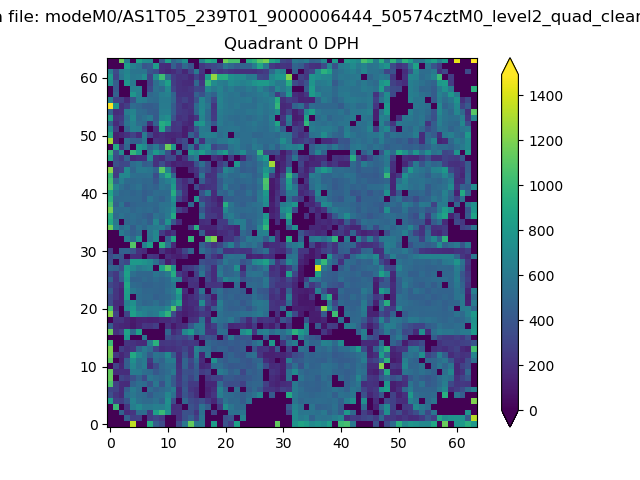 |
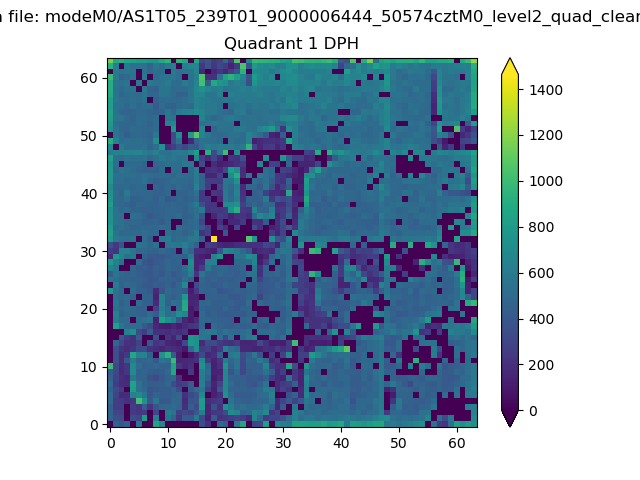 |
Quadrant B |
|---|---|---|---|
| Quadrant D | 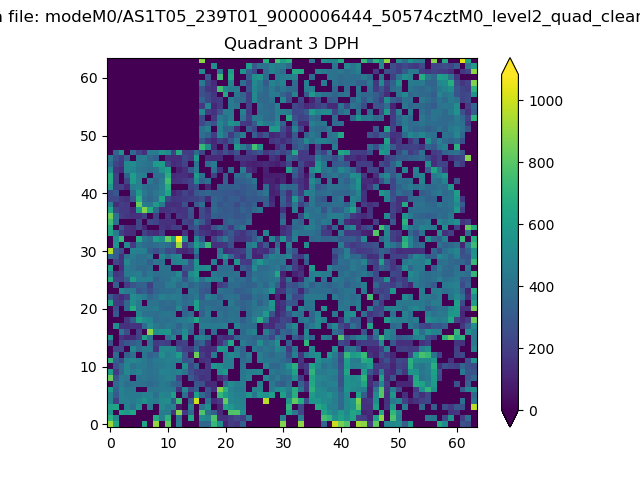 |
 |
Quadrant C |
| Plot type | Count rate plots | Images |
|---|---|---|
| Comparison with Poisson distribution Blue bars denote a histogram of data divided into 1 sec bins. Red curve is a Poisson curve with rate = median count rate of data. |
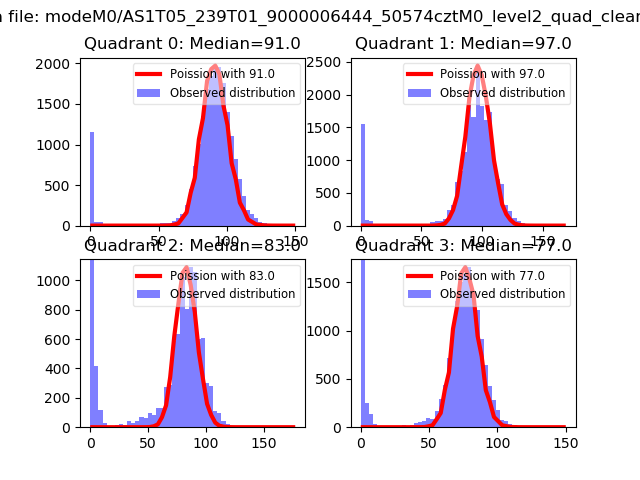 |
 |
| Quadrant-wise count rates Data is divided into 100 sec bins |
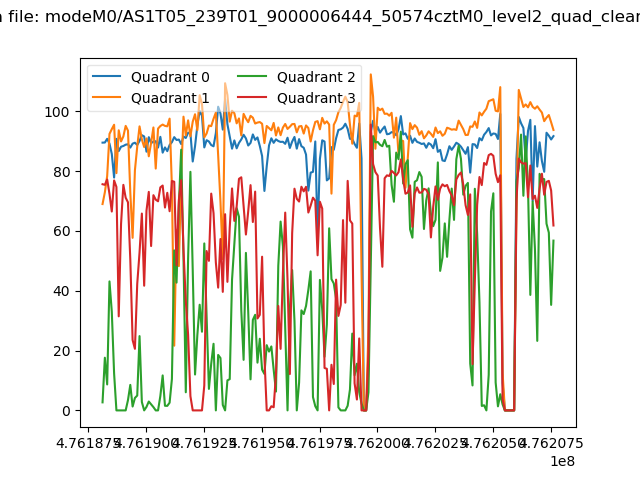 |
|
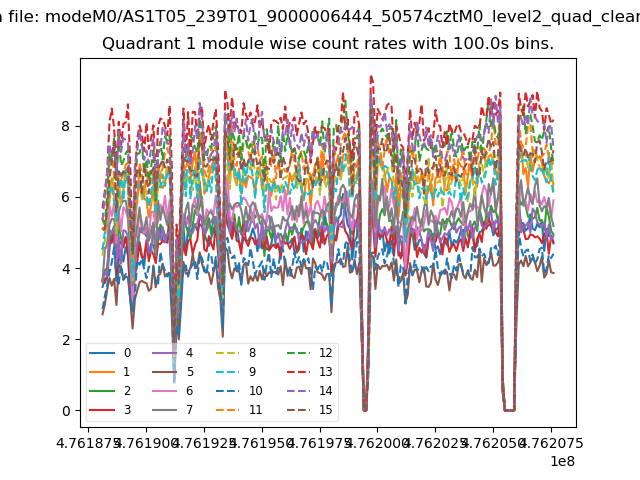
| Module-wise count rates for Quadrant A Data is divided into 100 sec bins |
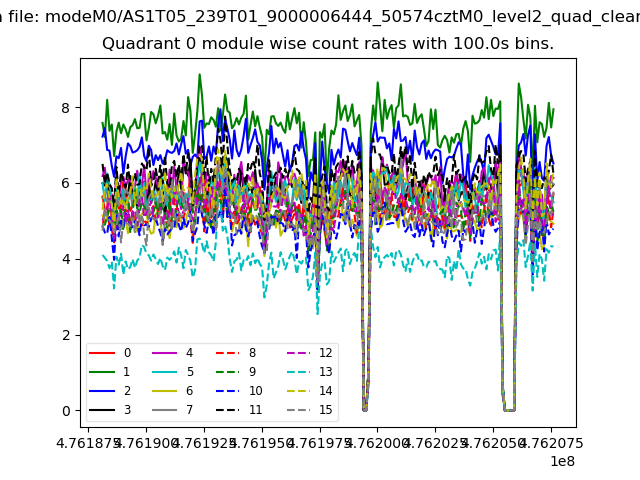 |
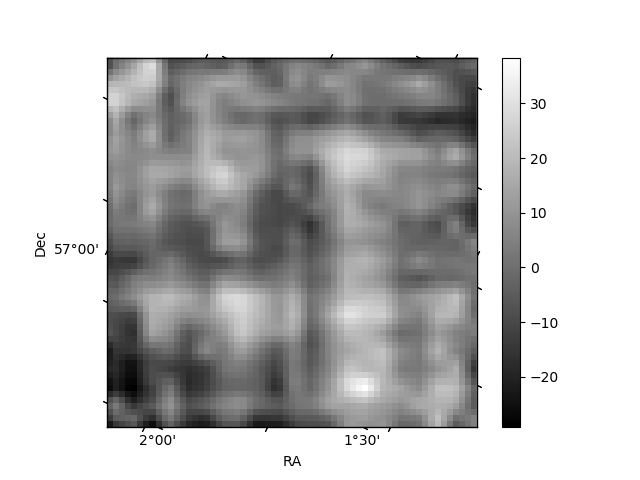 |
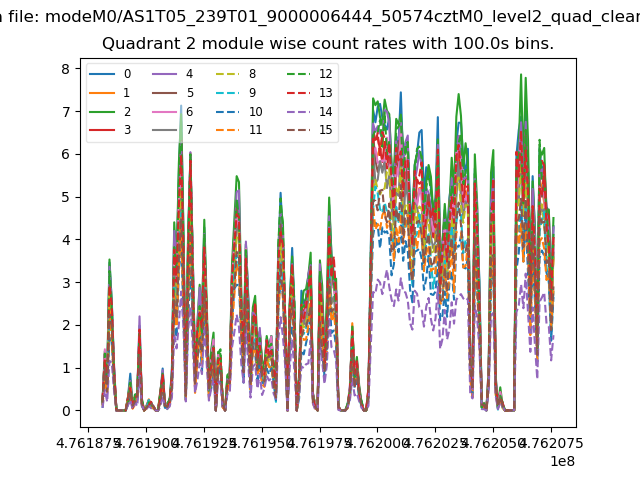
| Module-wise count rates for Quadrant B Data is divided into 100 sec bins |
 |
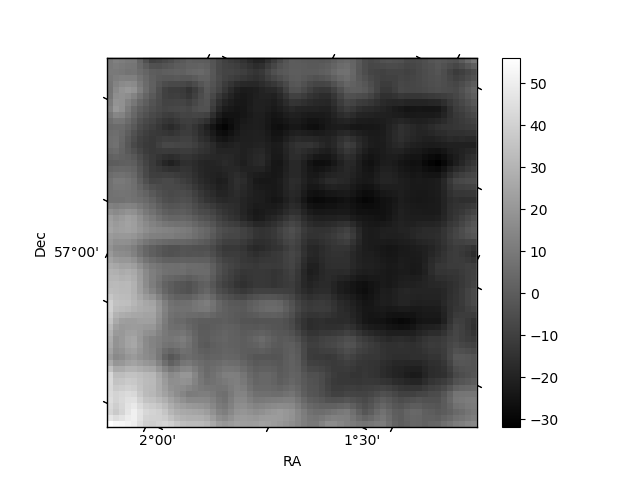 |
| Module-wise count rates for Quadrant C Data is divided into 100 sec bins |
 |
 |
| Module-wise count rates for Quadrant D Data is divided into 100 sec bins |
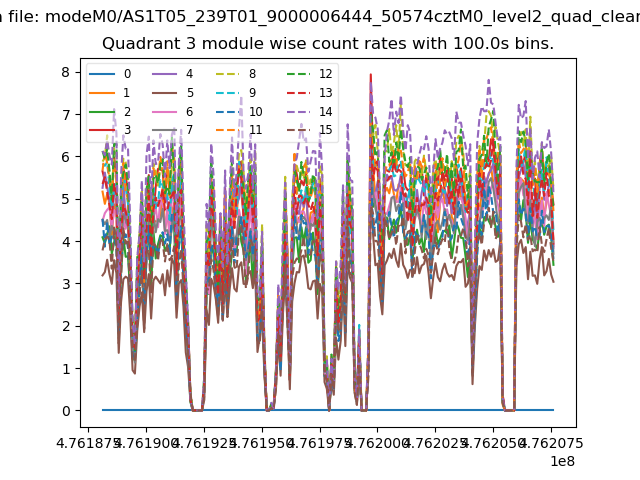 |
 |
| Parameter | Plot |
|---|---|
| CZT HV Monitor | 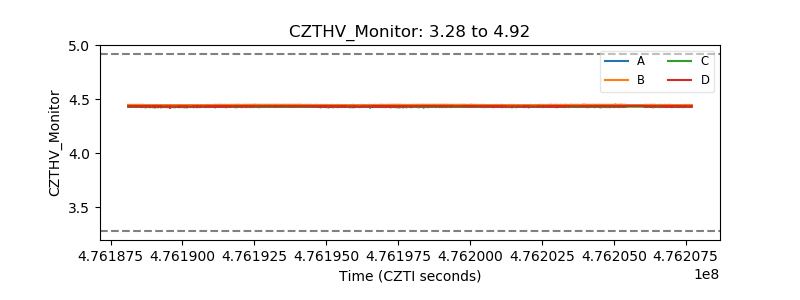 |
| D_VDD | 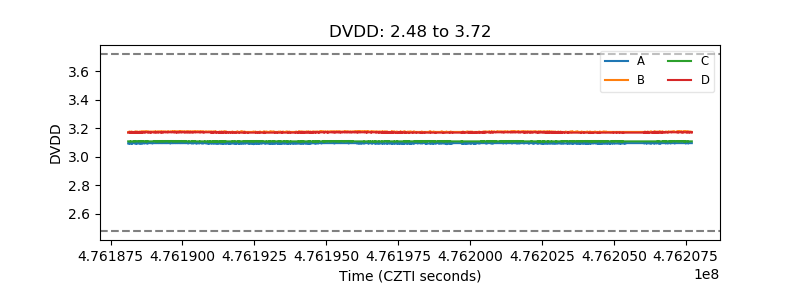 |
| Temperature 1 | 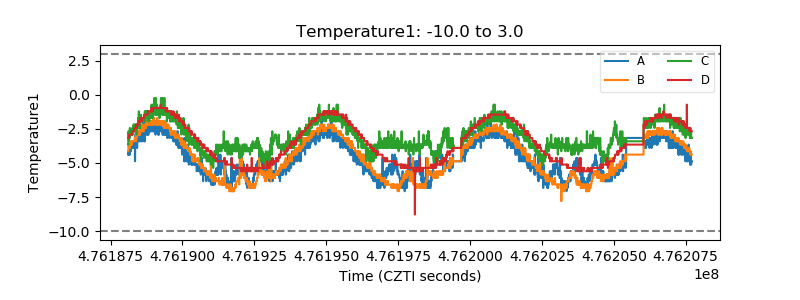 |
| Veto HV Monitor | 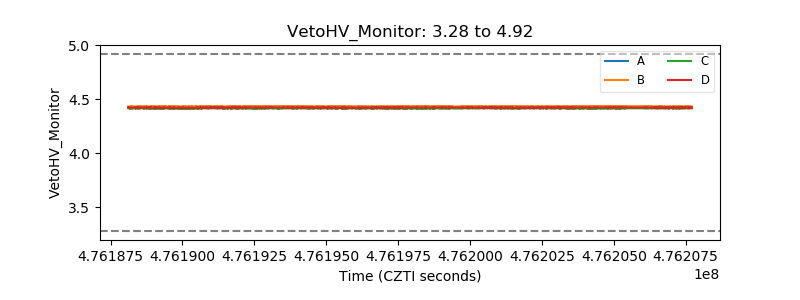 |
| Veto LLD |  |
| Alpha Counter | 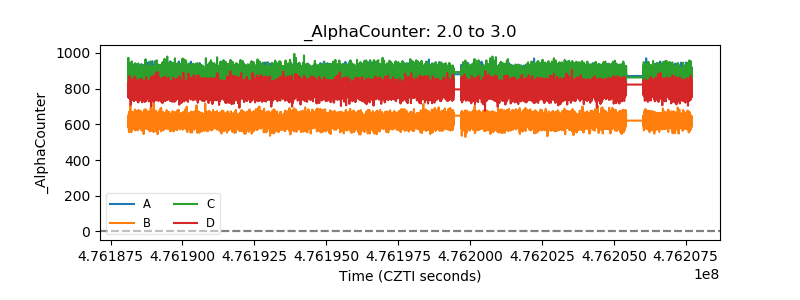 |
| _CPM_Rate | 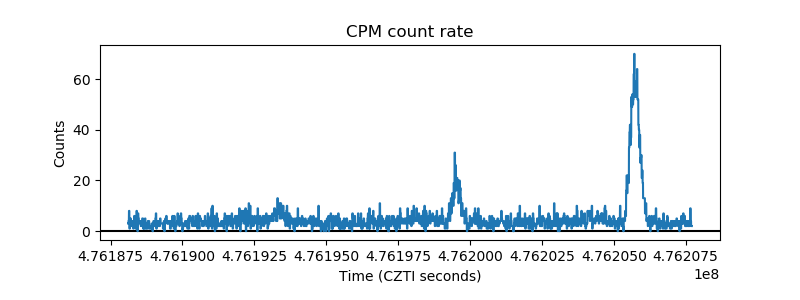 |
| CZT Counter | 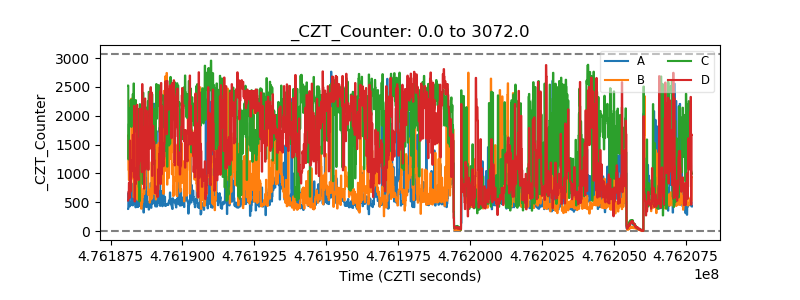 |
| +2.5 Volts monitor | 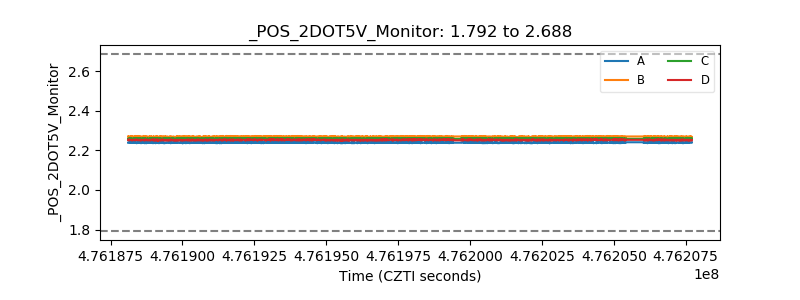 |
| +5 Volts monitor |  |
| _ROLL_ROT | 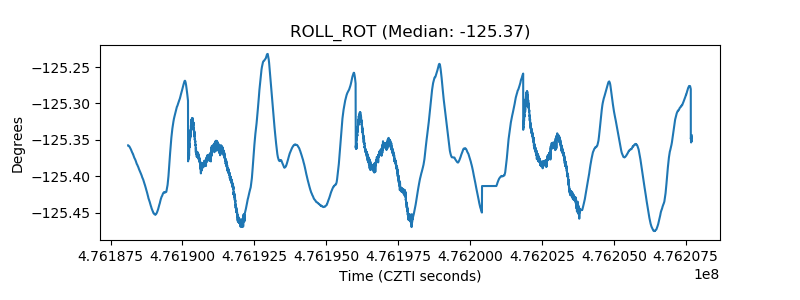 |
| _Roll_DEC | 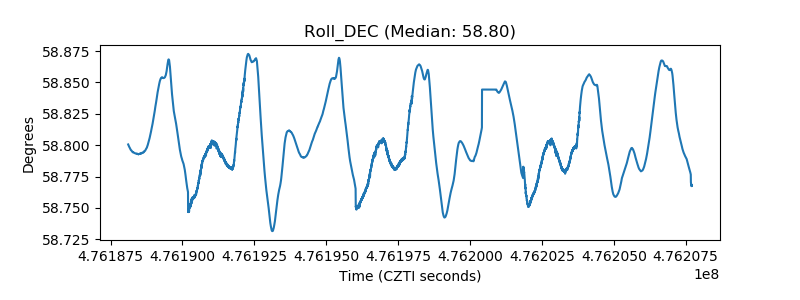 |
| _Roll_RA | 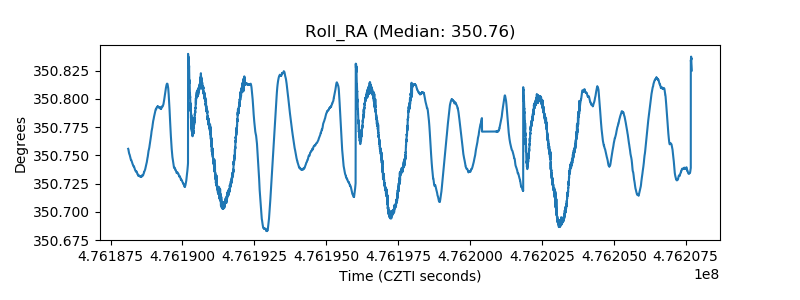 |
| Veto Counter | 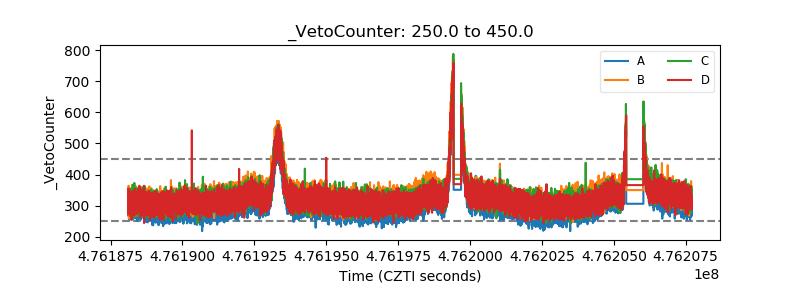 |