| Param | Original file | Final file |
|---|---|---|
| Filename | modeM0/AS1T05_239T01_9000006444_50575cztM0_level2.fits | modeM0/AS1T05_239T01_9000006444_50575cztM0_level2_quad_clean.evt |
| Size (bytes) | 543,107,520 | 84,124,800 |
| Size | 517.9 MB | 80.2 MB |
| Events in quadrant A | 3,550,158 | 566,636 |
| Events in quadrant B | 4,096,465 | 608,013 |
| Events in quadrant C | 7,132,262 | 445,001 |
| Events in quadrant D | 4,845,744 | 496,418 |
| Mode M0 | |||
|---|---|---|---|
| Quadrant | BADHDUFLAG | Total packets | Discarded packets |
| A | 0 | 14762 | 1 |
| B | 0 | 16595 | 1 |
| C | 0 | 25453 | 1 |
| D | 0 | 18647 | 1 |
| Mode M9 | |||
|---|---|---|---|
| Quadrant | BADHDUFLAG | Total packets | Discarded packets |
| A | 0 | 9 | 0 |
| B | 0 | 9 | 0 |
| C | 0 | 9 | 0 |
| D | 0 | 9 | 0 |
| Mode SS | |||
|---|---|---|---|
| Quadrant | BADHDUFLAG | Total packets | Discarded packets |
| A | 0 | 124 | 0 |
| B | 0 | 124 | 0 |
| C | 0 | 124 | 0 |
| D | 0 | 124 | 0 |
| Quadrant | Total seconds | Saturated seconds | Saturation percentage |
|---|---|---|---|
| A | 6177 | 165 | 2.671200% |
| B | 6177 | 223 | 3.610167% |
| C | 6178 | 1396 | 22.596309% |
| D | 6177 | 350 | 5.666181% |
Noise dominated data is calculated using 1-second bins in cleaned event files. If a bin has >2000 counts, and if more than 50% of those come from <1% of pixels, then it is considered to be noise-dominated and hence unusable.
| Quadrant | # 1 sec bins | Bins with >0 counts | Bins with >2000 counts | High rate bins dominated by noise | Noise dominated (total time) | Noise dominated (detector-on time) | Marked lightcurve |
|---|---|---|---|---|---|---|---|
| A | 6997 | 6178 | 142 | 142 | 2.03% | 2.30% | 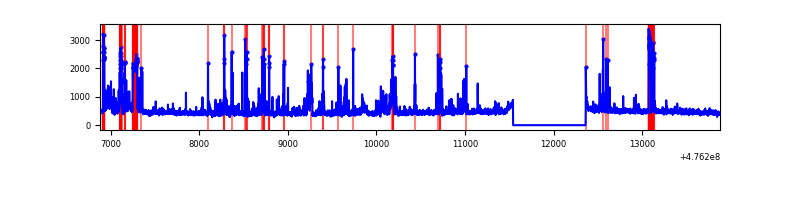 |
| B | 6997 | 6178 | 135 | 135 | 1.93% | 2.19% | 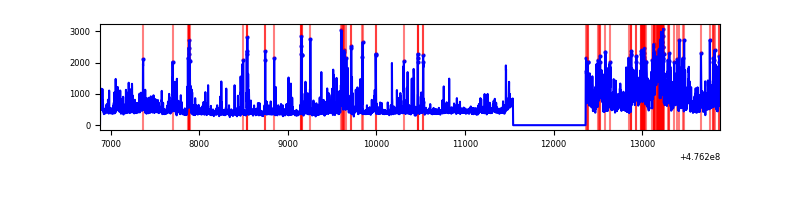 |
| C | 6998 | 6178 | 1047 | 1047 | 14.96% | 16.95% | 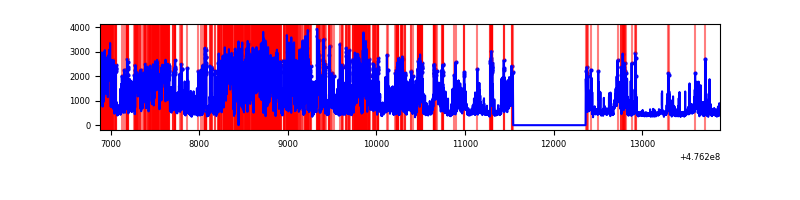 |
| D | 6997 | 6178 | 319 | 319 | 4.56% | 5.16% | 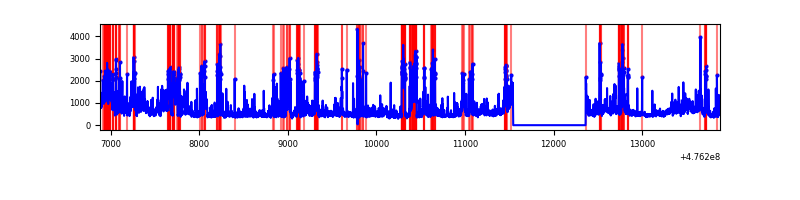 |
Top three noisy pixels from each quadrant. If the there are fewer than three noisy pixels in the level2.evt file, extra rows are filled as -1
| Pixel properties | Quadrant properties | ||||||
|---|---|---|---|---|---|---|---|
| Quadrant | DetID | PixID | Counts | Sigma | Mean | Median | Sigma |
| A | 12 | 250 | 204474 | 1261.27 | 640 | 623 | 161.6 |
| A | 12 | 80 | 188997 | 1165.51 | 640 | 623 | 161.6 |
| A | 8 | 38 | 159462 | 982.77 | 640 | 623 | 161.6 |
| B | 4 | 170 | 649869 | 4753.26 | 636 | 613 | 136.6 |
| B | 0 | 229 | 273357 | 1996.78 | 636 | 613 | 136.6 |
| B | 5 | 185 | 94092 | 684.37 | 636 | 613 | 136.6 |
| C | 15 | 214 | 1757904 | 11348.56 | 563 | 558 | 154.9 |
| C | 15 | 196 | 1013774 | 6543.13 | 563 | 558 | 154.9 |
| C | 15 | 195 | 349710 | 2254.75 | 563 | 558 | 154.9 |
| D | 8 | 246 | 775485 | 4511.43 | 612 | 590 | 171.8 |
| D | 7 | 96 | 267385 | 1553.28 | 612 | 590 | 171.8 |
| D | 8 | 48 | 206795 | 1200.52 | 612 | 590 | 171.8 |
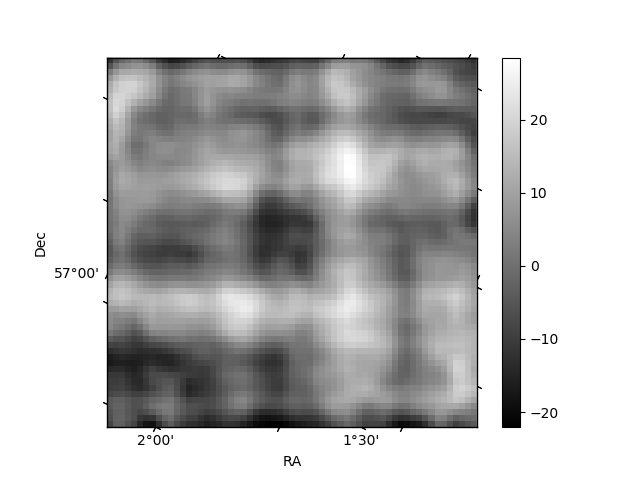
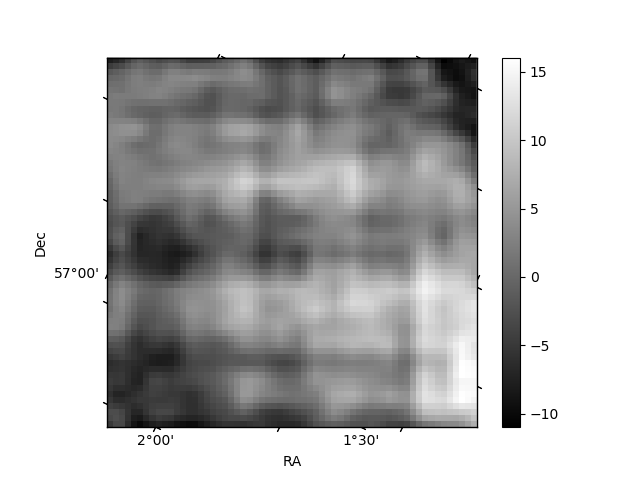
Histogram calculated using DETX and DETY for each event in the final _common_clean file
| Quadrant A | 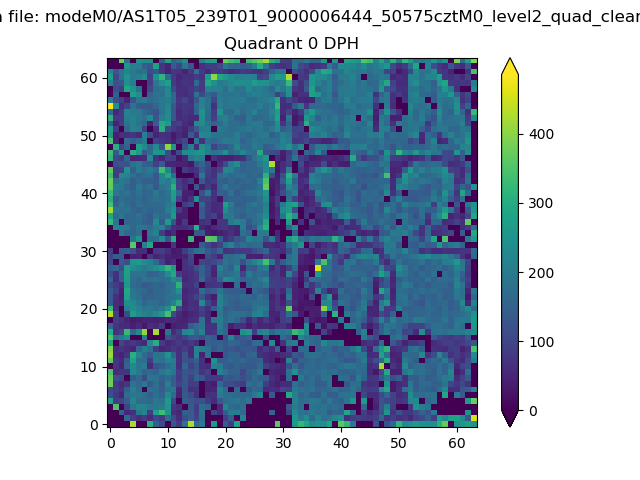 |
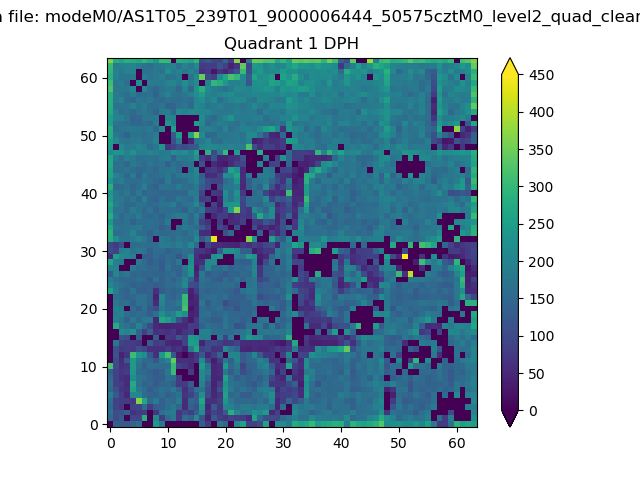 |
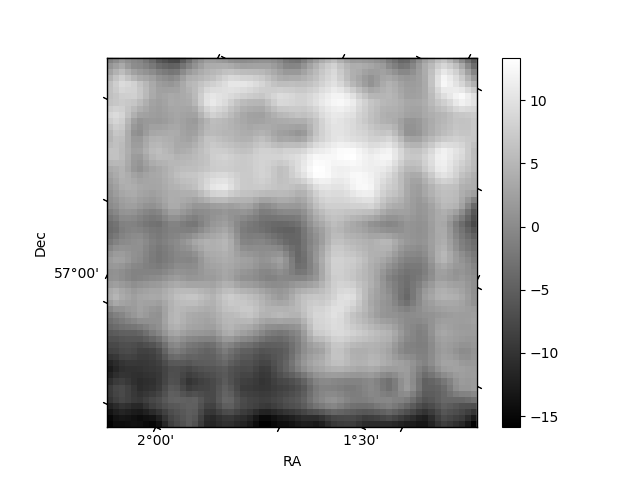
Quadrant B |
|---|---|---|---|
| Quadrant D | 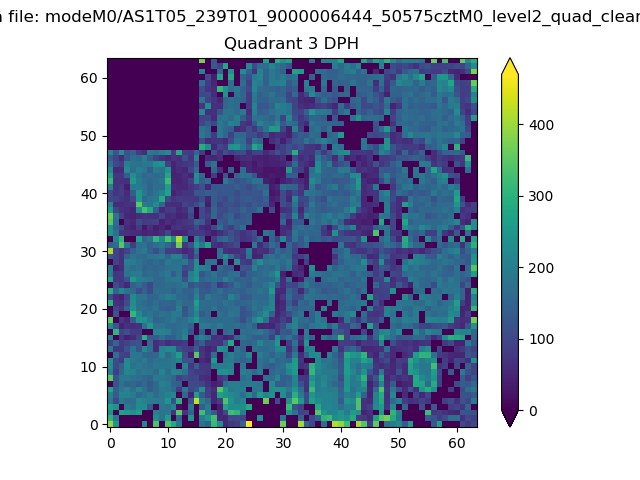 |
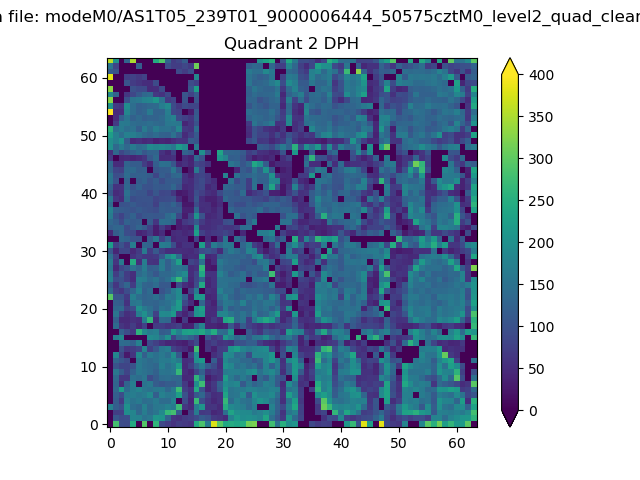 |
Quadrant C |
| Plot type | Count rate plots | Images |
|---|---|---|
| Comparison with Poisson distribution Blue bars denote a histogram of data divided into 1 sec bins. Red curve is a Poisson curve with rate = median count rate of data. |
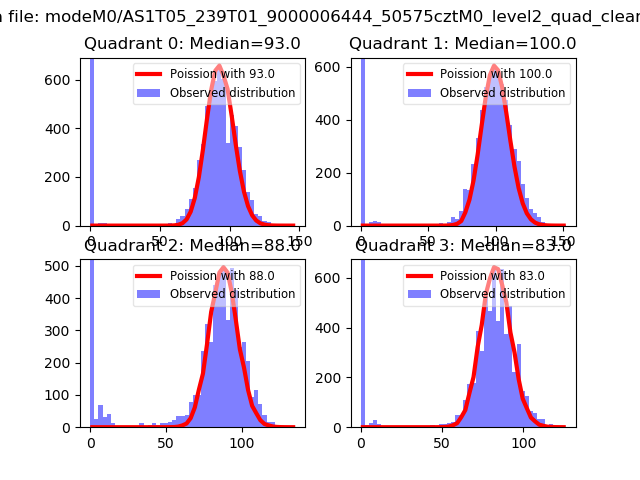 |
 |
| Quadrant-wise count rates Data is divided into 100 sec bins |
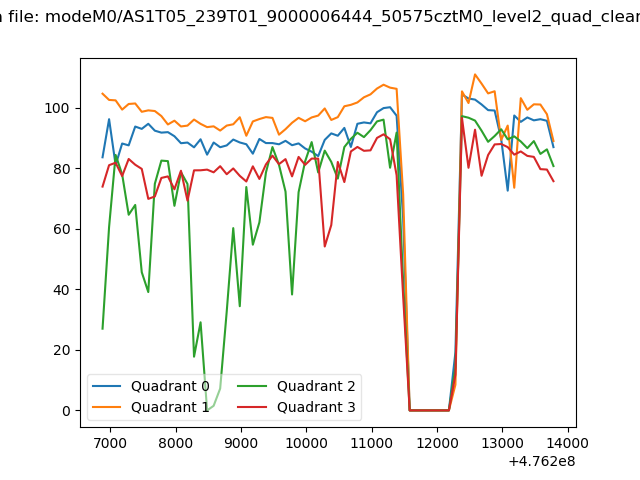 |
|
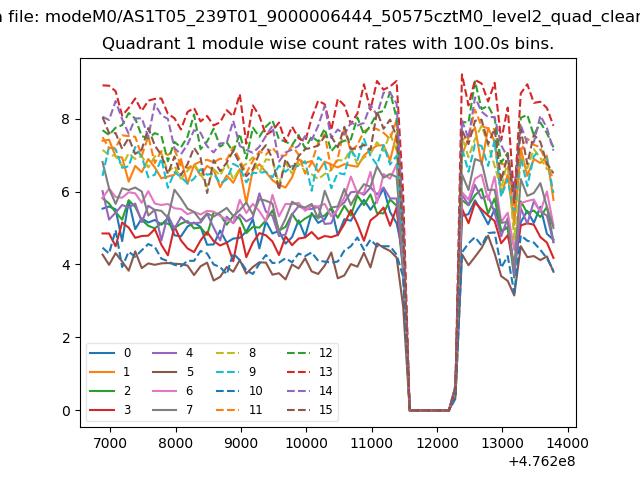
| Module-wise count rates for Quadrant A Data is divided into 100 sec bins |
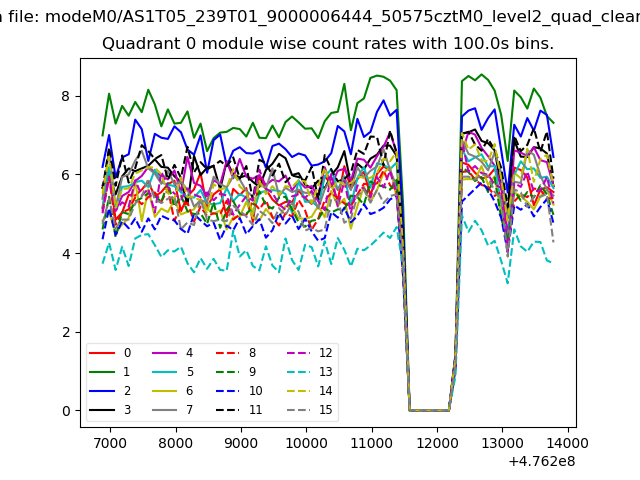 |
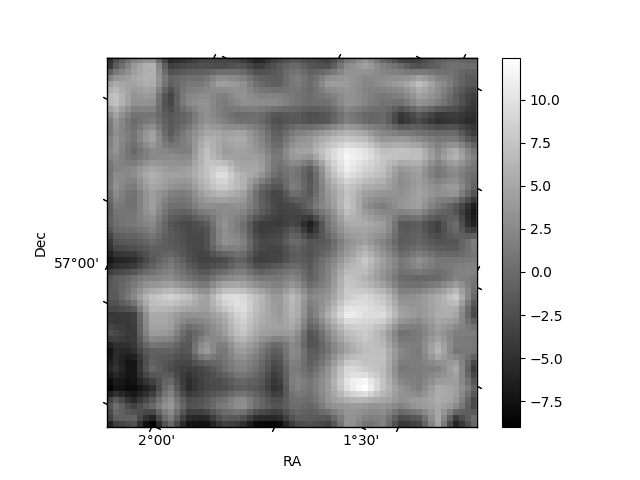 |
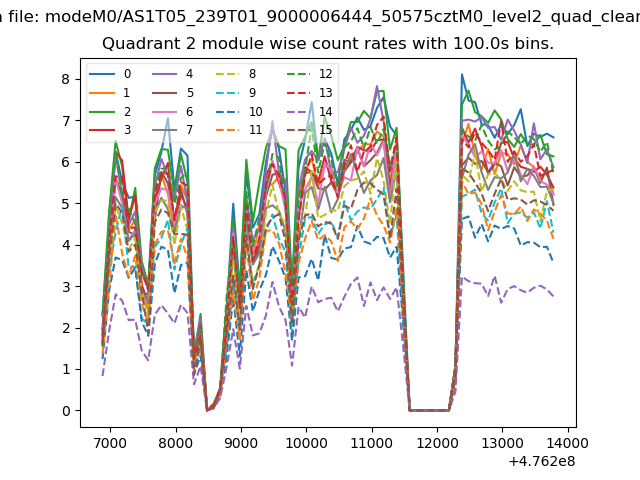
| Module-wise count rates for Quadrant B Data is divided into 100 sec bins |
 |
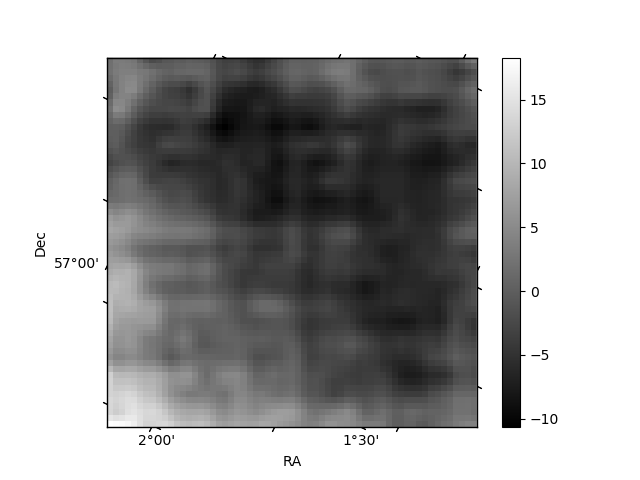 |
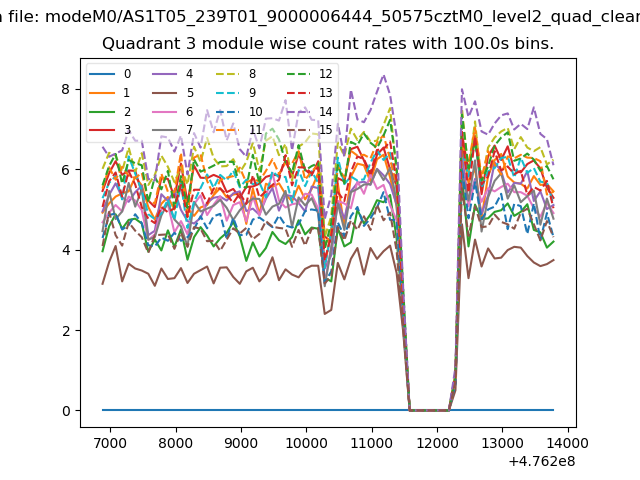
| Module-wise count rates for Quadrant C Data is divided into 100 sec bins |
 |
 |
| Module-wise count rates for Quadrant D Data is divided into 100 sec bins |
 |
 |
| Parameter | Plot |
|---|---|
| CZT HV Monitor | 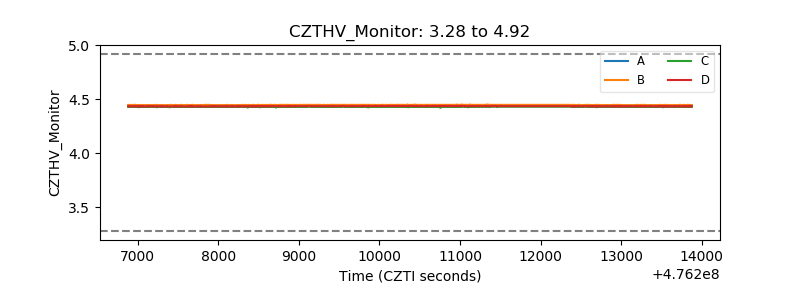 |
| D_VDD | 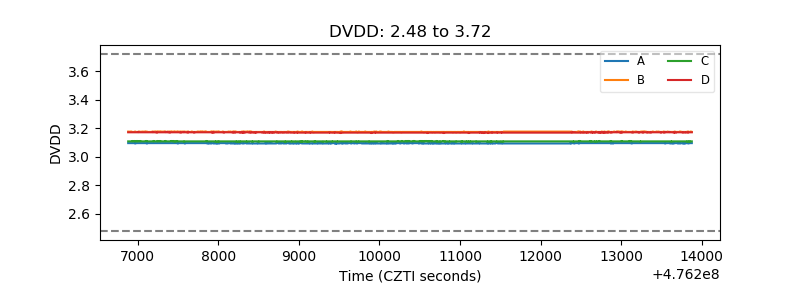 |
| Temperature 1 | 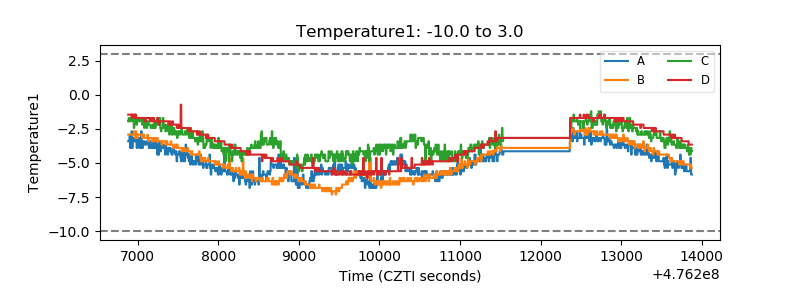 |
| Veto HV Monitor | 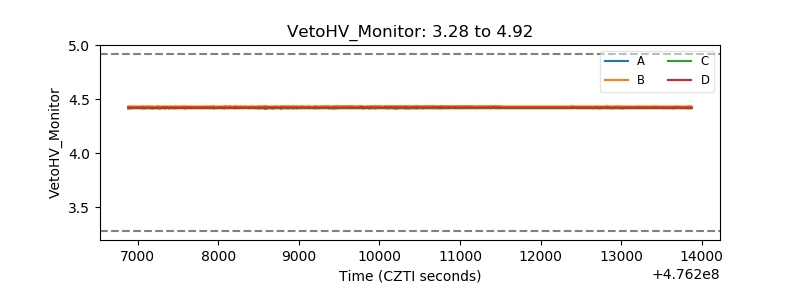 |
| Veto LLD | 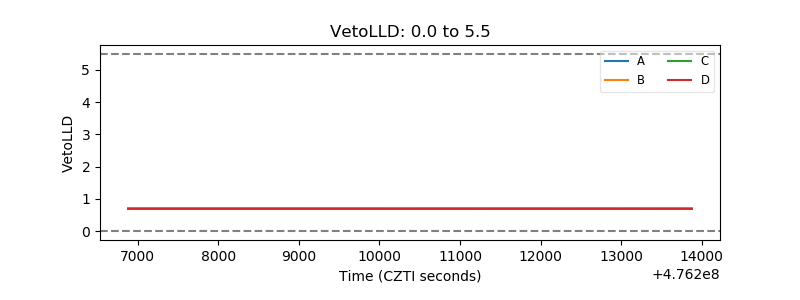 |
| Alpha Counter | 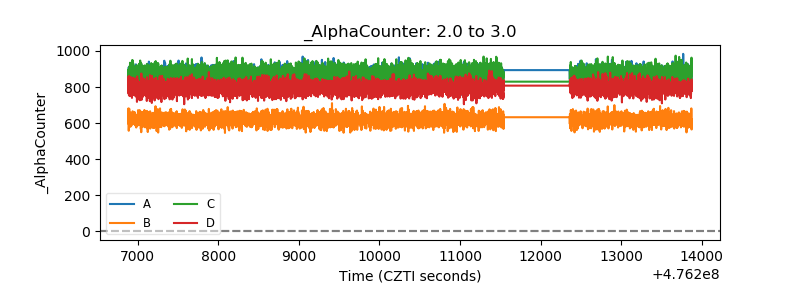 |
| _CPM_Rate | 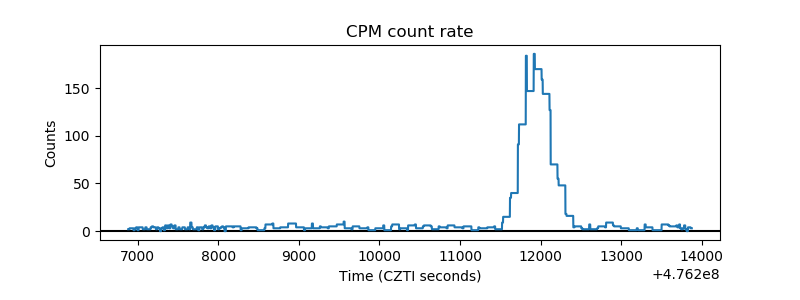 |
| CZT Counter | 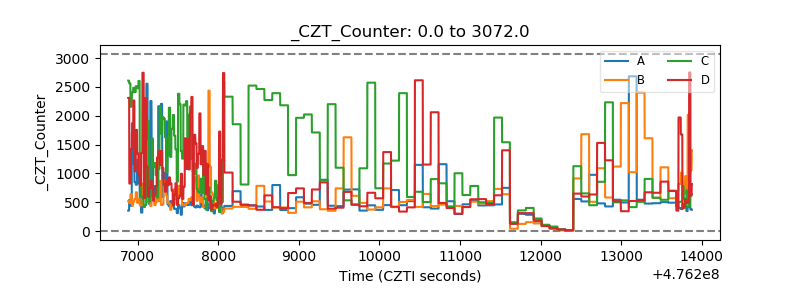 |
| +2.5 Volts monitor | 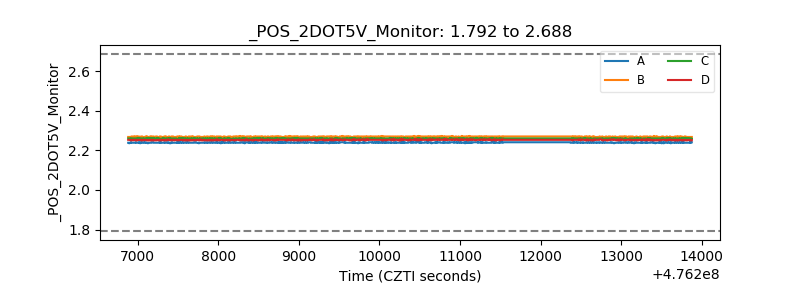 |
| +5 Volts monitor |  |
| _ROLL_ROT | 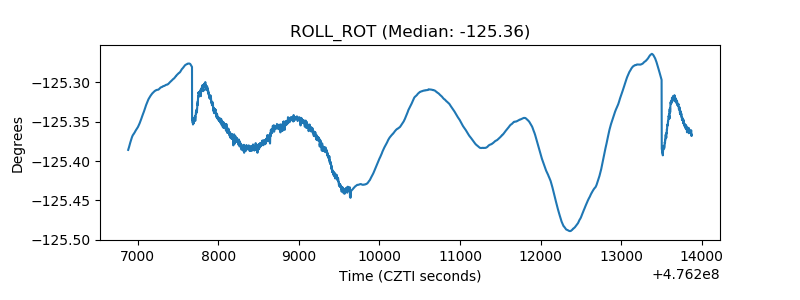 |
| _Roll_DEC | 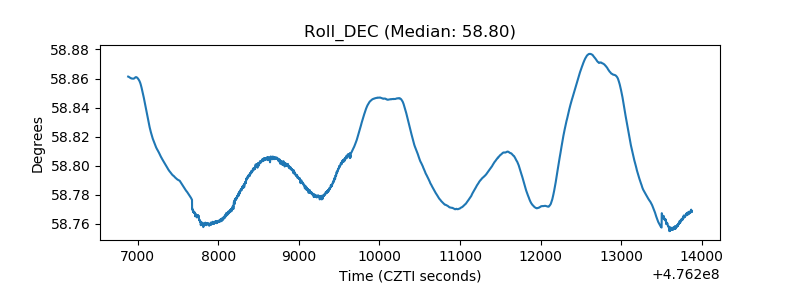 |
| _Roll_RA | 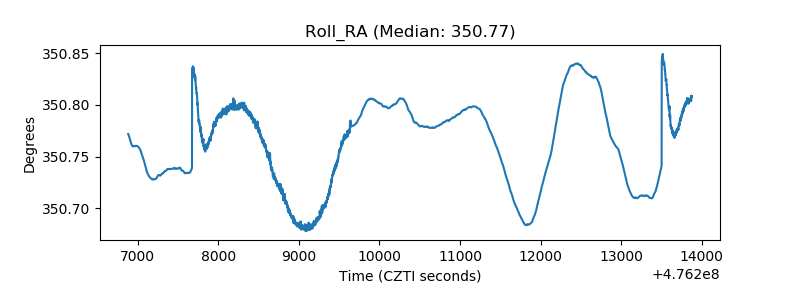 |
| Veto Counter | 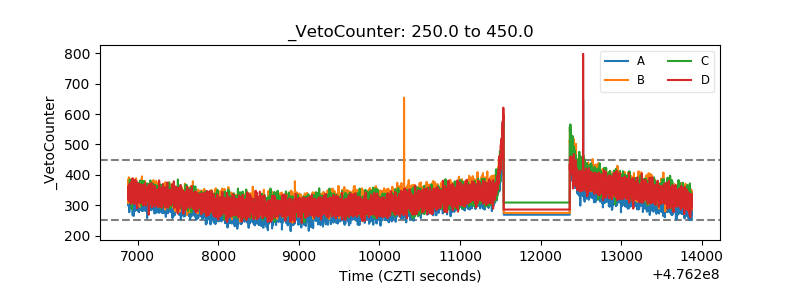 |