| Param | Original file | Final file |
|---|---|---|
| Filename | modeM0/AS1T05_239T01_9000006444_50576cztM0_level2.fits | modeM0/AS1T05_239T01_9000006444_50576cztM0_level2_quad_clean.evt |
| Size (bytes) | 550,324,800 | 87,750,720 |
| Size | 524.8 MB | 83.7 MB |
| Events in quadrant A | 3,599,290 | 583,612 |
| Events in quadrant B | 6,682,832 | 574,205 |
| Events in quadrant C | 5,274,955 | 539,405 |
| Events in quadrant D | 4,326,777 | 520,498 |
| Mode M0 | |||
|---|---|---|---|
| Quadrant | BADHDUFLAG | Total packets | Discarded packets |
| A | 0 | 15069 | 1 |
| B | 0 | 24228 | 1 |
| C | 0 | 19978 | 1 |
| D | 0 | 17388 | 1 |
| Mode M9 | |||
|---|---|---|---|
| Quadrant | BADHDUFLAG | Total packets | Discarded packets |
| A | 0 | 10 | 0 |
| B | 0 | 10 | 0 |
| C | 0 | 10 | 0 |
| D | 0 | 10 | 0 |
| Mode SS | |||
|---|---|---|---|
| Quadrant | BADHDUFLAG | Total packets | Discarded packets |
| A | 0 | 128 | 0 |
| B | 0 | 128 | 0 |
| C | 0 | 128 | 0 |
| D | 0 | 128 | 0 |
| Quadrant | Total seconds | Saturated seconds | Saturation percentage |
|---|---|---|---|
| A | 6288 | 165 | 2.624046% |
| B | 6289 | 820 | 13.038639% |
| C | 6289 | 466 | 7.409763% |
| D | 6289 | 248 | 3.943393% |
Noise dominated data is calculated using 1-second bins in cleaned event files. If a bin has >2000 counts, and if more than 50% of those come from <1% of pixels, then it is considered to be noise-dominated and hence unusable.
| Quadrant | # 1 sec bins | Bins with >0 counts | Bins with >2000 counts | High rate bins dominated by noise | Noise dominated (total time) | Noise dominated (detector-on time) | Marked lightcurve |
|---|---|---|---|---|---|---|---|
| A | 7288 | 6289 | 140 | 140 | 1.92% | 2.23% | 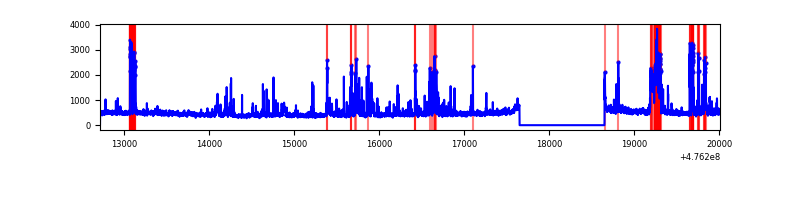 |
| B | 7289 | 6290 | 651 | 651 | 8.93% | 10.35% | 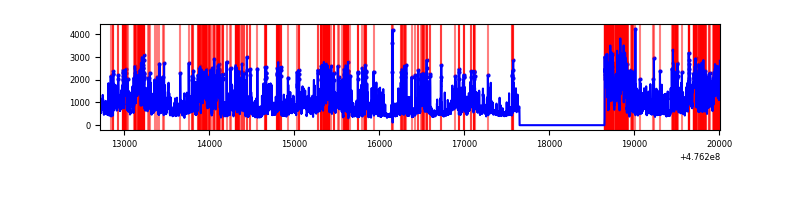 |
| C | 7289 | 6290 | 399 | 399 | 5.47% | 6.34% | 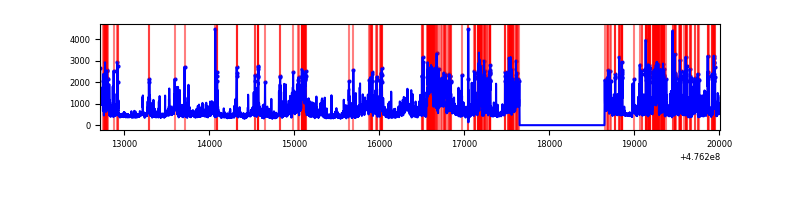 |
| D | 7289 | 6290 | 244 | 244 | 3.35% | 3.88% | 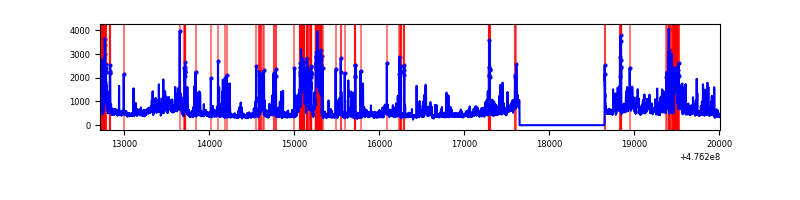 |
Top three noisy pixels from each quadrant. If the there are fewer than three noisy pixels in the level2.evt file, extra rows are filled as -1
| Pixel properties | Quadrant properties | ||||||
|---|---|---|---|---|---|---|---|
| Quadrant | DetID | PixID | Counts | Sigma | Mean | Median | Sigma |
| A | 4 | 249 | 275577 | 1705.29 | 650 | 633 | 161.2 |
| A | 8 | 38 | 219800 | 1359.35 | 650 | 633 | 161.2 |
| A | 12 | 250 | 154770 | 956.01 | 650 | 633 | 161.2 |
| B | 4 | 170 | 2992154 | 22341.96 | 625 | 604 | 133.9 |
| B | 0 | 229 | 358536 | 2673.16 | 625 | 604 | 133.9 |
| B | 3 | 249 | 240382 | 1790.75 | 625 | 604 | 133.9 |
| C | 15 | 196 | 694036 | 4023.47 | 628 | 624 | 172.3 |
| C | 12 | 252 | 440962 | 2555.03 | 628 | 624 | 172.3 |
| C | 13 | 3 | 225987 | 1307.65 | 628 | 624 | 172.3 |
| D | 8 | 48 | 475830 | 2698.53 | 633 | 610 | 176.1 |
| D | 8 | 246 | 437480 | 2480.76 | 633 | 610 | 176.1 |
| D | 6 | 42 | 187345 | 1060.37 | 633 | 610 | 176.1 |
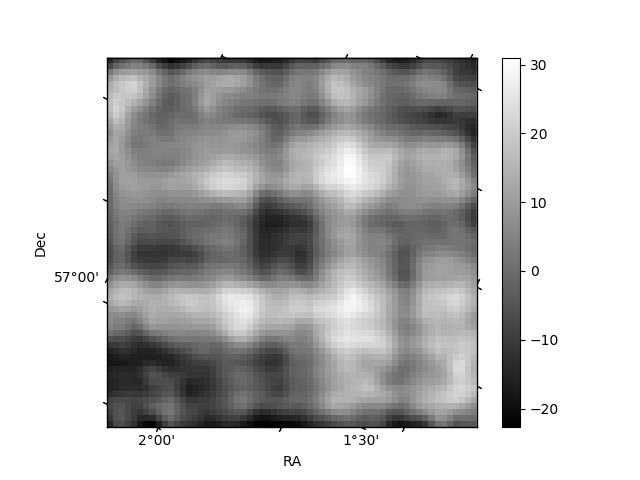
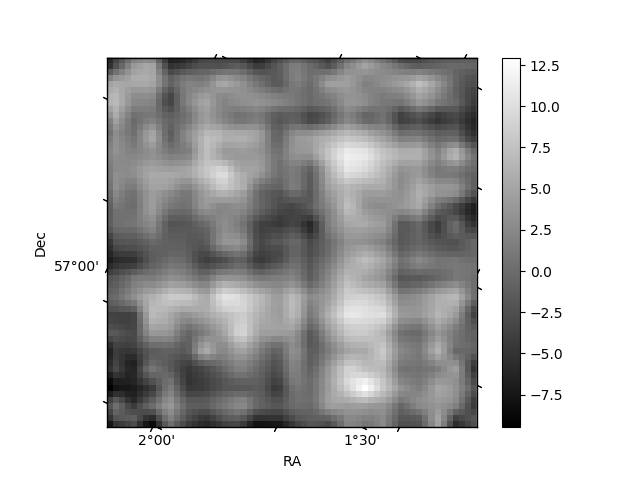
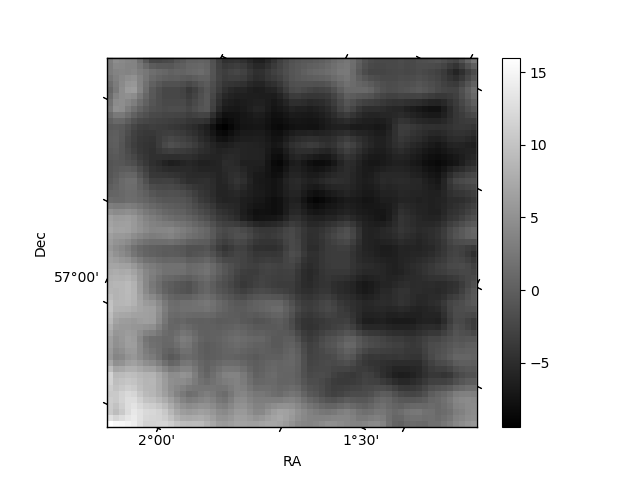
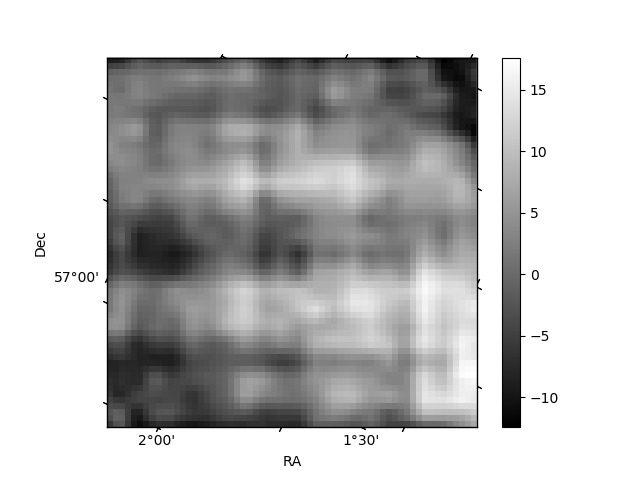
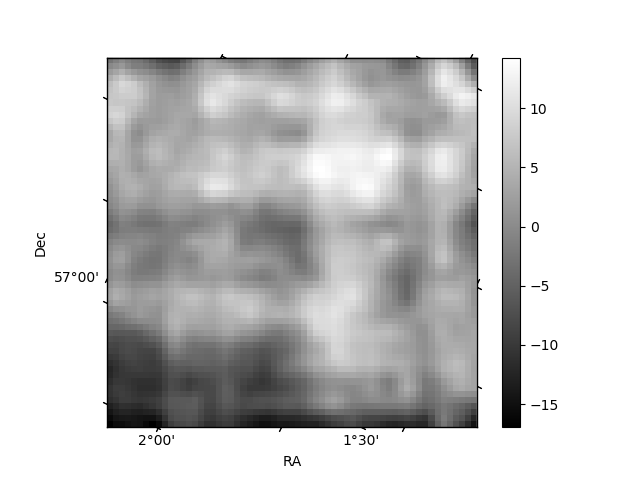
Histogram calculated using DETX and DETY for each event in the final _common_clean file
| Quadrant A | 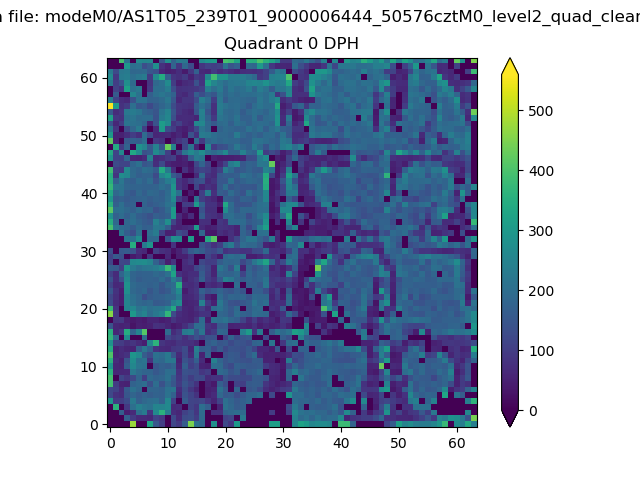 |
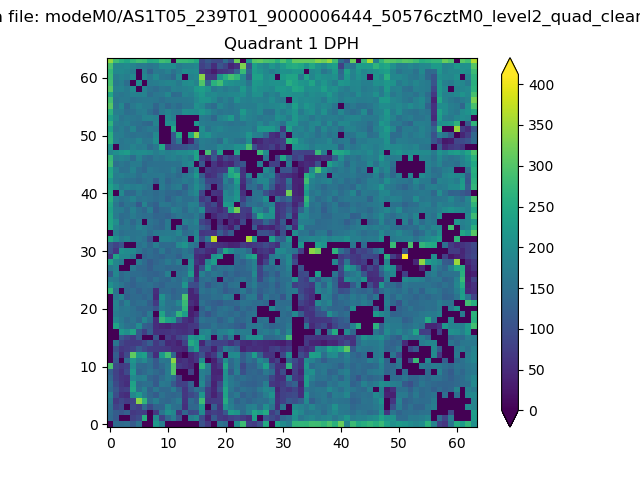 |
Quadrant B |
|---|---|---|---|
| Quadrant D | 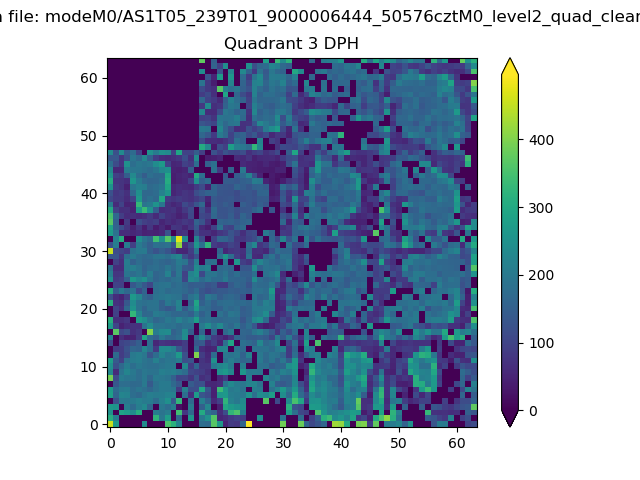 |
 |
Quadrant C |
| Plot type | Count rate plots | Images |
|---|---|---|
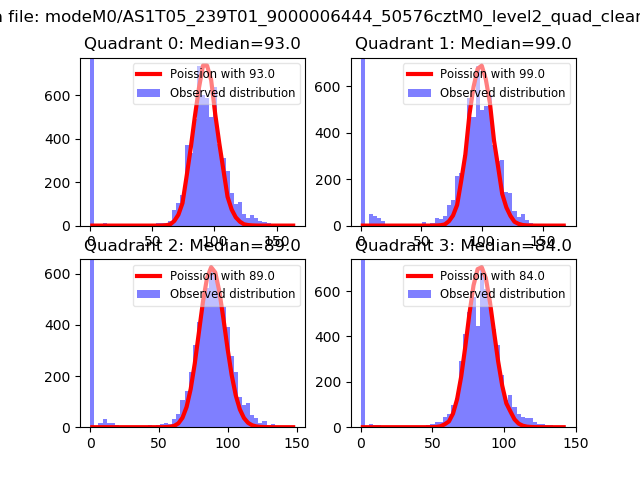
| Comparison with Poisson distribution Blue bars denote a histogram of data divided into 1 sec bins. Red curve is a Poisson curve with rate = median count rate of data. |
 |
 |
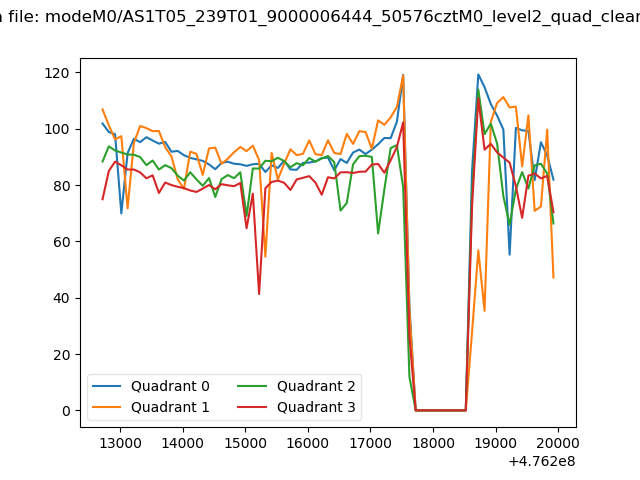
| Quadrant-wise count rates Data is divided into 100 sec bins |
 |
|
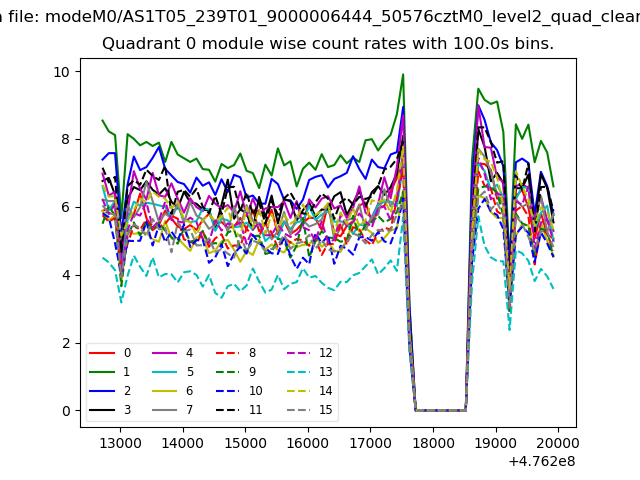
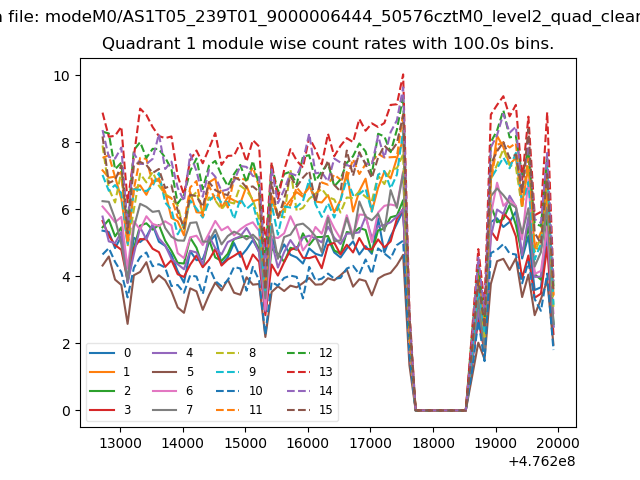
| Module-wise count rates for Quadrant A Data is divided into 100 sec bins |
 |
 |
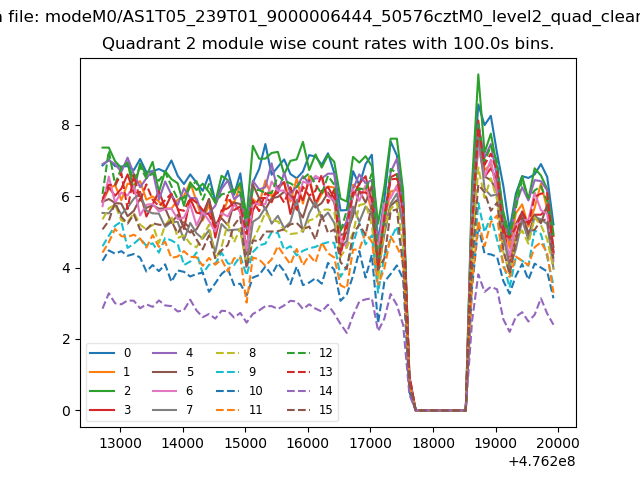
| Module-wise count rates for Quadrant B Data is divided into 100 sec bins |
 |
 |
| Module-wise count rates for Quadrant C Data is divided into 100 sec bins |
 |
 |
| Module-wise count rates for Quadrant D Data is divided into 100 sec bins |
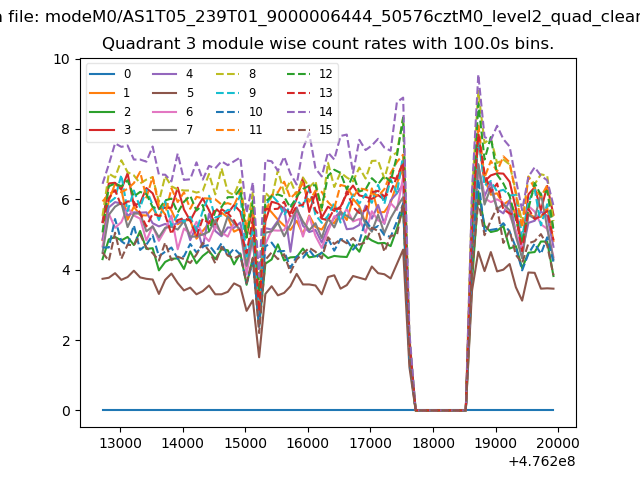 |
 |
| Parameter | Plot |
|---|---|
| CZT HV Monitor | 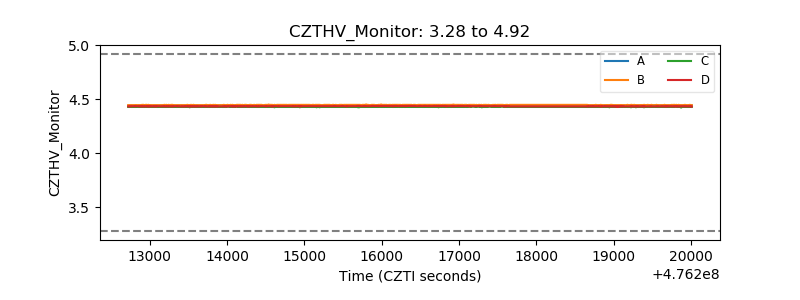 |
| D_VDD | 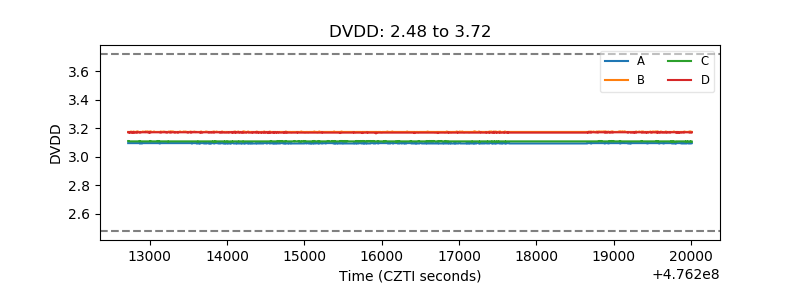 |
| Temperature 1 | 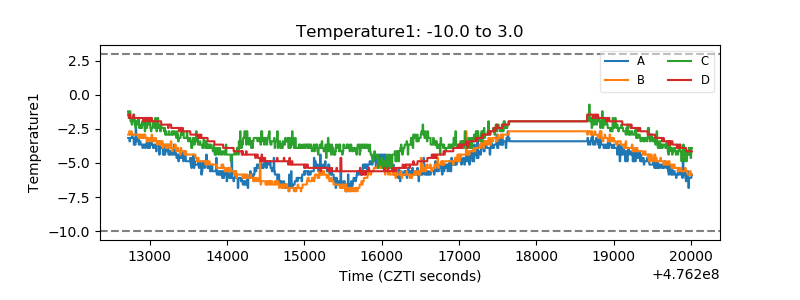 |
| Veto HV Monitor | 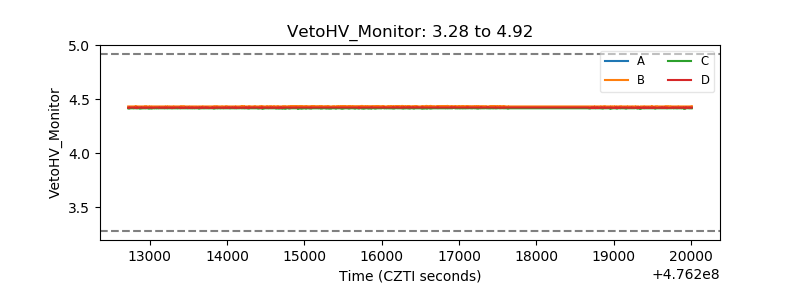 |
| Veto LLD | 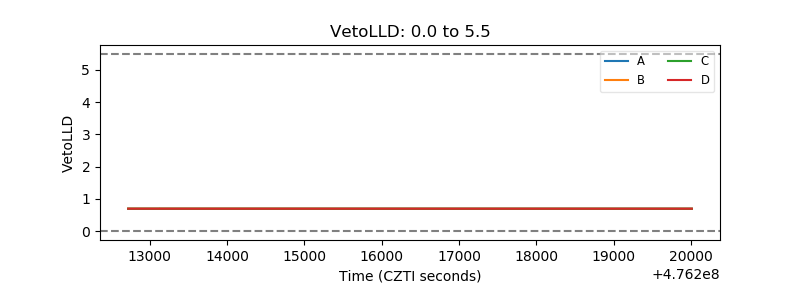 |
| Alpha Counter | 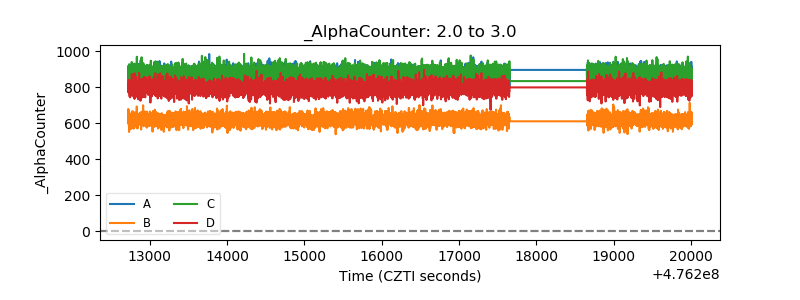 |
| _CPM_Rate | 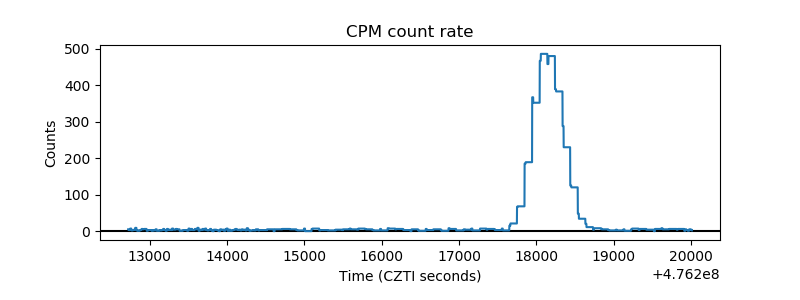 |
| CZT Counter | 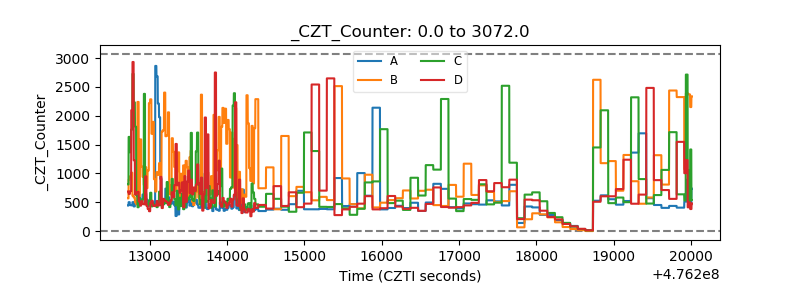 |
| +2.5 Volts monitor |  |
| +5 Volts monitor |  |
| _ROLL_ROT | 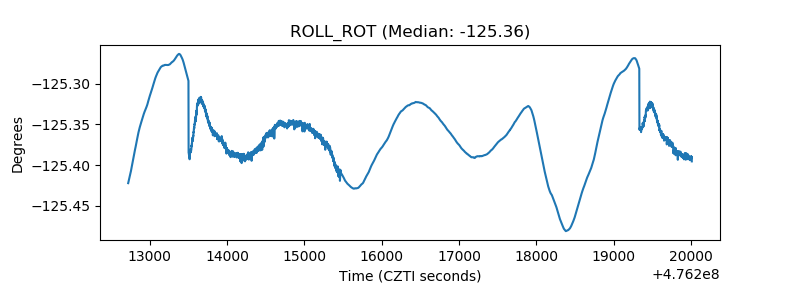 |
| _Roll_DEC | 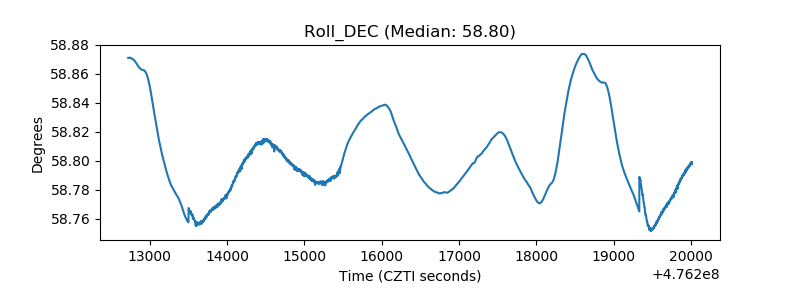 |
| _Roll_RA | 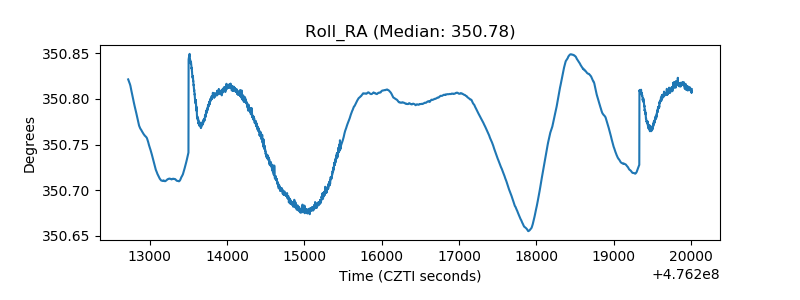 |
| Veto Counter | 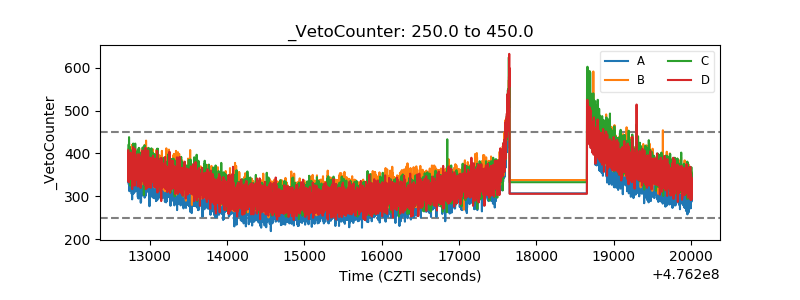 |