| Param | Original file | Final file |
|---|---|---|
| Filename | modeM0/AS1T05_239T01_9000006444_50578cztM0_level2.fits | modeM0/AS1T05_239T01_9000006444_50578cztM0_level2_quad_clean.evt |
| Size (bytes) | 697,973,760 | 83,995,200 |
| Size | 665.6 MB | 80.1 MB |
| Events in quadrant A | 4,052,256 | 594,883 |
| Events in quadrant B | 10,398,480 | 424,154 |
| Events in quadrant C | 6,273,102 | 532,160 |
| Events in quadrant D | 4,616,320 | 544,512 |
| Mode M0 | |||
|---|---|---|---|
| Quadrant | BADHDUFLAG | Total packets | Discarded packets |
| A | 0 | 16509 | 2 |
| B | 0 | 35346 | 5 |
| C | 0 | 22992 | 2 |
| D | 0 | 18234 | 2 |
| Mode M9 | |||
|---|---|---|---|
| Quadrant | BADHDUFLAG | Total packets | Discarded packets |
| A | 0 | 11 | 0 |
| B | 0 | 11 | 0 |
| C | 0 | 11 | 0 |
| D | 0 | 11 | 0 |
| Mode SS | |||
|---|---|---|---|
| Quadrant | BADHDUFLAG | Total packets | Discarded packets |
| A | 0 | 130 | 0 |
| B | 0 | 130 | 0 |
| C | 0 | 130 | 0 |
| D | 0 | 130 | 0 |
| Quadrant | Total seconds | Saturated seconds | Saturation percentage |
|---|---|---|---|
| A | 6413 | 292 | 4.553251% |
| B | 6412 | 2746 | 42.825951% |
| C | 6413 | 834 | 13.004834% |
| D | 6413 | 237 | 3.695618% |
Noise dominated data is calculated using 1-second bins in cleaned event files. If a bin has >2000 counts, and if more than 50% of those come from <1% of pixels, then it is considered to be noise-dominated and hence unusable.
| Quadrant | # 1 sec bins | Bins with >0 counts | Bins with >2000 counts | High rate bins dominated by noise | Noise dominated (total time) | Noise dominated (detector-on time) | Marked lightcurve |
|---|---|---|---|---|---|---|---|
| A | 7533 | 6414 | 259 | 259 | 3.44% | 4.04% | 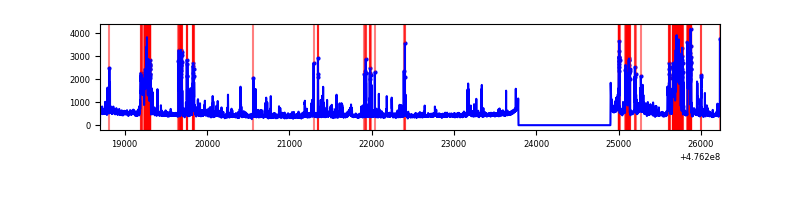 |
| B | 7532 | 6413 | 2285 | 2285 | 30.34% | 35.63% | 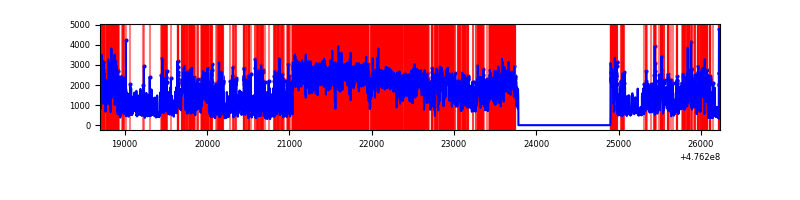 |
| C | 7533 | 6414 | 740 | 740 | 9.82% | 11.54% | 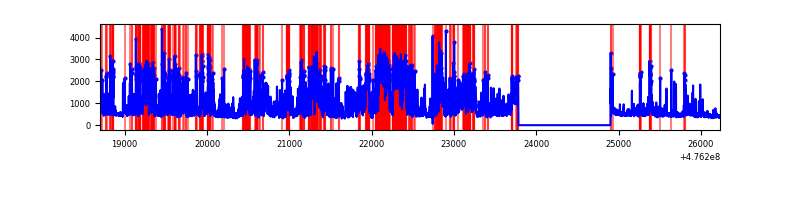 |
| D | 7533 | 6414 | 206 | 206 | 2.73% | 3.21% | 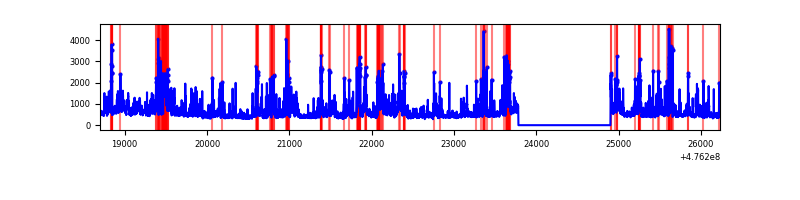 |
Top three noisy pixels from each quadrant. If the there are fewer than three noisy pixels in the level2.evt file, extra rows are filled as -1
| Pixel properties | Quadrant properties | ||||||
|---|---|---|---|---|---|---|---|
| Quadrant | DetID | PixID | Counts | Sigma | Mean | Median | Sigma |
| A | 4 | 249 | 854208 | 5246.23 | 662 | 646 | 162.7 |
| A | 8 | 38 | 176747 | 1082.37 | 662 | 646 | 162.7 |
| A | 4 | 3 | 164268 | 1005.67 | 662 | 646 | 162.7 |
| B | 5 | 172 | 3765406 | 31531.39 | 559 | 540 | 119.4 |
| B | 4 | 170 | 2538356 | 21254.64 | 559 | 540 | 119.4 |
| B | 7 | 0 | 789947 | 6611.42 | 559 | 540 | 119.4 |
| C | 15 | 196 | 1280773 | 7293.27 | 636 | 632 | 175.5 |
| C | 0 | 177 | 388010 | 2206.98 | 636 | 632 | 175.5 |
| C | 13 | 3 | 385138 | 2190.62 | 636 | 632 | 175.5 |
| D | 6 | 42 | 495959 | 2719.9 | 653 | 631 | 182.1 |
| D | 8 | 246 | 339202 | 1859.13 | 653 | 631 | 182.1 |
| D | 2 | 249 | 280926 | 1539.13 | 653 | 631 | 182.1 |
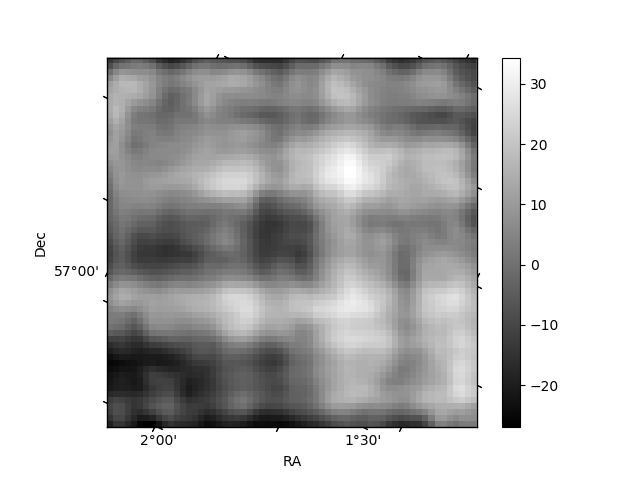
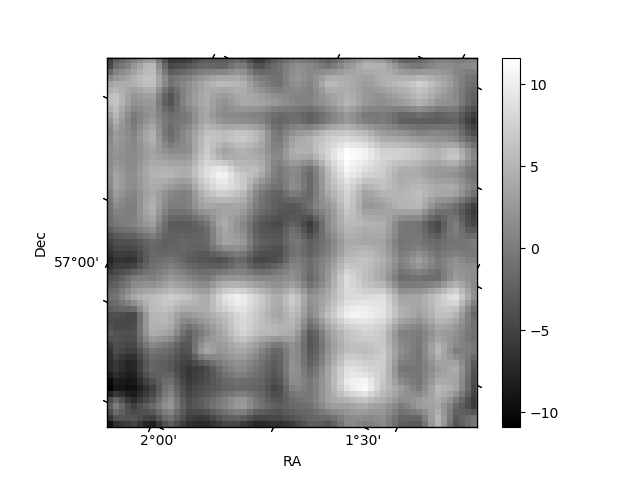
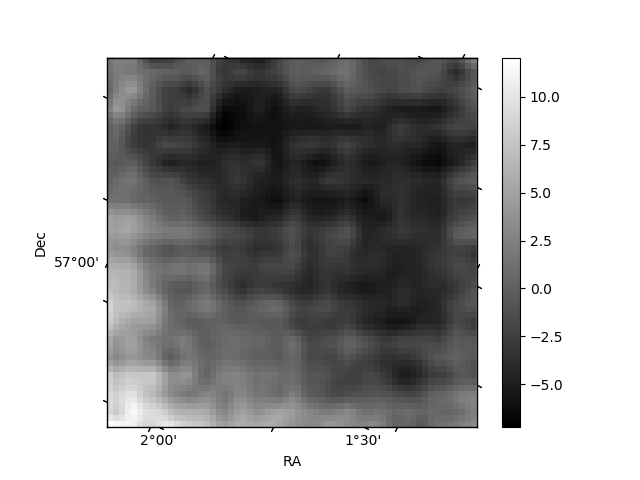
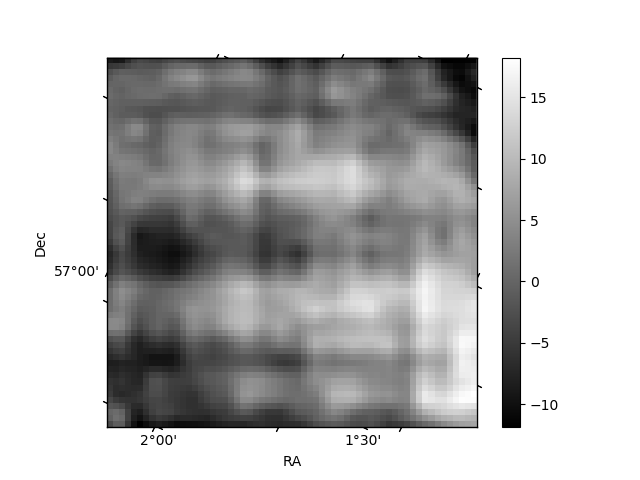
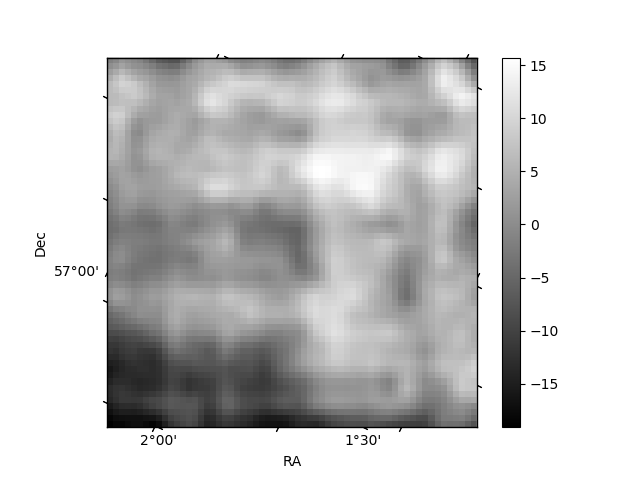
Histogram calculated using DETX and DETY for each event in the final _common_clean file
| Quadrant A | 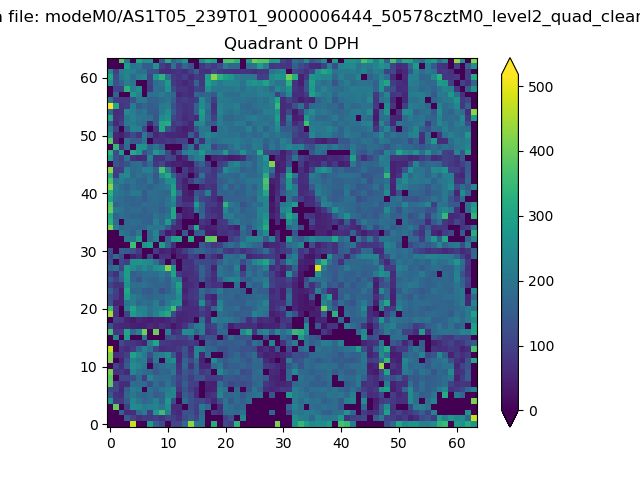 |
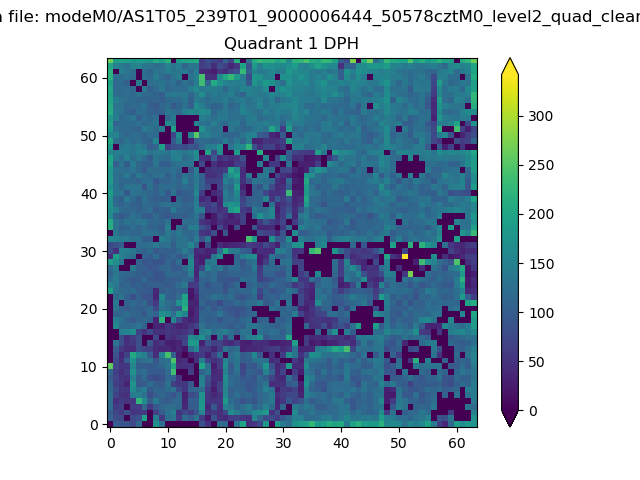 |
Quadrant B |
|---|---|---|---|
| Quadrant D | 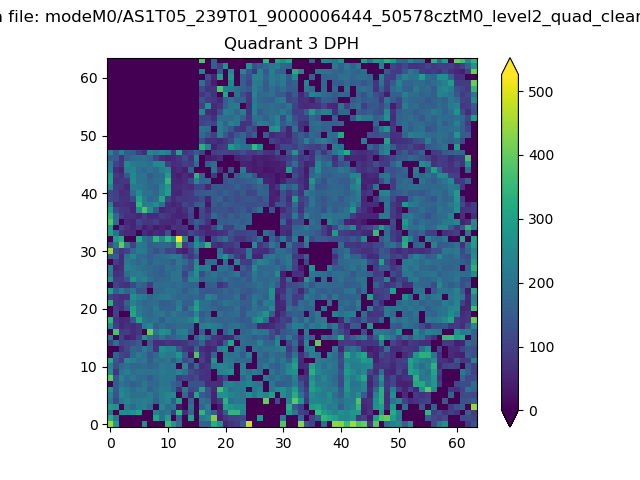 |
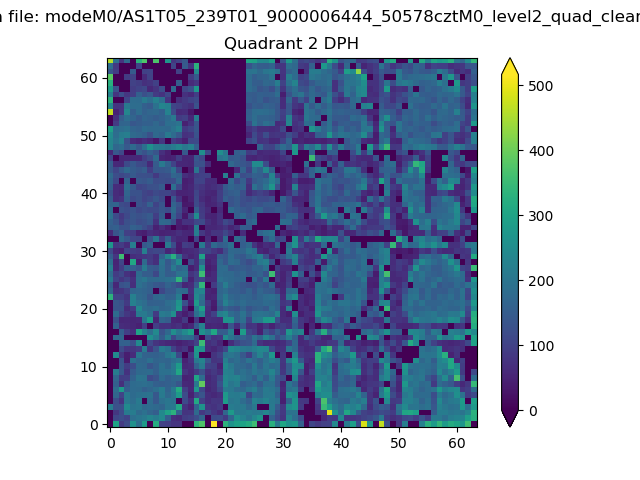 |
Quadrant C |
| Plot type | Count rate plots | Images |
|---|---|---|
| Comparison with Poisson distribution Blue bars denote a histogram of data divided into 1 sec bins. Red curve is a Poisson curve with rate = median count rate of data. |
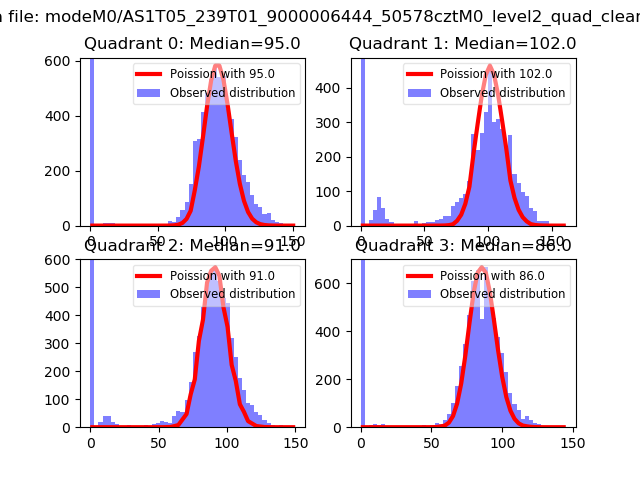 |
 |
| Quadrant-wise count rates Data is divided into 100 sec bins |
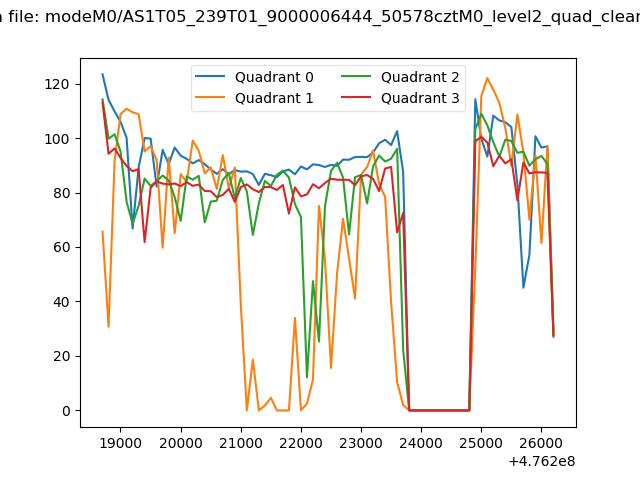 |
|
| Module-wise count rates for Quadrant A Data is divided into 100 sec bins |
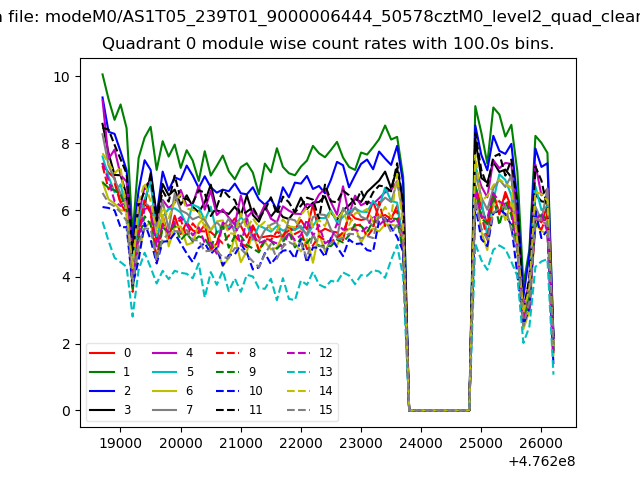 |
 |
| Module-wise count rates for Quadrant B Data is divided into 100 sec bins |
 |
 |
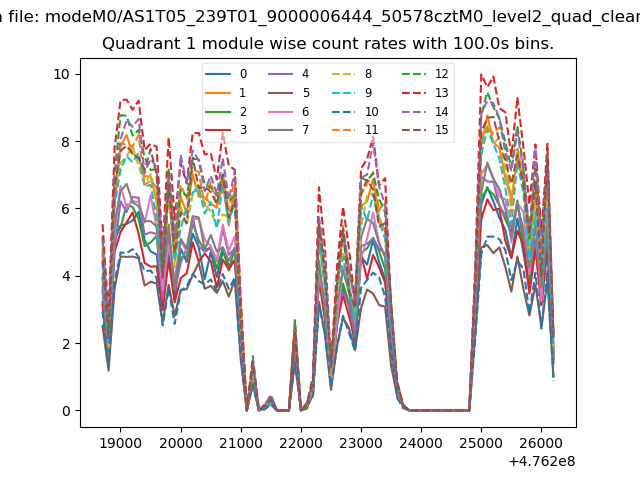
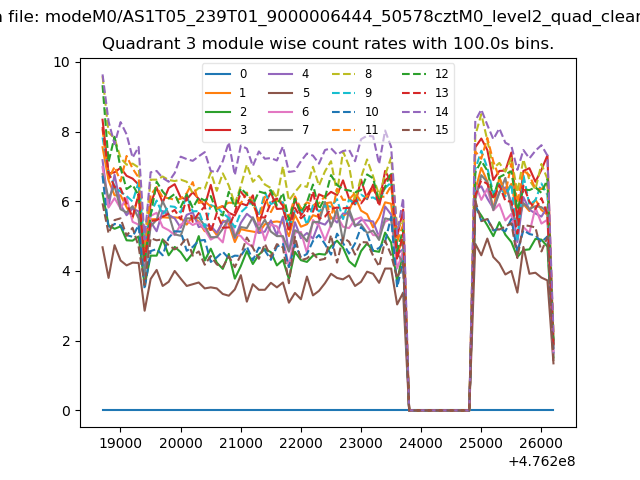
| Module-wise count rates for Quadrant C Data is divided into 100 sec bins |
 |
 |
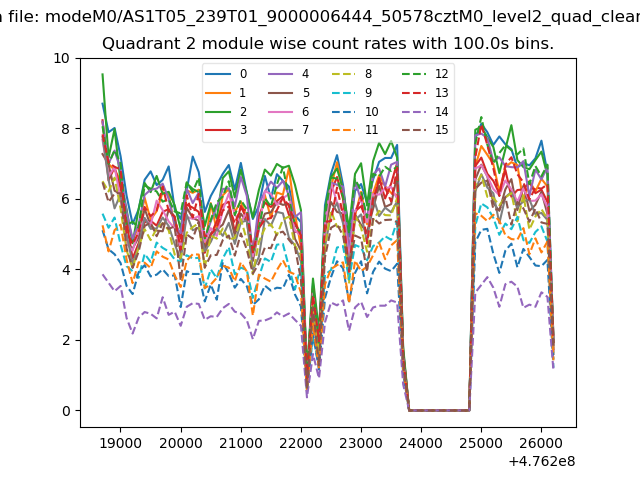
| Module-wise count rates for Quadrant D Data is divided into 100 sec bins |
 |
 |
| Parameter | Plot |
|---|---|
| CZT HV Monitor | 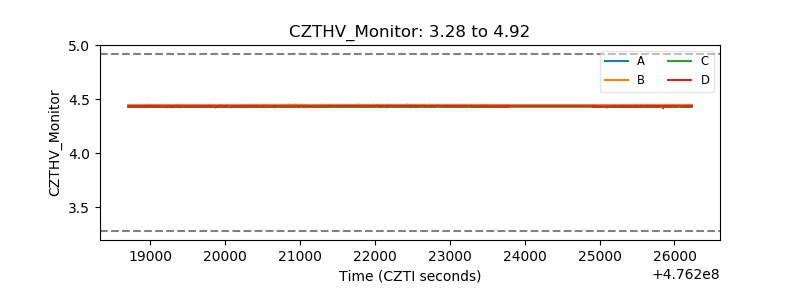 |
| D_VDD | 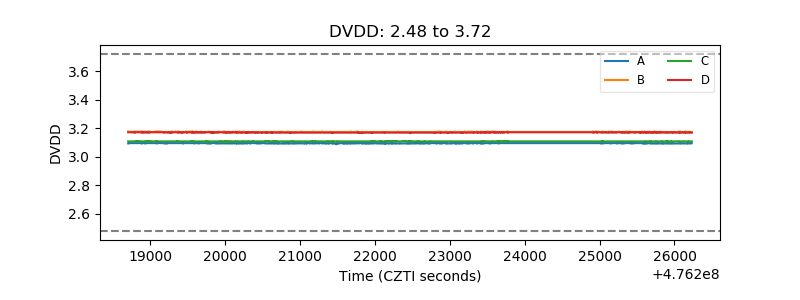 |
| Temperature 1 | 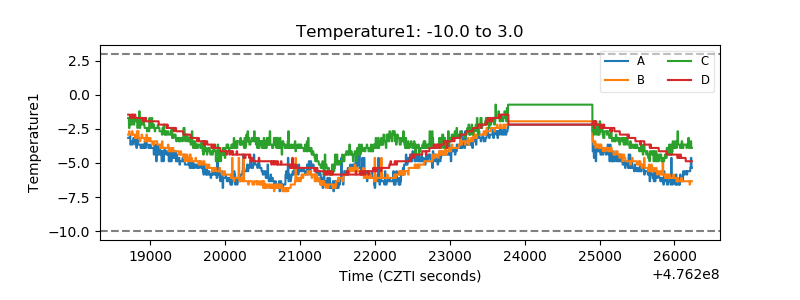 |
| Veto HV Monitor | 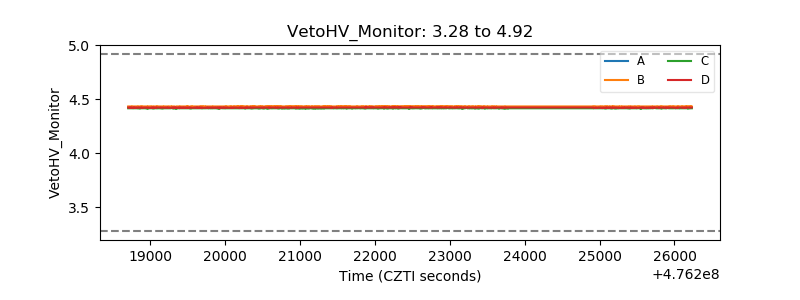 |
| Veto LLD | 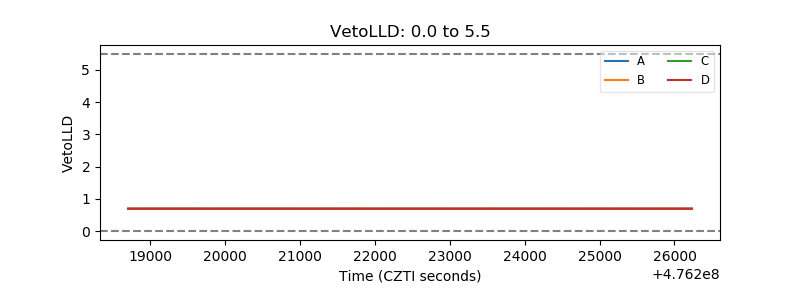 |
| Alpha Counter | 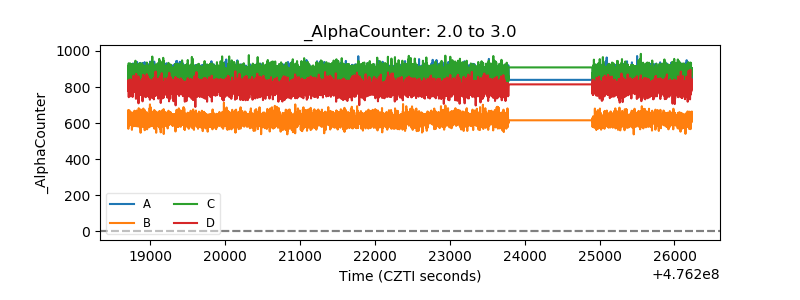 |
| _CPM_Rate | 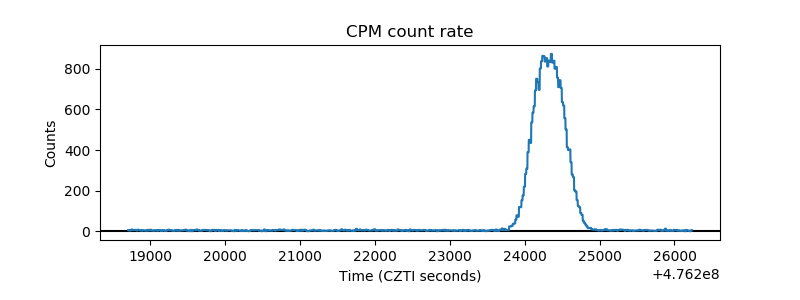 |
| CZT Counter | 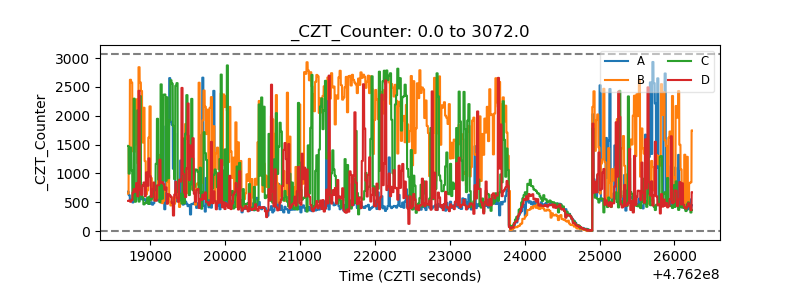 |
| +2.5 Volts monitor |  |
| +5 Volts monitor |  |
| _ROLL_ROT | 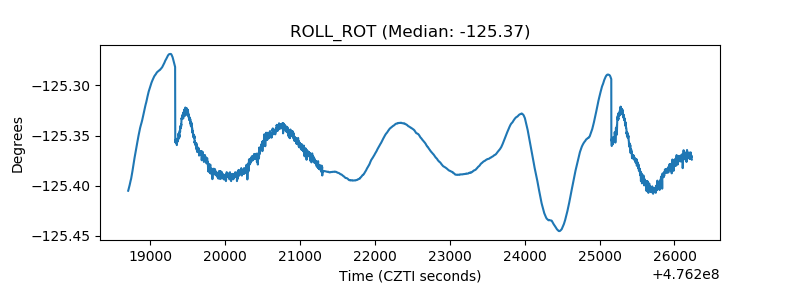 |
| _Roll_DEC | 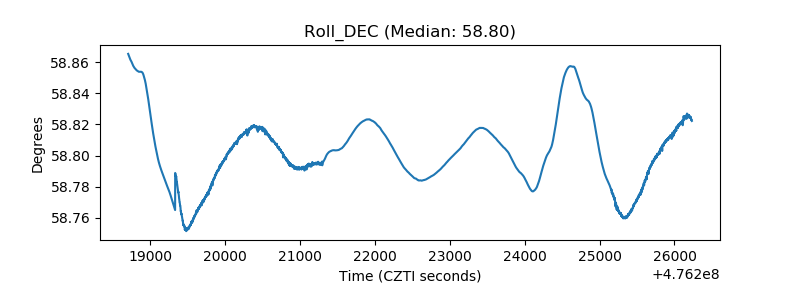 |
| _Roll_RA | 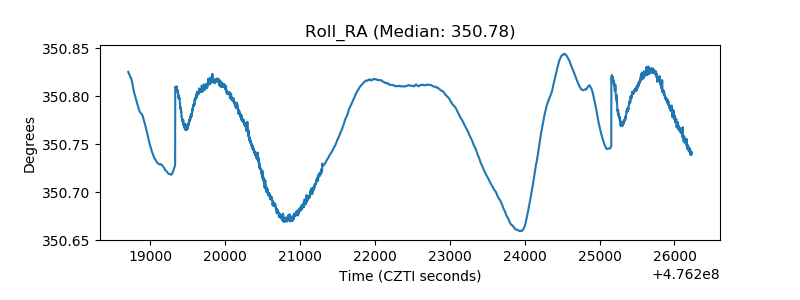 |
| Veto Counter | 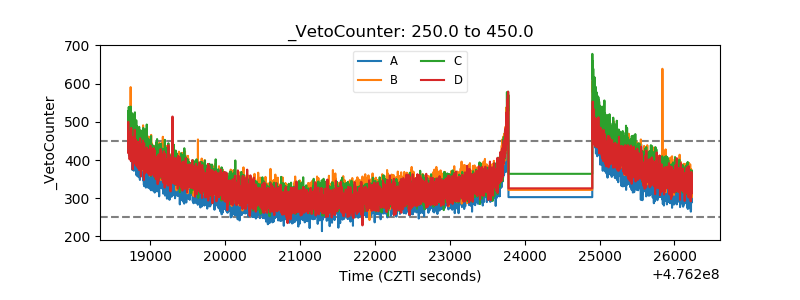 |