| Param | Original file | Final file |
|---|---|---|
| Filename | modeM0/AS1T05_239T01_9000006444_50579cztM0_level2.fits | modeM0/AS1T05_239T01_9000006444_50579cztM0_level2_quad_clean.evt |
| Size (bytes) | 698,555,520 | 88,315,200 |
| Size | 666.2 MB | 84.2 MB |
| Events in quadrant A | 5,405,195 | 588,492 |
| Events in quadrant B | 9,702,355 | 476,082 |
| Events in quadrant C | 5,003,715 | 588,616 |
| Events in quadrant D | 5,236,894 | 561,279 |
| Mode M0 | |||
|---|---|---|---|
| Quadrant | BADHDUFLAG | Total packets | Discarded packets |
| A | 0 | 20559 | 2 |
| B | 0 | 33433 | 2 |
| C | 0 | 19464 | 2 |
| D | 0 | 20302 | 2 |
| Mode M9 | |||
|---|---|---|---|
| Quadrant | BADHDUFLAG | Total packets | Discarded packets |
| A | 0 | 20 | 0 |
| B | 0 | 21 | 0 |
| C | 0 | 21 | 0 |
| D | 0 | 21 | 0 |
| Mode SS | |||
|---|---|---|---|
| Quadrant | BADHDUFLAG | Total packets | Discarded packets |
| A | 0 | 134 | 0 |
| B | 0 | 134 | 0 |
| C | 0 | 134 | 0 |
| D | 0 | 134 | 0 |
| Quadrant | Total seconds | Saturated seconds | Saturation percentage |
|---|---|---|---|
| A | 6587 | 701 | 10.642174% |
| B | 6587 | 2449 | 37.179293% |
| C | 6587 | 464 | 7.044178% |
| D | 6586 | 394 | 5.982387% |
Noise dominated data is calculated using 1-second bins in cleaned event files. If a bin has >2000 counts, and if more than 50% of those come from <1% of pixels, then it is considered to be noise-dominated and hence unusable.
| Quadrant | # 1 sec bins | Bins with >0 counts | Bins with >2000 counts | High rate bins dominated by noise | Noise dominated (total time) | Noise dominated (detector-on time) | Marked lightcurve |
|---|---|---|---|---|---|---|---|
| A | 7767 | 6587 | 584 | 584 | 7.52% | 8.87% | 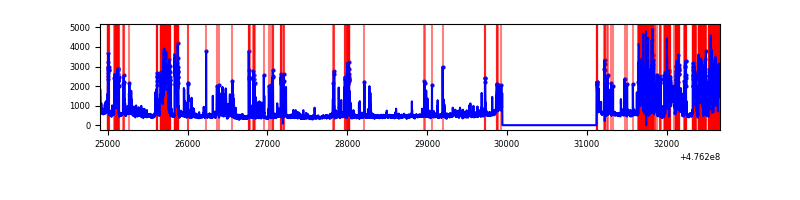 |
| B | 7767 | 6588 | 1745 | 1745 | 22.47% | 26.49% | 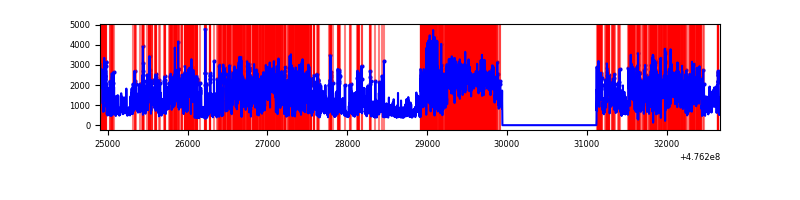 |
| C | 7767 | 6588 | 367 | 367 | 4.73% | 5.57% | 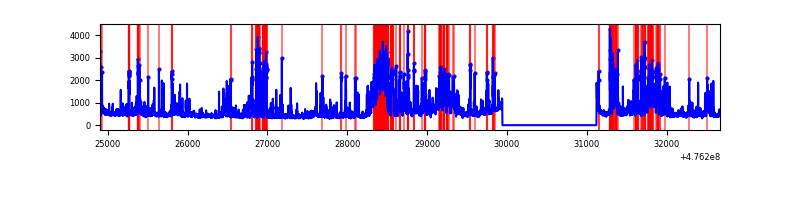 |
| D | 7766 | 6587 | 351 | 351 | 4.52% | 5.33% | 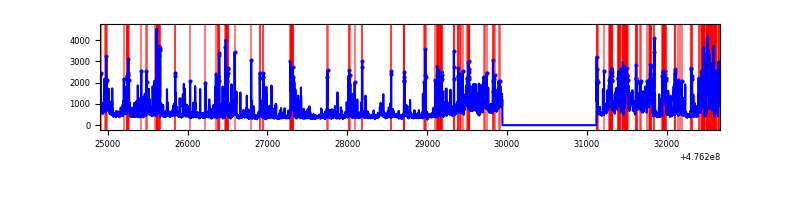 |
Top three noisy pixels from each quadrant. If the there are fewer than three noisy pixels in the level2.evt file, extra rows are filled as -1
| Pixel properties | Quadrant properties | ||||||
|---|---|---|---|---|---|---|---|
| Quadrant | DetID | PixID | Counts | Sigma | Mean | Median | Sigma |
| A | 4 | 249 | 1811383 | 10841.65 | 673 | 657 | 167.0 |
| A | 4 | 3 | 239142 | 1427.92 | 673 | 657 | 167.0 |
| A | 8 | 38 | 214642 | 1281.23 | 673 | 657 | 167.0 |
| B | 5 | 172 | 3185391 | 24969.84 | 603 | 585 | 127.5 |
| B | 4 | 170 | 2526925 | 19807.26 | 603 | 585 | 127.5 |
| B | 7 | 0 | 617617 | 4837.72 | 603 | 585 | 127.5 |
| C | 15 | 195 | 844295 | 4581.54 | 677 | 674 | 184.1 |
| C | 15 | 196 | 692791 | 3758.76 | 677 | 674 | 184.1 |
| C | 15 | 147 | 191284 | 1035.17 | 677 | 674 | 184.1 |
| D | 8 | 246 | 636994 | 3396.97 | 671 | 646 | 187.3 |
| D | 6 | 42 | 544054 | 2900.83 | 671 | 646 | 187.3 |
| D | 8 | 48 | 344435 | 1835.22 | 671 | 646 | 187.3 |
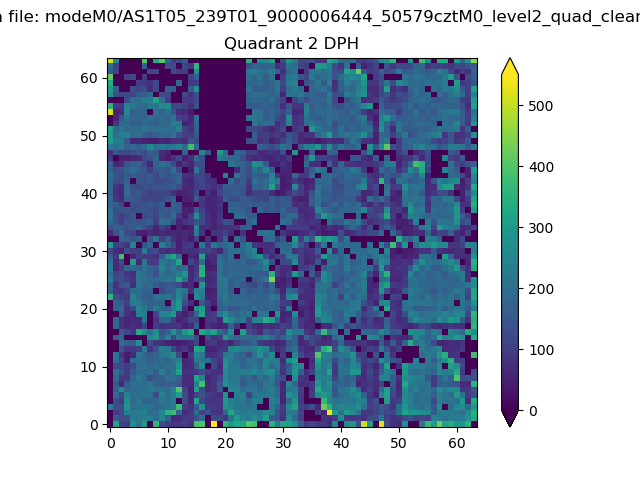
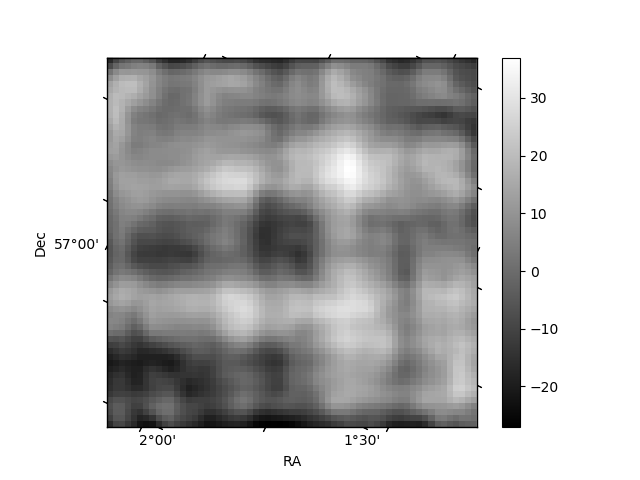
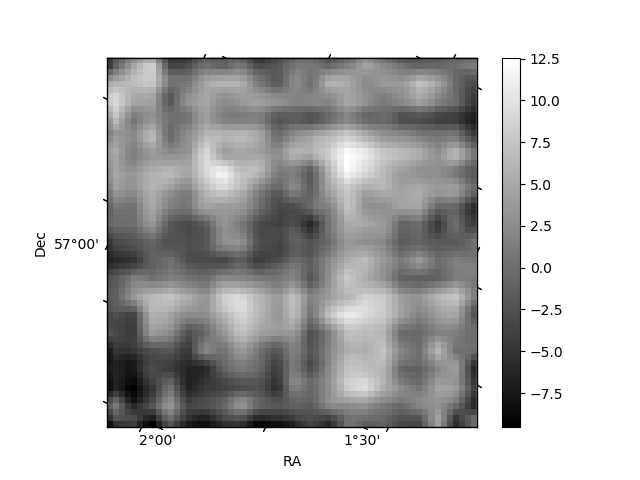
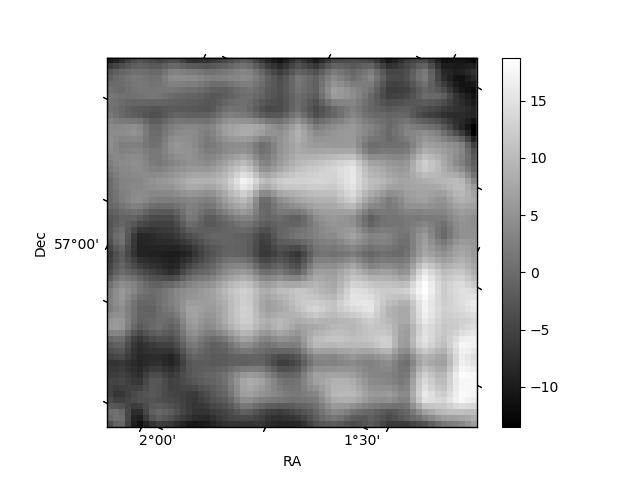
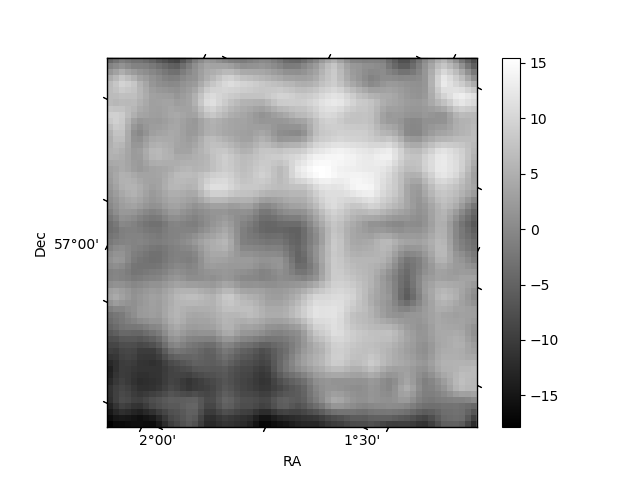
Histogram calculated using DETX and DETY for each event in the final _common_clean file
| Quadrant A | 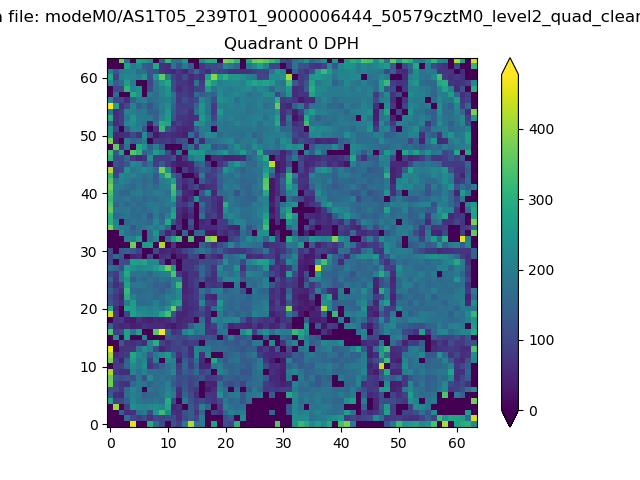 |
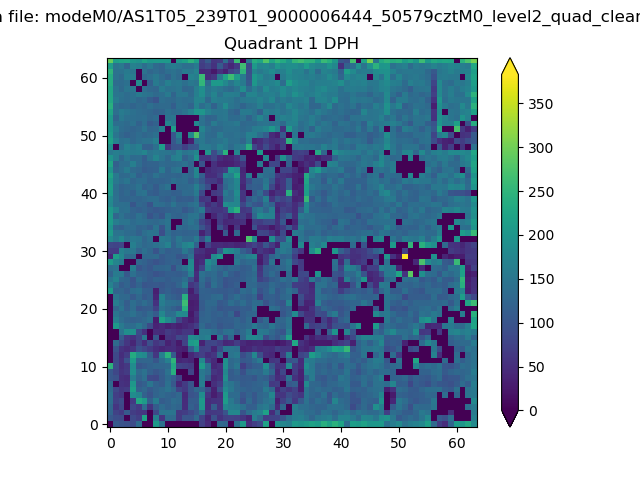 |
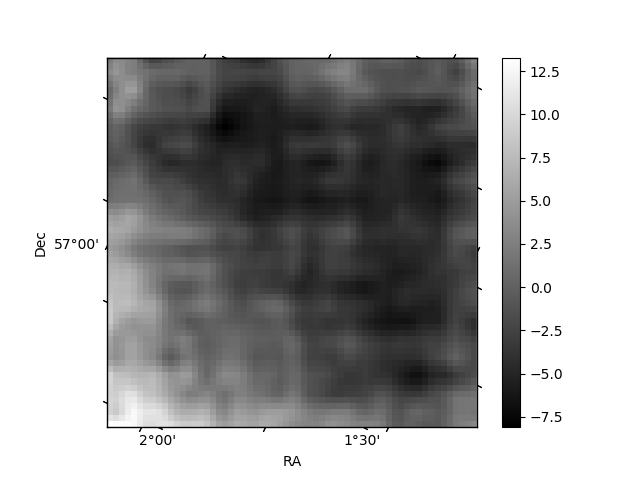
Quadrant B |
|---|---|---|---|
| Quadrant D | 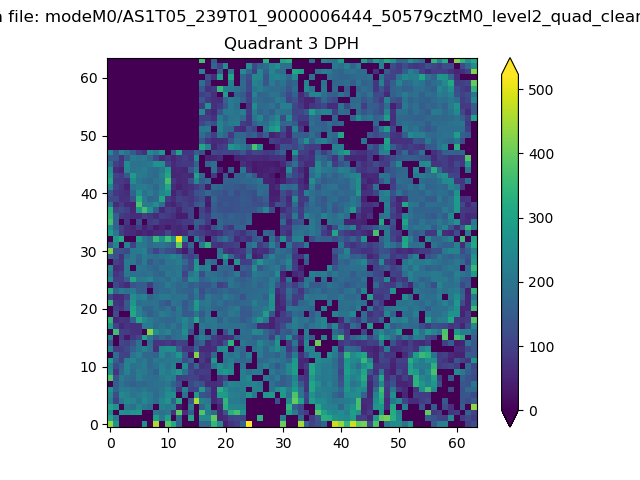 |
 |
Quadrant C |
| Plot type | Count rate plots | Images |
|---|---|---|
| Comparison with Poisson distribution Blue bars denote a histogram of data divided into 1 sec bins. Red curve is a Poisson curve with rate = median count rate of data. |
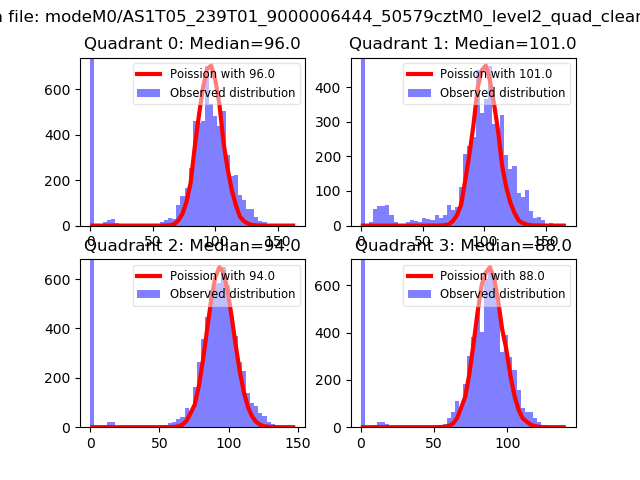 |
 |
| Quadrant-wise count rates Data is divided into 100 sec bins |
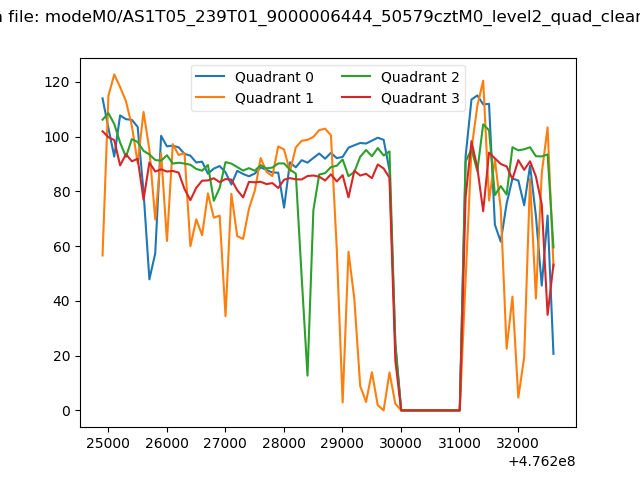 |
|
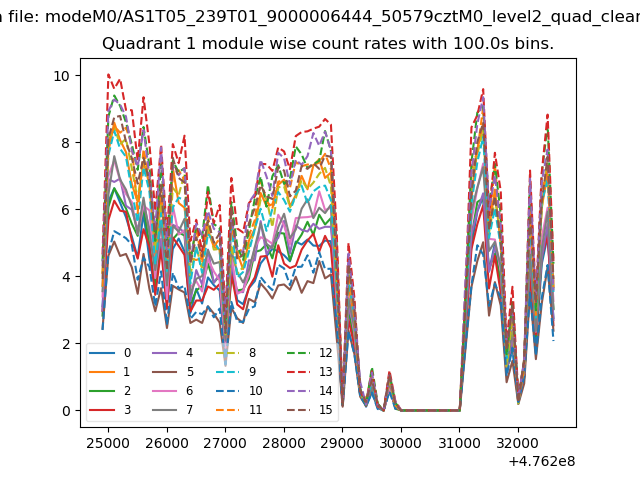
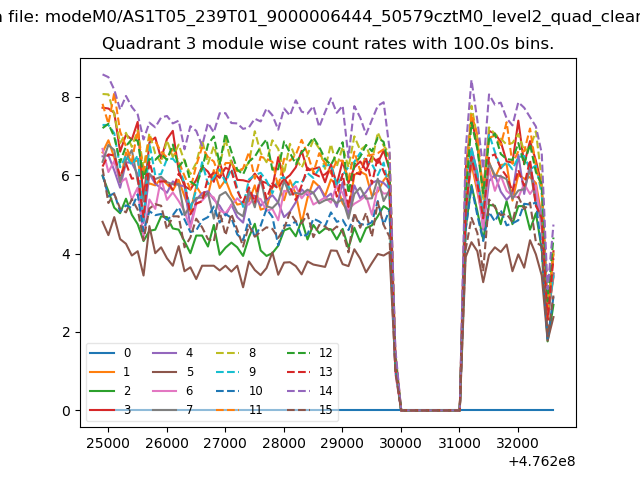
| Module-wise count rates for Quadrant A Data is divided into 100 sec bins |
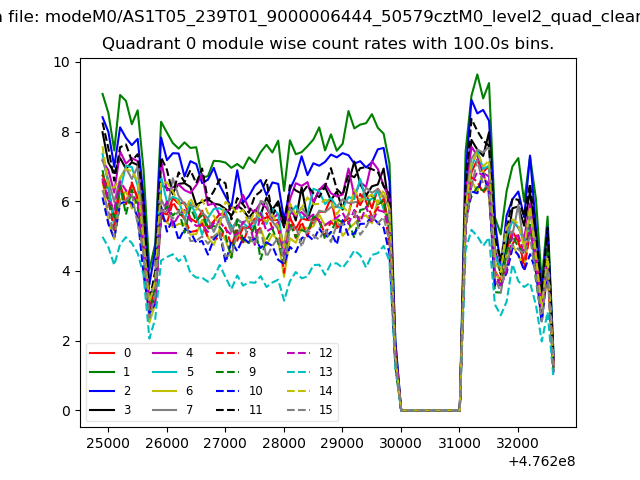 |
 |
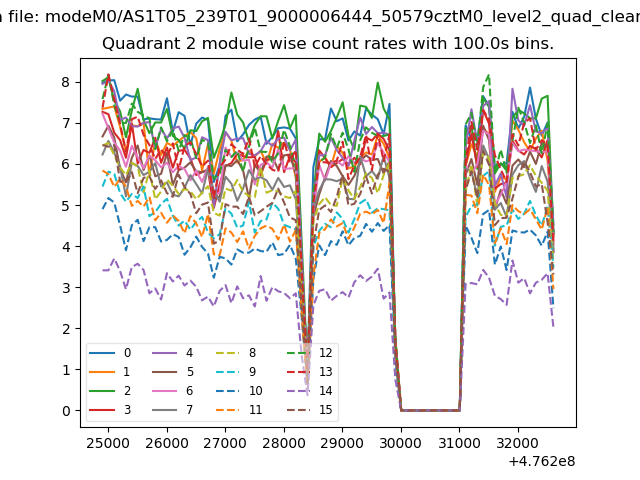
| Module-wise count rates for Quadrant B Data is divided into 100 sec bins |
 |
 |
| Module-wise count rates for Quadrant C Data is divided into 100 sec bins |
 |
 |
| Module-wise count rates for Quadrant D Data is divided into 100 sec bins |
 |
 |
| Parameter | Plot |
|---|---|
| CZT HV Monitor |  |
| D_VDD | 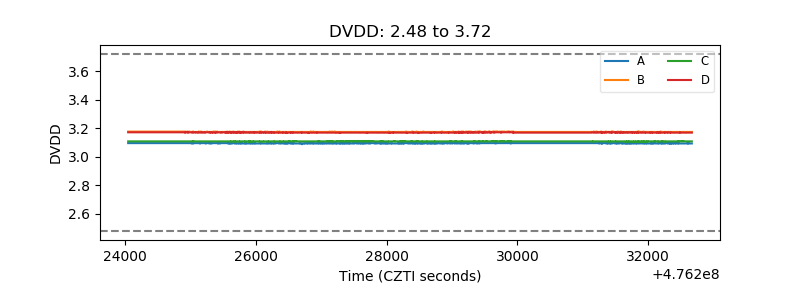 |
| Temperature 1 | 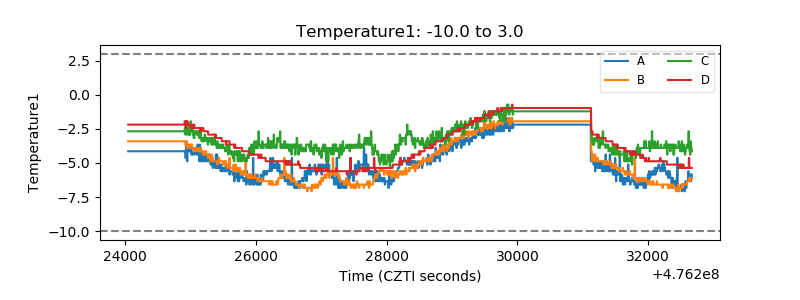 |
| Veto HV Monitor | 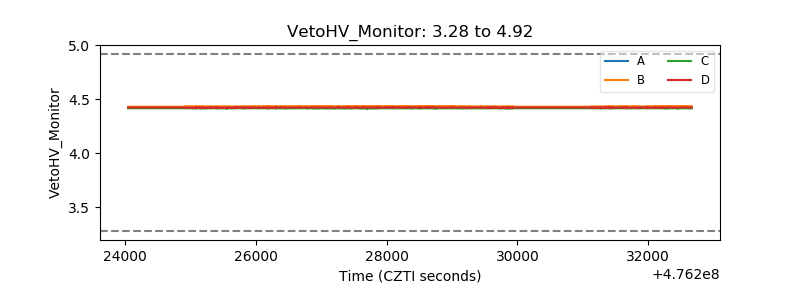 |
| Veto LLD | 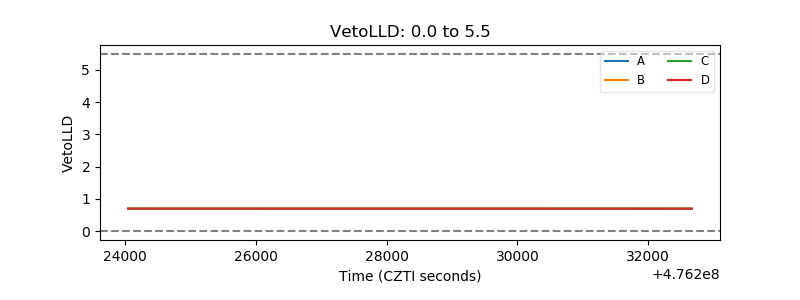 |
| Alpha Counter | 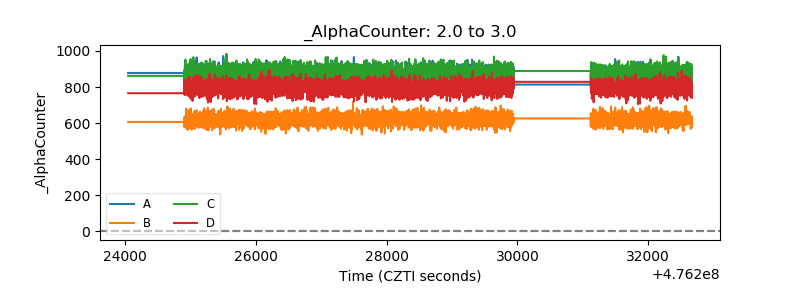 |
| _CPM_Rate | 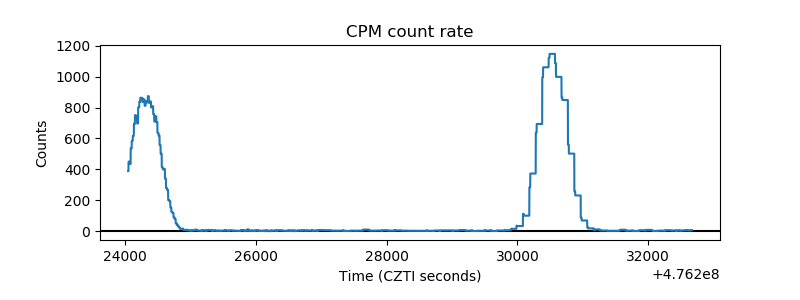 |
| CZT Counter | 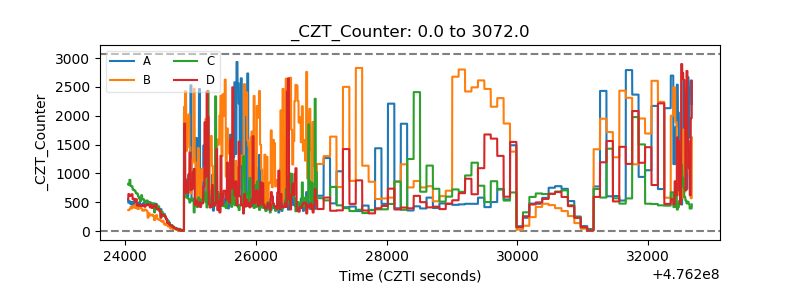 |
| +2.5 Volts monitor | 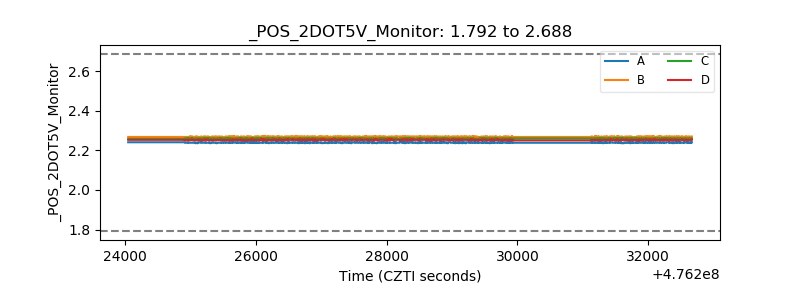 |
| +5 Volts monitor | 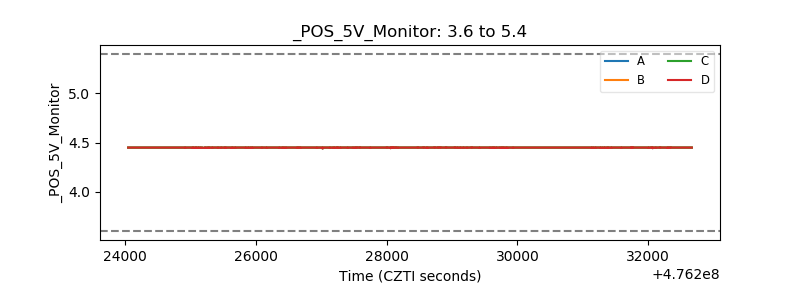 |
| _ROLL_ROT | 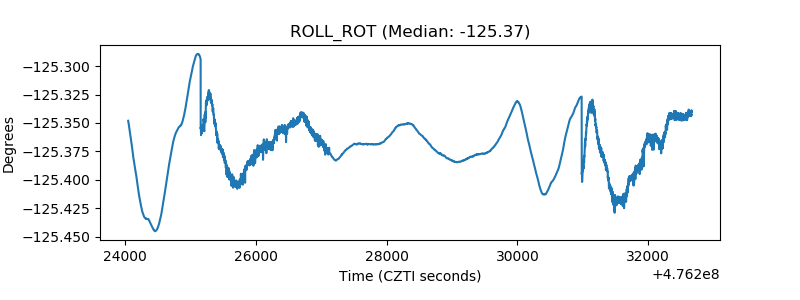 |
| _Roll_DEC | 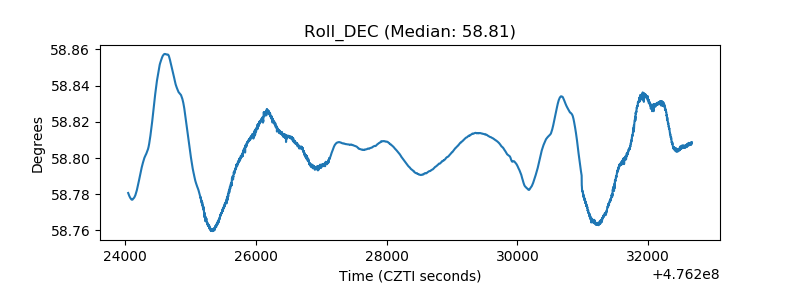 |
| _Roll_RA | 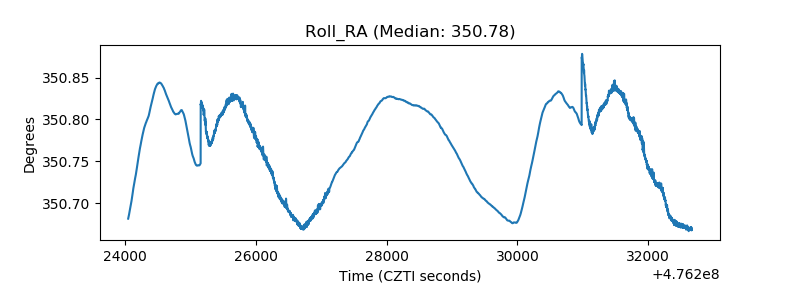 |
| Veto Counter | 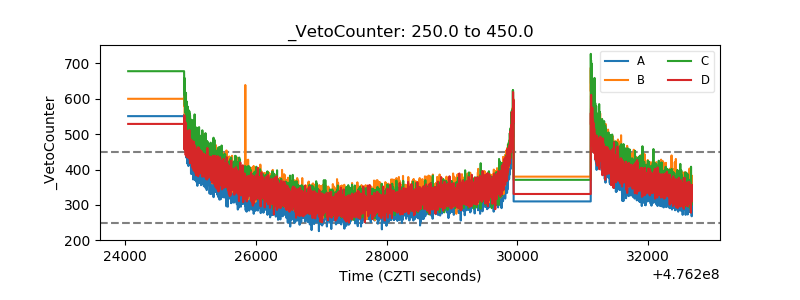 |