| Param | Original file | Final file |
|---|---|---|
| Filename | modeM0/AS1T05_239T01_9000006444_50580cztM0_level2.fits | modeM0/AS1T05_239T01_9000006444_50580cztM0_level2_quad_clean.evt |
| Size (bytes) | 708,690,240 | 90,898,560 |
| Size | 675.9 MB | 86.7 MB |
| Events in quadrant A | 6,120,169 | 582,313 |
| Events in quadrant B | 6,816,073 | 617,910 |
| Events in quadrant C | 5,906,328 | 569,301 |
| Events in quadrant D | 6,879,370 | 521,869 |
| Mode M0 | |||
|---|---|---|---|
| Quadrant | BADHDUFLAG | Total packets | Discarded packets |
| A | 0 | 22647 | 2 |
| B | 0 | 24846 | 2 |
| C | 0 | 22096 | 2 |
| D | 0 | 25191 | 2 |
| Mode M9 | |||
|---|---|---|---|
| Quadrant | BADHDUFLAG | Total packets | Discarded packets |
| A | 0 | 15 | 0 |
| B | 0 | 16 | 0 |
| C | 0 | 16 | 0 |
| D | 0 | 16 | 0 |
| Mode SS | |||
|---|---|---|---|
| Quadrant | BADHDUFLAG | Total packets | Discarded packets |
| A | 0 | 134 | 0 |
| B | 0 | 134 | 0 |
| C | 0 | 134 | 0 |
| D | 0 | 134 | 0 |
| Quadrant | Total seconds | Saturated seconds | Saturation percentage |
|---|---|---|---|
| A | 6609 | 875 | 13.239522% |
| B | 6609 | 1095 | 16.568316% |
| C | 6609 | 793 | 11.998790% |
| D | 6609 | 974 | 14.737479% |
Noise dominated data is calculated using 1-second bins in cleaned event files. If a bin has >2000 counts, and if more than 50% of those come from <1% of pixels, then it is considered to be noise-dominated and hence unusable.
| Quadrant | # 1 sec bins | Bins with >0 counts | Bins with >2000 counts | High rate bins dominated by noise | Noise dominated (total time) | Noise dominated (detector-on time) | Marked lightcurve |
|---|---|---|---|---|---|---|---|
| A | 7844 | 6609 | 732 | 732 | 9.33% | 11.08% | 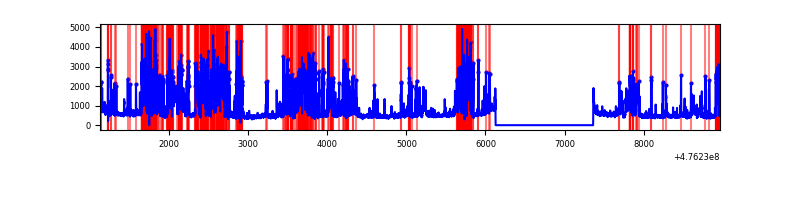 |
| B | 7844 | 6610 | 590 | 590 | 7.52% | 8.93% | 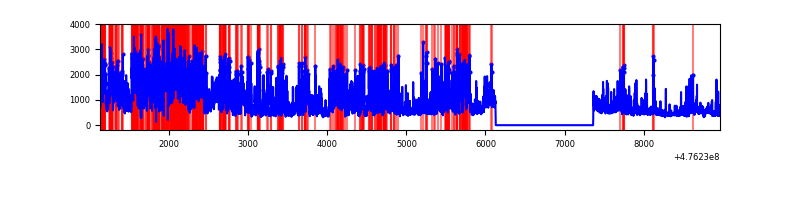 |
| C | 7844 | 6610 | 617 | 617 | 7.87% | 9.33% | 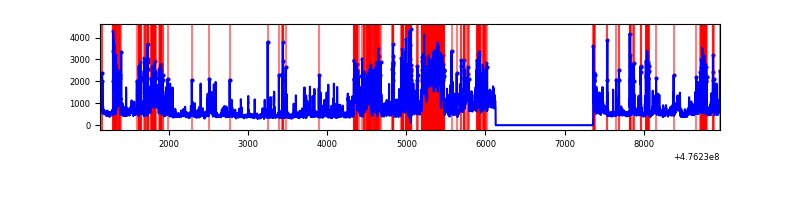 |
| D | 7844 | 6610 | 939 | 939 | 11.97% | 14.21% | 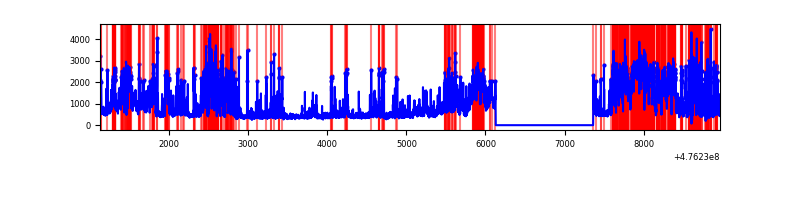 |
Top three noisy pixels from each quadrant. If the there are fewer than three noisy pixels in the level2.evt file, extra rows are filled as -1
| Pixel properties | Quadrant properties | ||||||
|---|---|---|---|---|---|---|---|
| Quadrant | DetID | PixID | Counts | Sigma | Mean | Median | Sigma |
| A | 4 | 249 | 1822642 | 10995.2 | 672 | 657 | 165.7 |
| A | 12 | 250 | 365115 | 2199.41 | 672 | 657 | 165.7 |
| A | 3 | 114 | 346769 | 2088.69 | 672 | 657 | 165.7 |
| B | 4 | 170 | 2081453 | 14785.49 | 669 | 648 | 140.7 |
| B | 5 | 172 | 790500 | 5612.42 | 669 | 648 | 140.7 |
| B | 7 | 0 | 532295 | 3777.7 | 669 | 648 | 140.7 |
| C | 15 | 196 | 947967 | 5158.01 | 664 | 660 | 183.7 |
| C | 15 | 195 | 946772 | 5151.51 | 664 | 660 | 183.7 |
| C | 13 | 3 | 277315 | 1506.36 | 664 | 660 | 183.7 |
| D | 8 | 246 | 2206422 | 12163.48 | 651 | 627 | 181.3 |
| D | 6 | 42 | 689586 | 3799.15 | 651 | 627 | 181.3 |
| D | 7 | 96 | 446327 | 2457.74 | 651 | 627 | 181.3 |
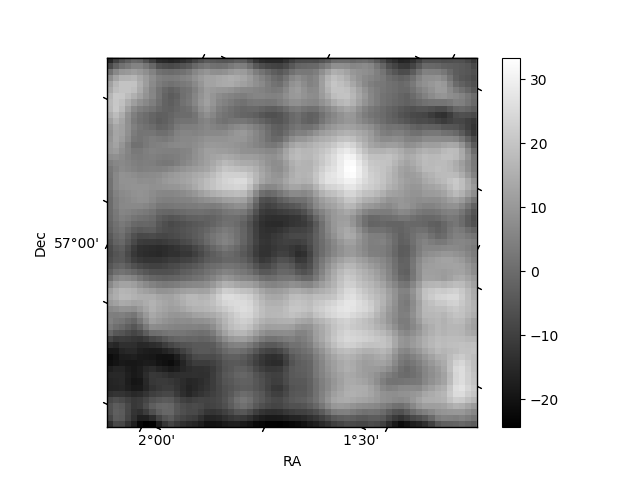
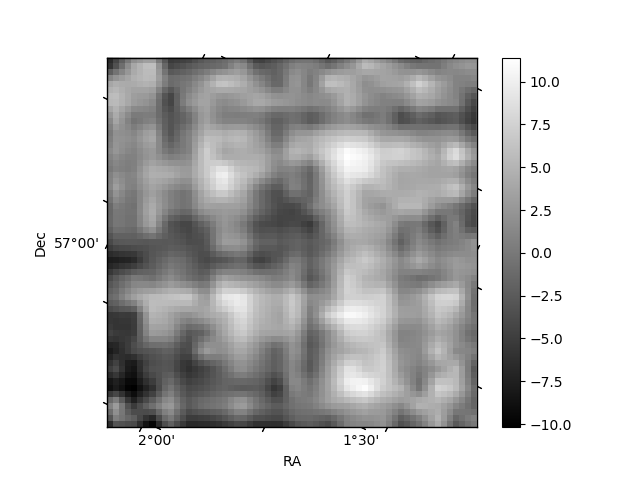
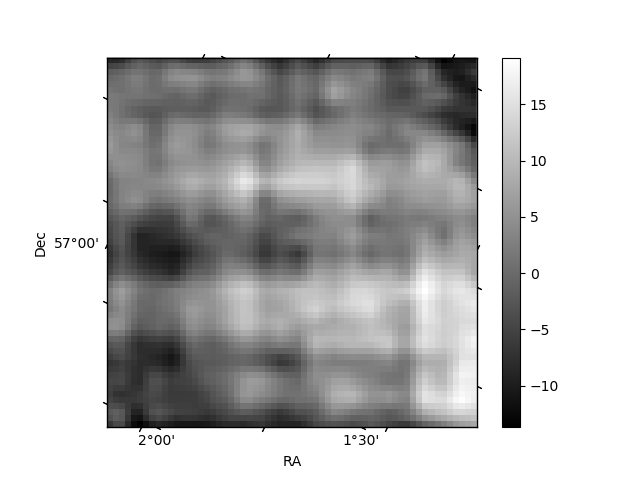
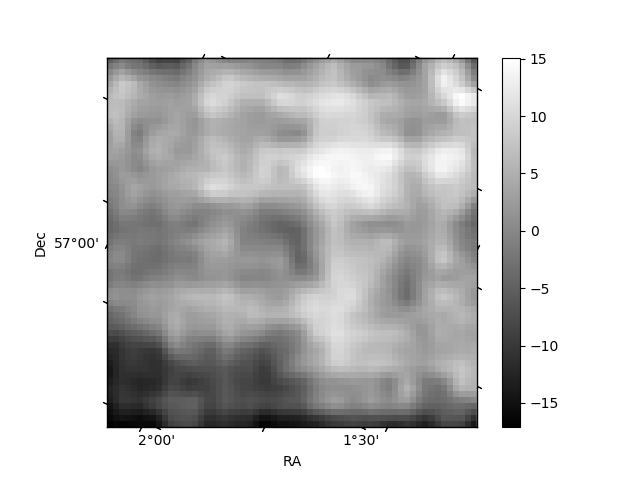
Histogram calculated using DETX and DETY for each event in the final _common_clean file
| Quadrant A | 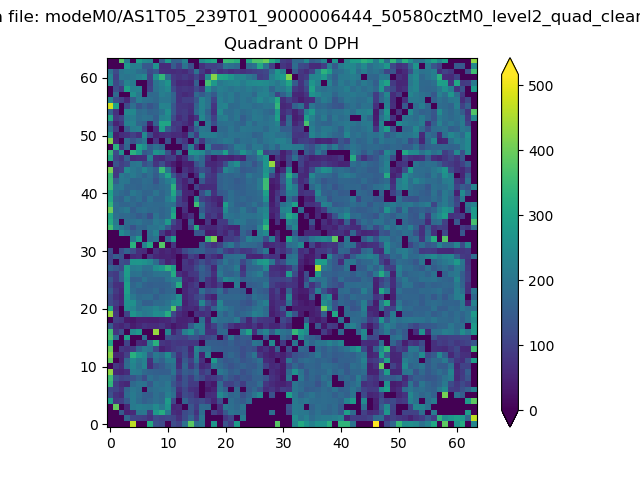 |
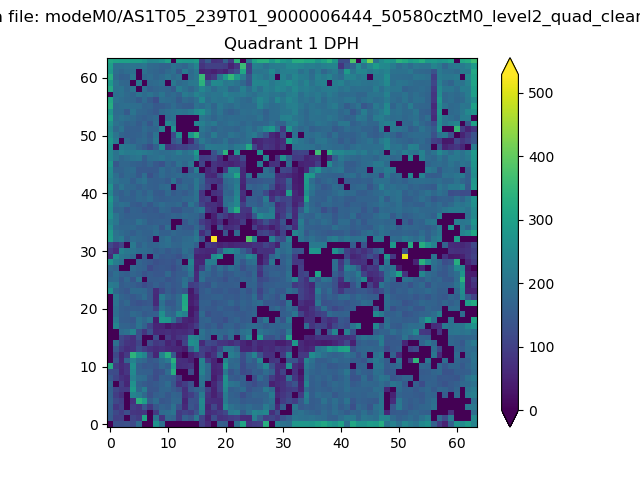 |
Quadrant B |
|---|---|---|---|
| Quadrant D | 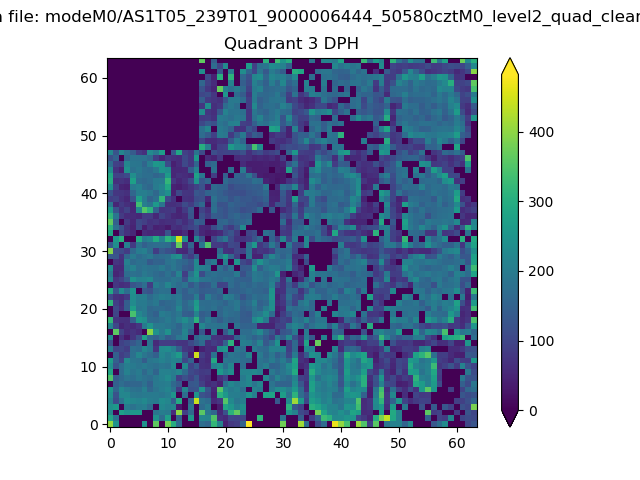 |
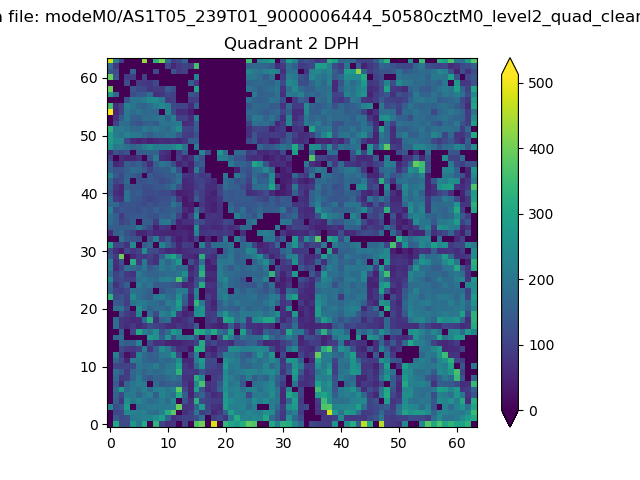 |
Quadrant C |
| Plot type | Count rate plots | Images |
|---|---|---|
| Comparison with Poisson distribution Blue bars denote a histogram of data divided into 1 sec bins. Red curve is a Poisson curve with rate = median count rate of data. |
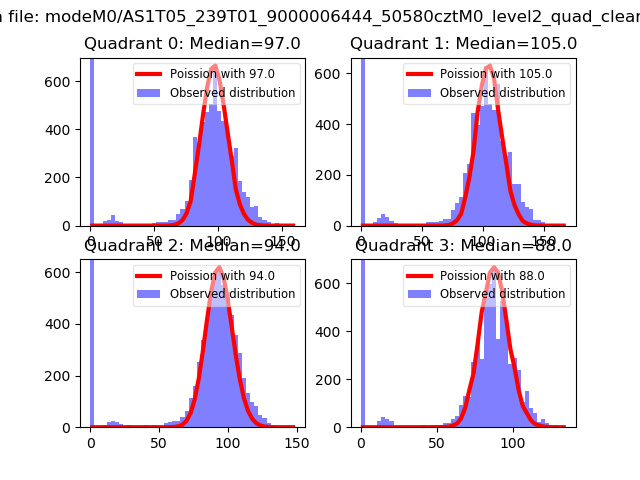 |
 |
| Quadrant-wise count rates Data is divided into 100 sec bins |
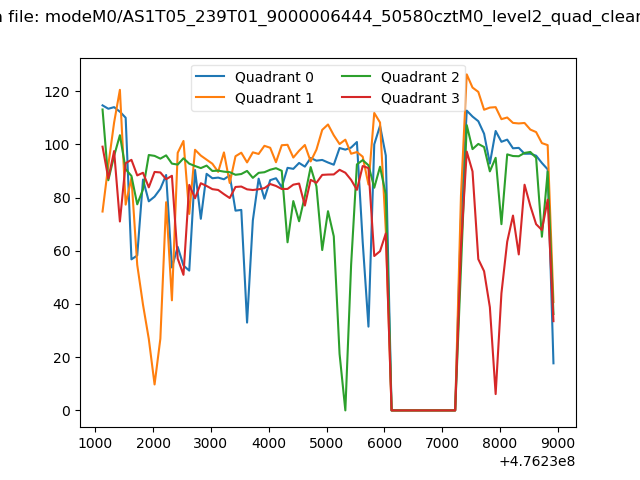 |
|
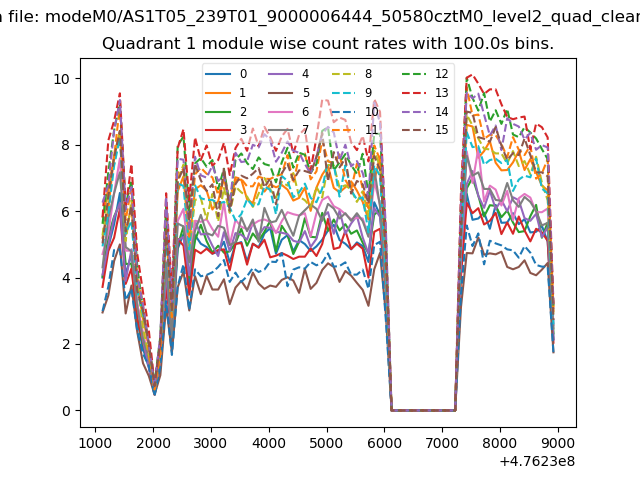
| Module-wise count rates for Quadrant A Data is divided into 100 sec bins |
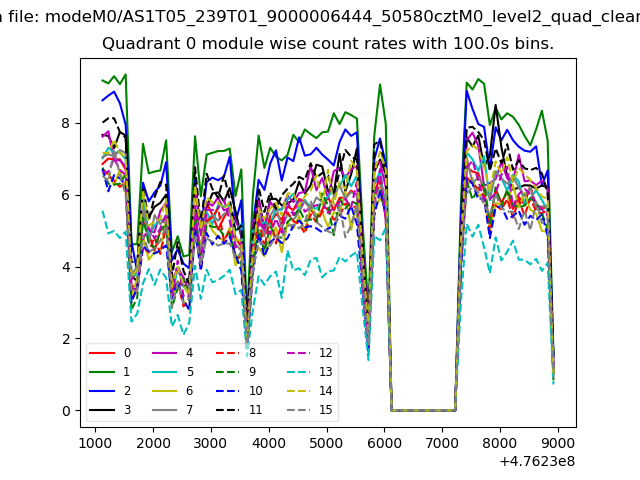 |
 |
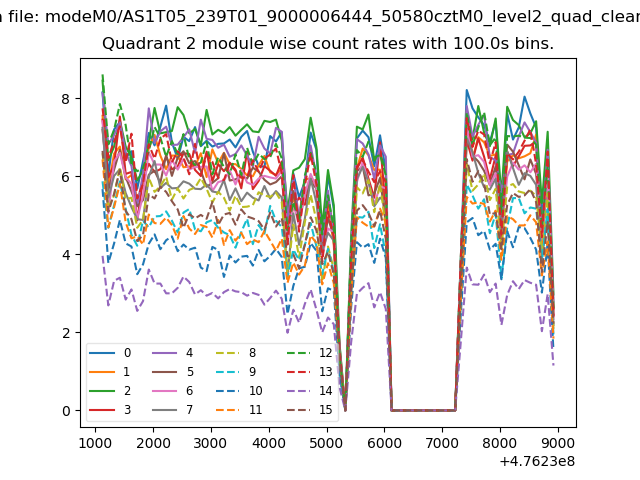
| Module-wise count rates for Quadrant B Data is divided into 100 sec bins |
 |
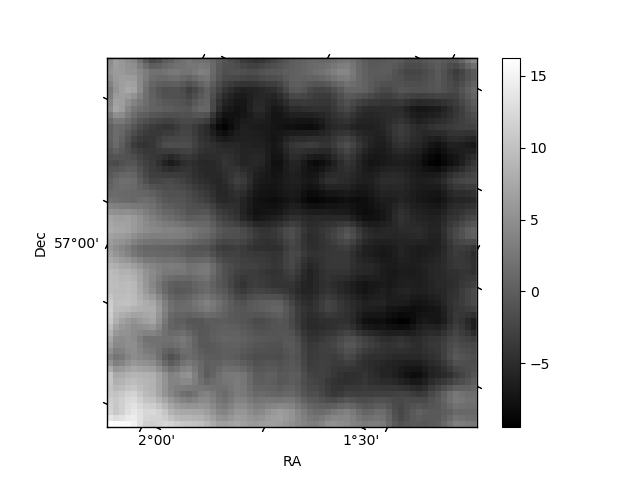 |
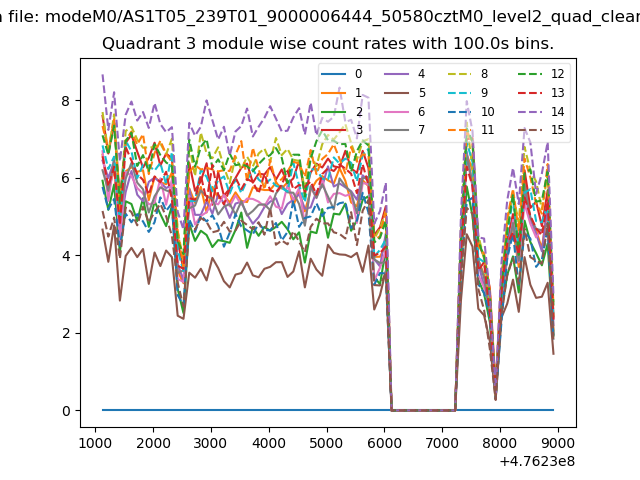
| Module-wise count rates for Quadrant C Data is divided into 100 sec bins |
 |
 |
| Module-wise count rates for Quadrant D Data is divided into 100 sec bins |
 |
 |
| Parameter | Plot |
|---|---|
| CZT HV Monitor | 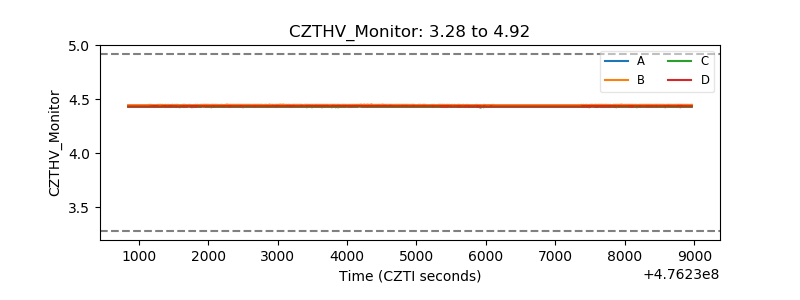 |
| D_VDD | 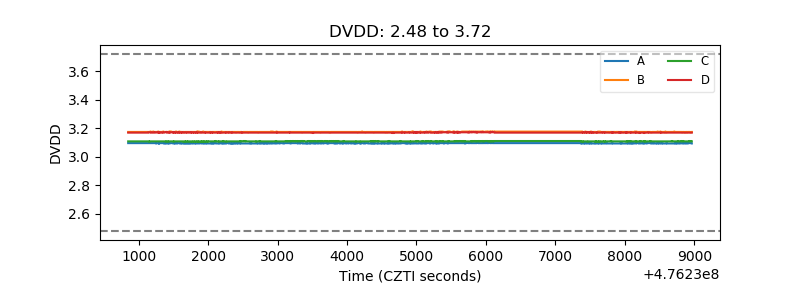 |
| Temperature 1 | 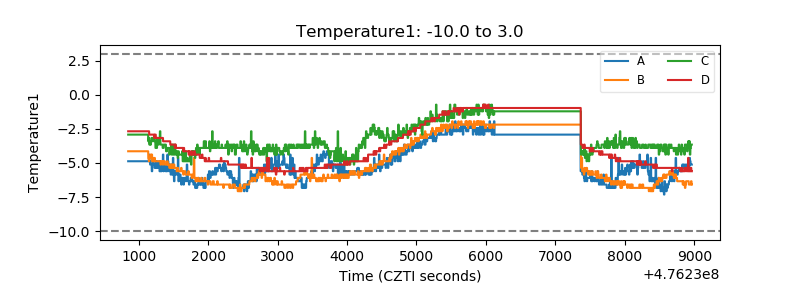 |
| Veto HV Monitor | 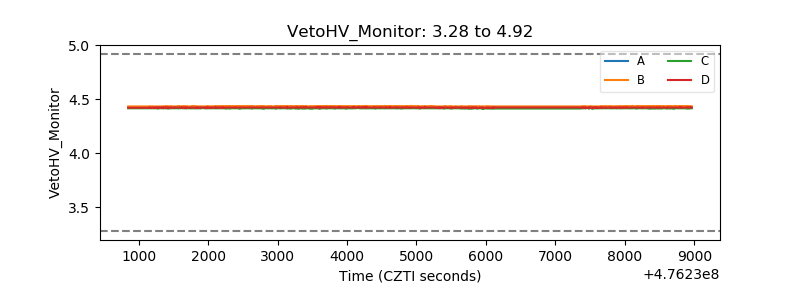 |
| Veto LLD | 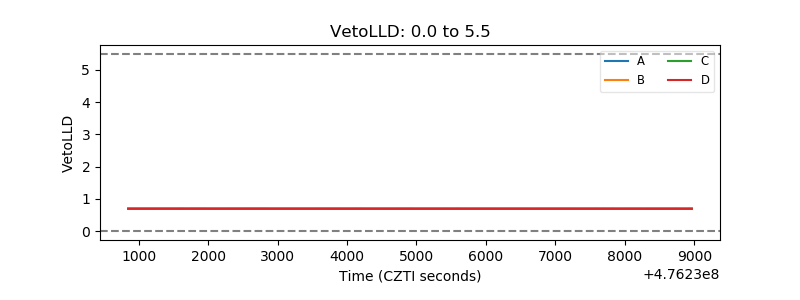 |
| Alpha Counter | 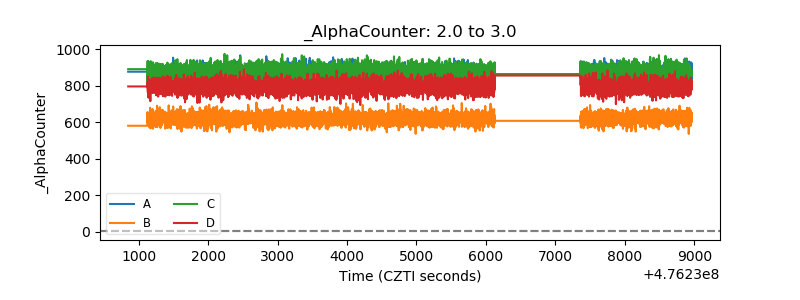 |
| _CPM_Rate | 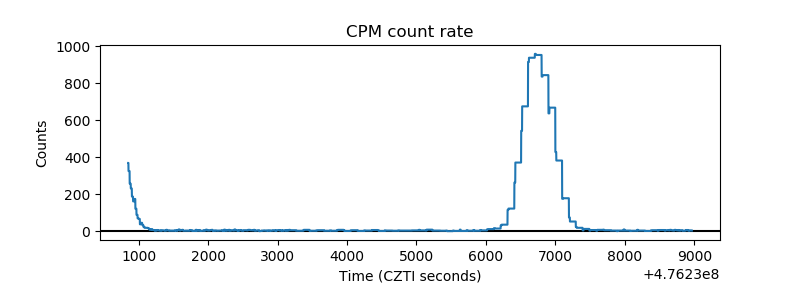 |
| CZT Counter | 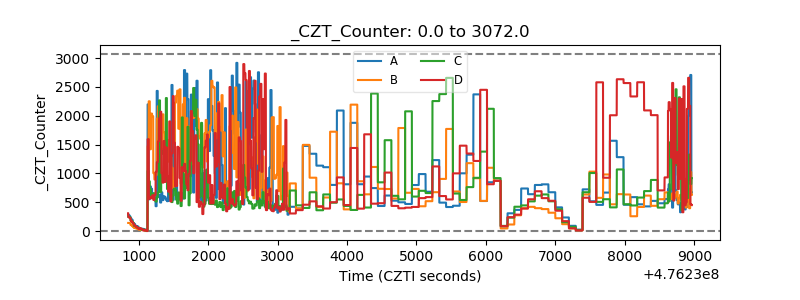 |
| +2.5 Volts monitor |  |
| +5 Volts monitor | 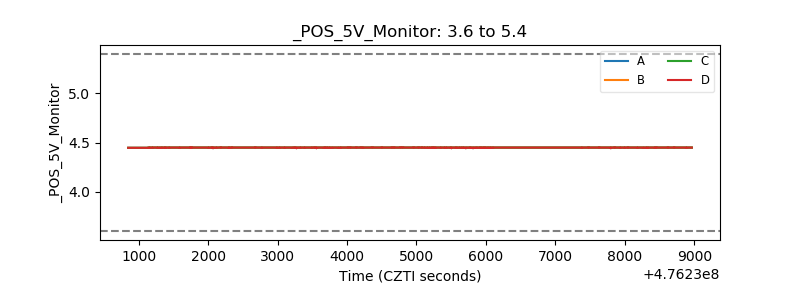 |
| _ROLL_ROT | 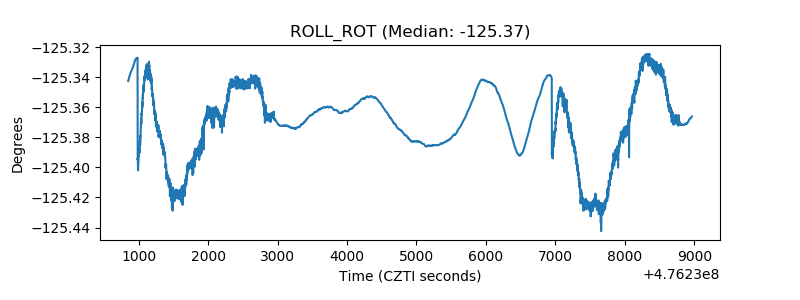 |
| _Roll_DEC | 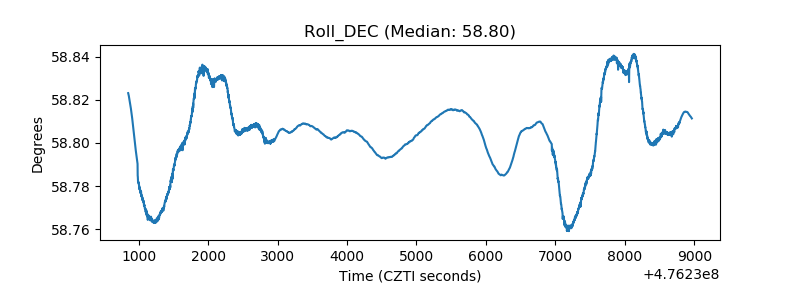 |
| _Roll_RA | 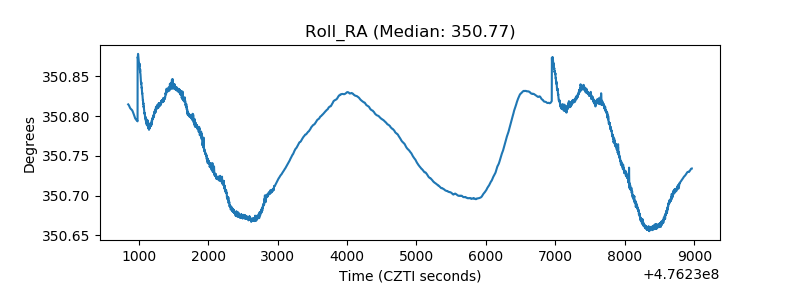 |
| Veto Counter | 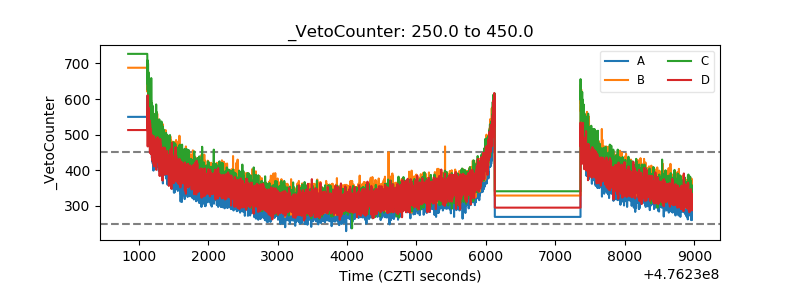 |