| Param | Original file | Final file |
|---|---|---|
| Filename | modeM0/AS1T05_239T01_9000006444_50581cztM0_level2.fits | modeM0/AS1T05_239T01_9000006444_50581cztM0_level2_quad_clean.evt |
| Size (bytes) | 621,120,960 | 88,352,640 |
| Size | 592.3 MB | 84.3 MB |
| Events in quadrant A | 4,249,486 | 596,346 |
| Events in quadrant B | 5,228,091 | 613,397 |
| Events in quadrant C | 5,919,298 | 542,722 |
| Events in quadrant D | 7,101,164 | 478,378 |
| Mode M0 | |||
|---|---|---|---|
| Quadrant | BADHDUFLAG | Total packets | Discarded packets |
| A | 0 | 16973 | 1 |
| B | 0 | 20051 | 1 |
| C | 0 | 21928 | 8 |
| D | 0 | 25624 | 1 |
| Mode M9 | |||
|---|---|---|---|
| Quadrant | BADHDUFLAG | Total packets | Discarded packets |
| A | 0 | 12 | 0 |
| B | 0 | 12 | 0 |
| C | 0 | 12 | 0 |
| D | 0 | 12 | 0 |
| Mode SS | |||
|---|---|---|---|
| Quadrant | BADHDUFLAG | Total packets | Discarded packets |
| A | 0 | 130 | 0 |
| B | 0 | 130 | 0 |
| C | 0 | 130 | 0 |
| D | 0 | 130 | 0 |
| Quadrant | Total seconds | Saturated seconds | Saturation percentage |
|---|---|---|---|
| A | 6372 | 316 | 4.959196% |
| B | 6372 | 681 | 10.687382% |
| C | 6371 | 809 | 12.698164% |
| D | 6372 | 1122 | 17.608286% |
Noise dominated data is calculated using 1-second bins in cleaned event files. If a bin has >2000 counts, and if more than 50% of those come from <1% of pixels, then it is considered to be noise-dominated and hence unusable.
| Quadrant | # 1 sec bins | Bins with >0 counts | Bins with >2000 counts | High rate bins dominated by noise | Noise dominated (total time) | Noise dominated (detector-on time) | Marked lightcurve |
|---|---|---|---|---|---|---|---|
| A | 7507 | 6374 | 231 | 231 | 3.08% | 3.62% | 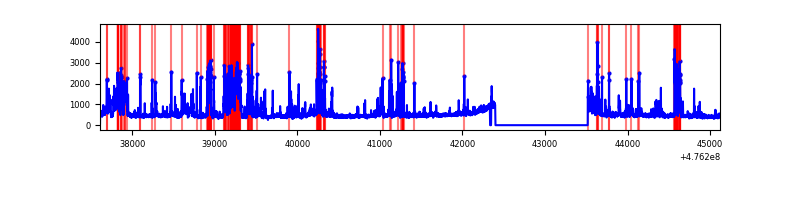 |
| B | 7507 | 6374 | 393 | 393 | 5.24% | 6.17% | 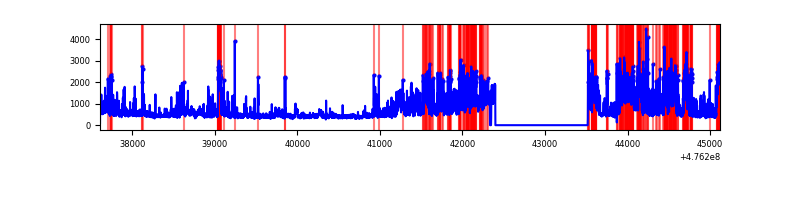 |
| C | 7506 | 6373 | 656 | 656 | 8.74% | 10.29% | 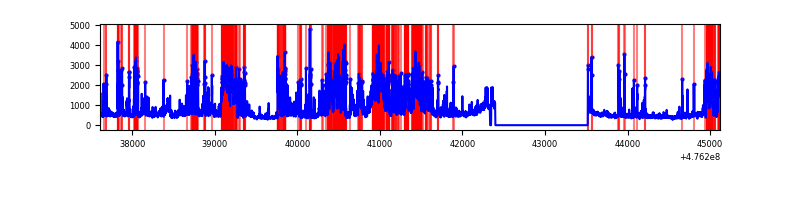 |
| D | 7507 | 6374 | 1123 | 1123 | 14.96% | 17.62% | 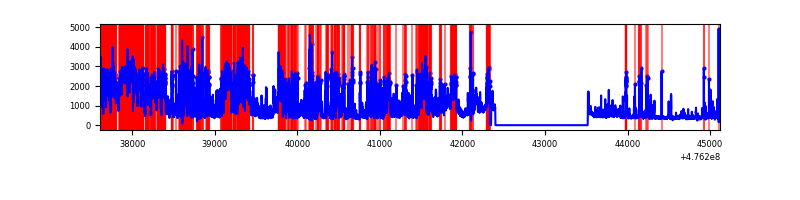 |
Top three noisy pixels from each quadrant. If the there are fewer than three noisy pixels in the level2.evt file, extra rows are filled as -1
| Pixel properties | Quadrant properties | ||||||
|---|---|---|---|---|---|---|---|
| Quadrant | DetID | PixID | Counts | Sigma | Mean | Median | Sigma |
| A | 8 | 247 | 385874 | 2317.49 | 666 | 648 | 166.2 |
| A | 8 | 38 | 301907 | 1812.35 | 666 | 648 | 166.2 |
| A | 4 | 249 | 271661 | 1630.39 | 666 | 648 | 166.2 |
| B | 4 | 170 | 886153 | 6340.56 | 654 | 634 | 139.7 |
| B | 7 | 0 | 575286 | 4114.66 | 654 | 634 | 139.7 |
| B | 5 | 172 | 431514 | 3085.22 | 654 | 634 | 139.7 |
| C | 15 | 196 | 1556317 | 8885.29 | 637 | 631 | 175.1 |
| C | 15 | 195 | 764453 | 4362.56 | 637 | 631 | 175.1 |
| C | 0 | 177 | 321225 | 1831.07 | 637 | 631 | 175.1 |
| D | 8 | 246 | 2345584 | 13678.59 | 614 | 591 | 171.4 |
| D | 7 | 96 | 1204004 | 7019.63 | 614 | 591 | 171.4 |
| D | 2 | 249 | 251896 | 1465.89 | 614 | 591 | 171.4 |
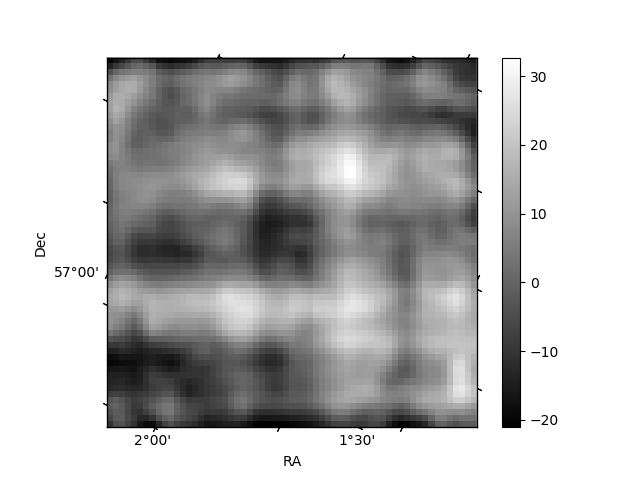
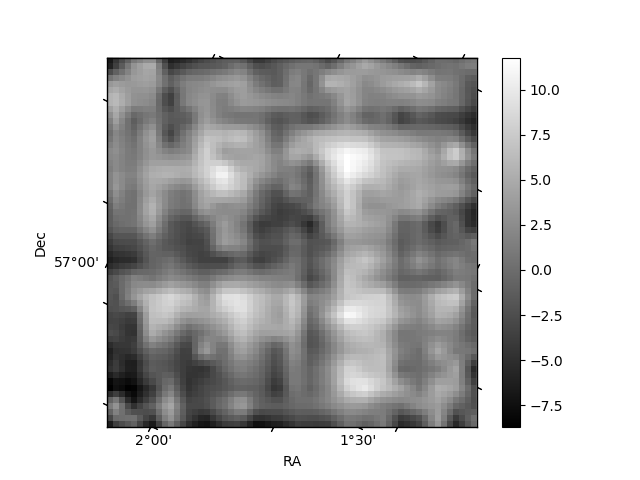
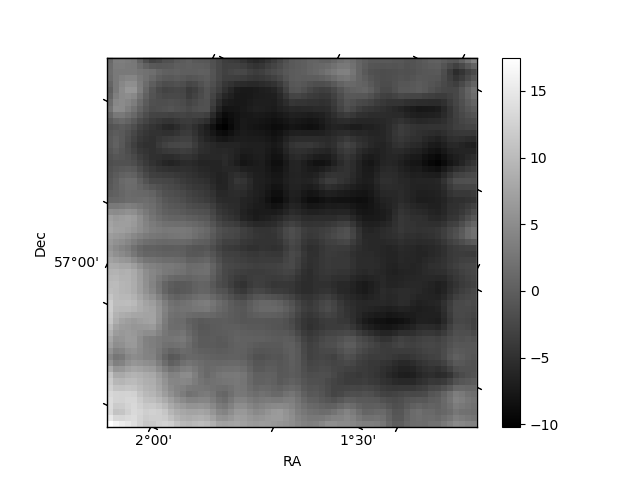
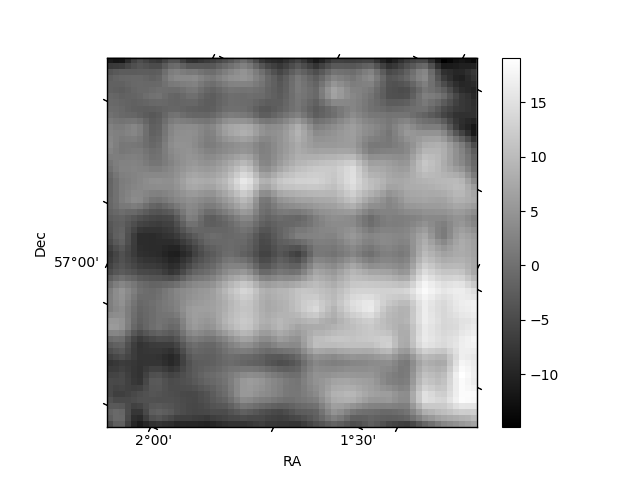
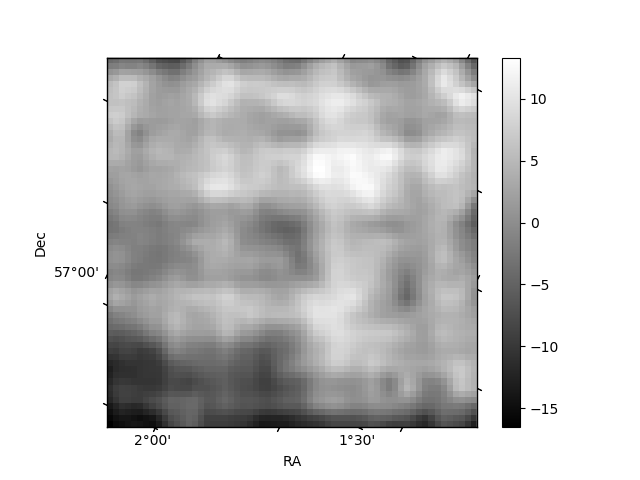
Histogram calculated using DETX and DETY for each event in the final _common_clean file
| Quadrant A | 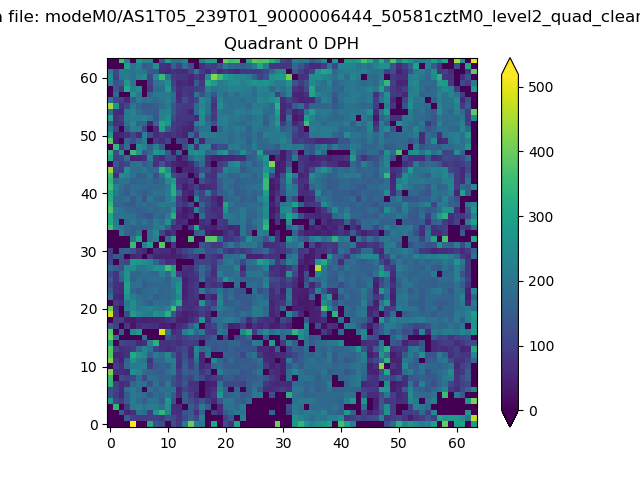 |
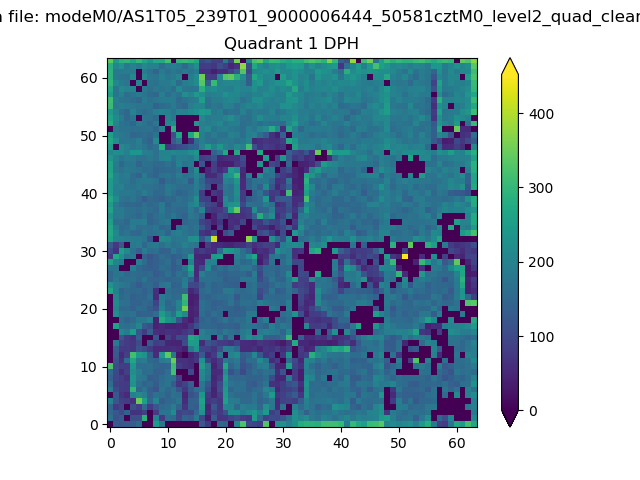 |
Quadrant B |
|---|---|---|---|
| Quadrant D | 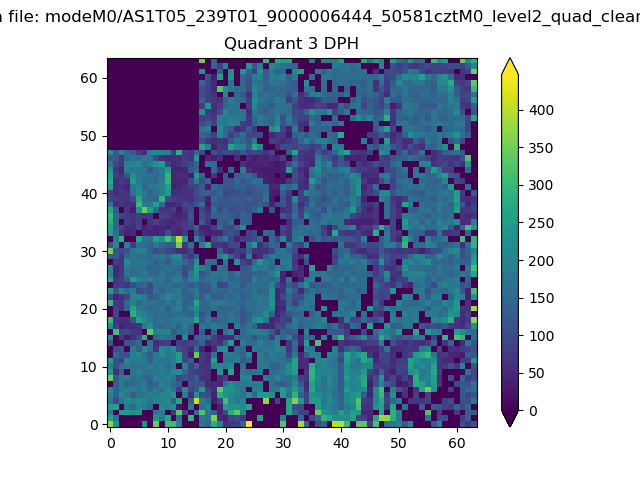 |
 |
Quadrant C |
| Plot type | Count rate plots | Images |
|---|---|---|
| Comparison with Poisson distribution Blue bars denote a histogram of data divided into 1 sec bins. Red curve is a Poisson curve with rate = median count rate of data. |
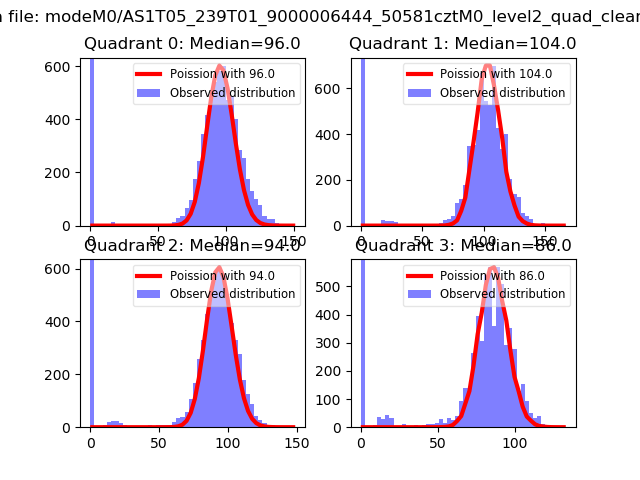 |
 |
| Quadrant-wise count rates Data is divided into 100 sec bins |
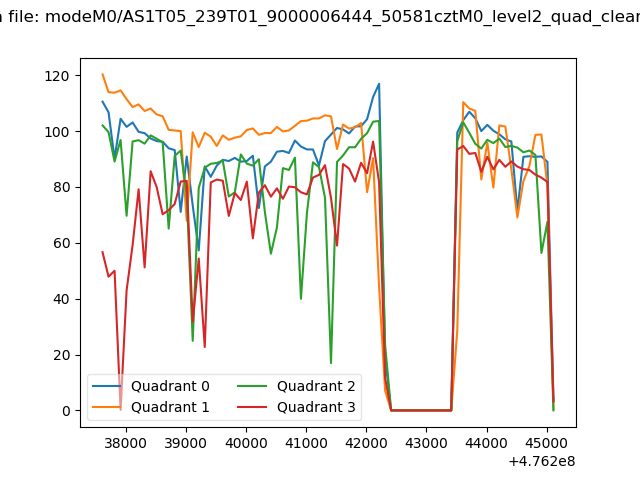 |
|
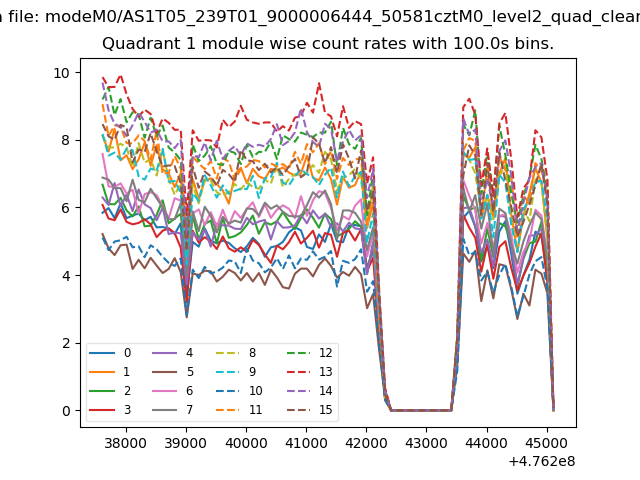
| Module-wise count rates for Quadrant A Data is divided into 100 sec bins |
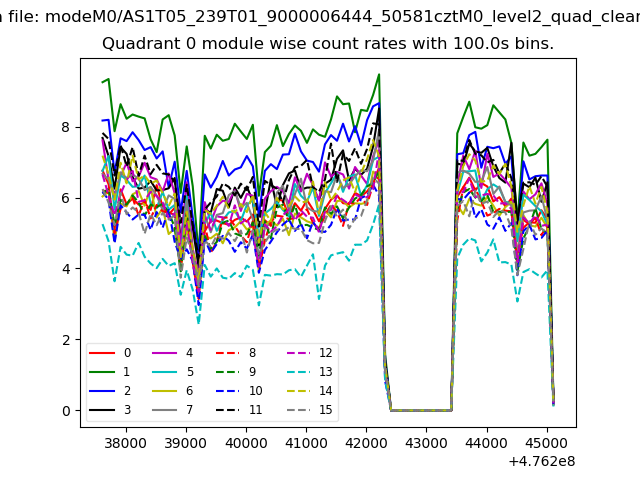 |
 |
| Module-wise count rates for Quadrant B Data is divided into 100 sec bins |
 |
 |
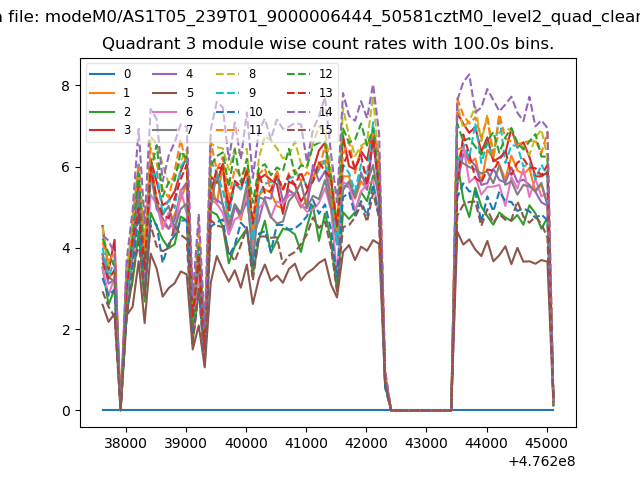
| Module-wise count rates for Quadrant C Data is divided into 100 sec bins |
 |
 |
| Module-wise count rates for Quadrant D Data is divided into 100 sec bins |
 |
 |
| Parameter | Plot |
|---|---|
| CZT HV Monitor | 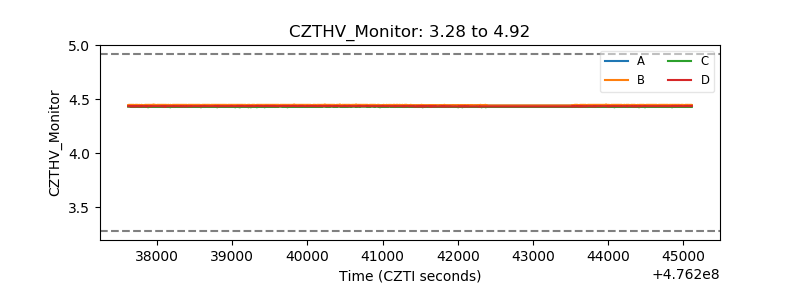 |
| D_VDD | 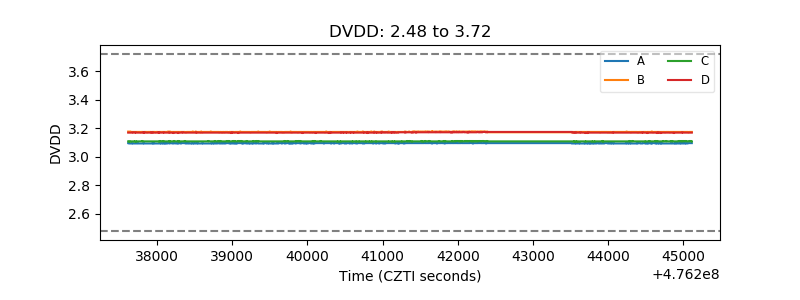 |
| Temperature 1 | 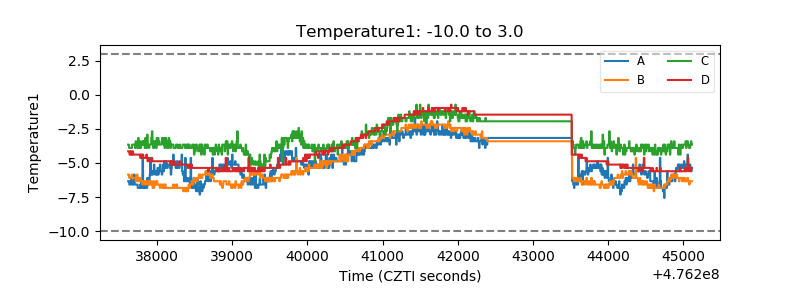 |
| Veto HV Monitor | 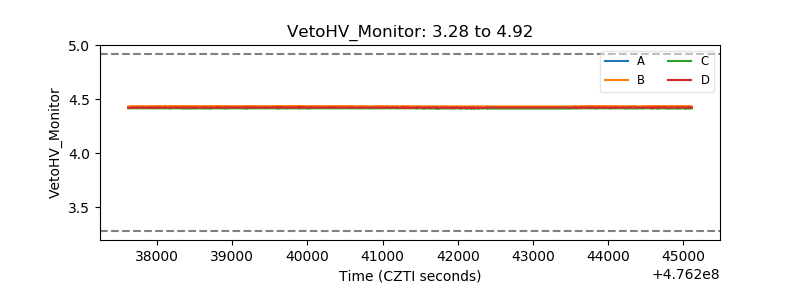 |
| Veto LLD | 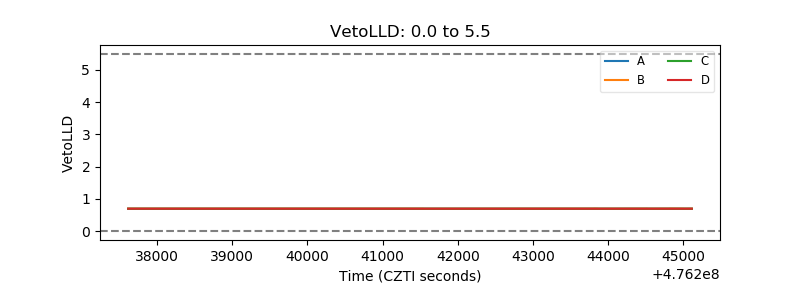 |
| Alpha Counter | 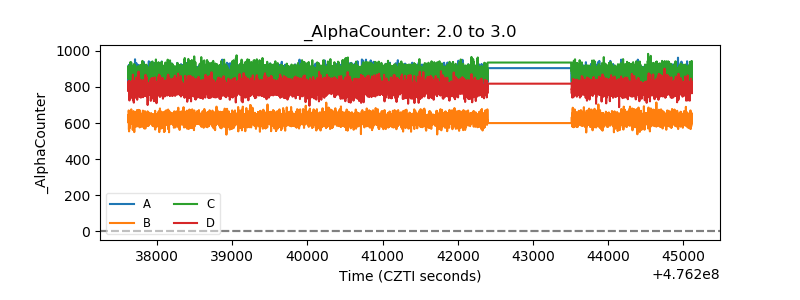 |
| _CPM_Rate | 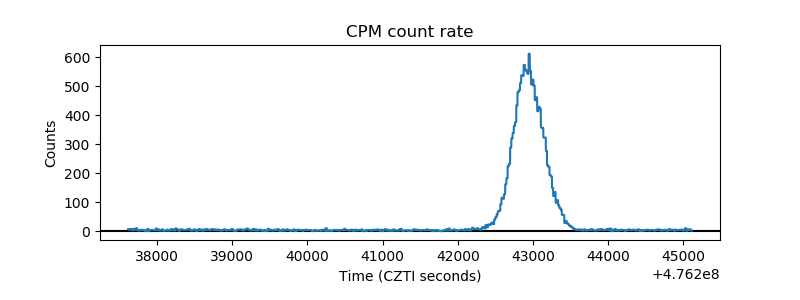 |
| CZT Counter | 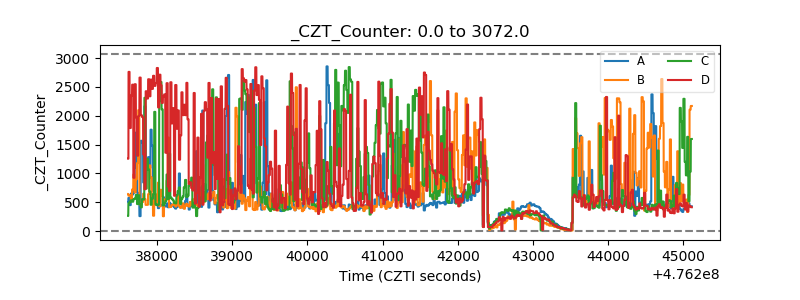 |
| +2.5 Volts monitor | 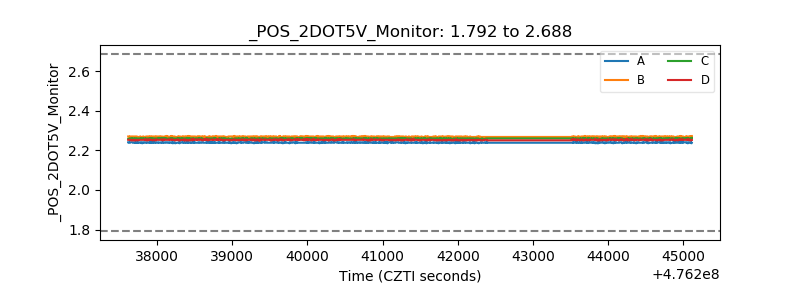 |
| +5 Volts monitor |  |
| _ROLL_ROT | 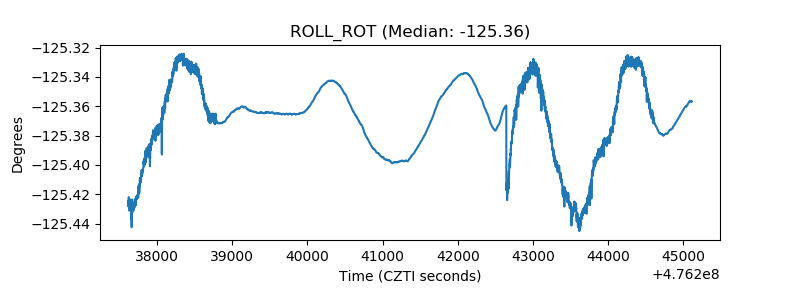 |
| _Roll_DEC | 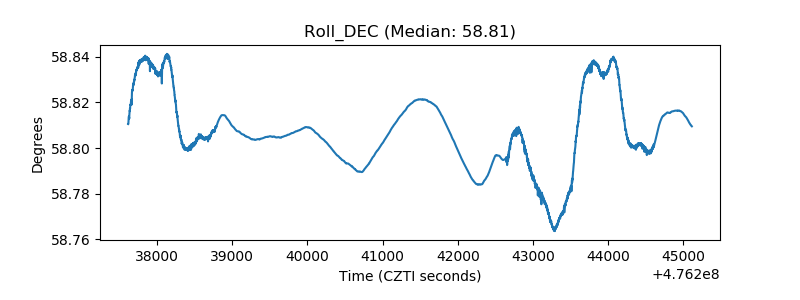 |
| _Roll_RA | 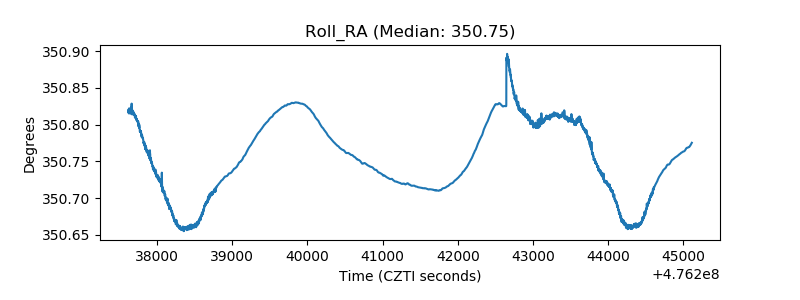 |
| Veto Counter | 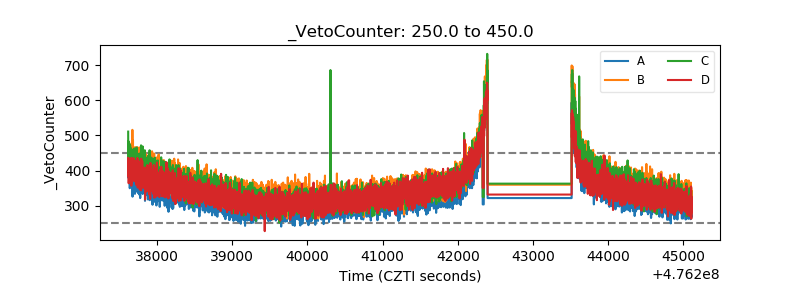 |