| Param | Original file | Final file |
|---|---|---|
| Filename | modeM0/AS1T05_239T01_9000006444_50582cztM0_level2.fits | modeM0/AS1T05_239T01_9000006444_50582cztM0_level2_quad_clean.evt |
| Size (bytes) | 630,509,760 | 93,447,360 |
| Size | 601.3 MB | 89.1 MB |
| Events in quadrant A | 4,039,792 | 630,498 |
| Events in quadrant B | 7,286,963 | 604,746 |
| Events in quadrant C | 6,648,236 | 557,993 |
| Events in quadrant D | 4,835,591 | 561,064 |
| Mode M0 | |||
|---|---|---|---|
| Quadrant | BADHDUFLAG | Total packets | Discarded packets |
| A | 0 | 16573 | 2 |
| B | 0 | 26393 | 2 |
| C | 0 | 24553 | 8 |
| D | 0 | 19422 | 2 |
| Mode M9 | |||
|---|---|---|---|
| Quadrant | BADHDUFLAG | Total packets | Discarded packets |
| A | 0 | 16 | 0 |
| B | 0 | 17 | 0 |
| C | 0 | 17 | 0 |
| D | 0 | 17 | 0 |
| Mode SS | |||
|---|---|---|---|
| Quadrant | BADHDUFLAG | Total packets | Discarded packets |
| A | 0 | 138 | 0 |
| B | 0 | 138 | 0 |
| C | 0 | 138 | 0 |
| D | 0 | 138 | 0 |
| Quadrant | Total seconds | Saturated seconds | Saturation percentage |
|---|---|---|---|
| A | 6820 | 257 | 3.768328% |
| B | 6820 | 1209 | 17.727273% |
| C | 6819 | 1030 | 15.104854% |
| D | 6819 | 442 | 6.481889% |
Noise dominated data is calculated using 1-second bins in cleaned event files. If a bin has >2000 counts, and if more than 50% of those come from <1% of pixels, then it is considered to be noise-dominated and hence unusable.
| Quadrant | # 1 sec bins | Bins with >0 counts | Bins with >2000 counts | High rate bins dominated by noise | Noise dominated (total time) | Noise dominated (detector-on time) | Marked lightcurve |
|---|---|---|---|---|---|---|---|
| A | 7810 | 6822 | 142 | 142 | 1.82% | 2.08% | 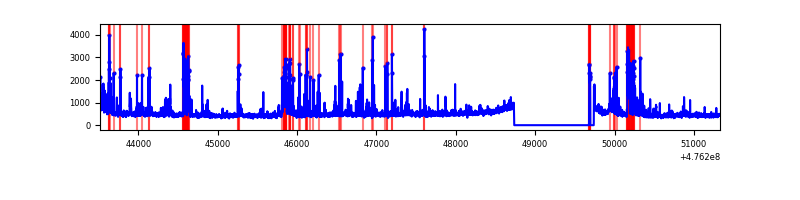 |
| B | 7810 | 6822 | 814 | 814 | 10.42% | 11.93% | 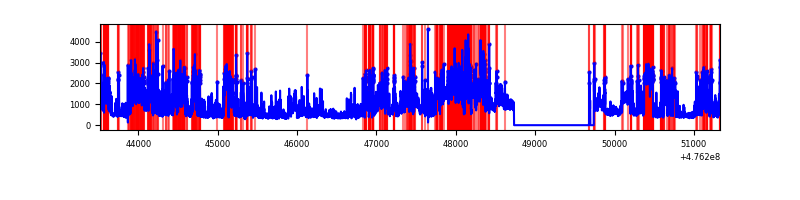 |
| C | 7809 | 6821 | 765 | 765 | 9.80% | 11.22% | 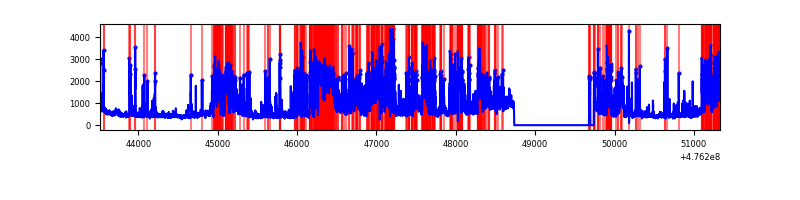 |
| D | 7809 | 6821 | 287 | 287 | 3.68% | 4.21% | 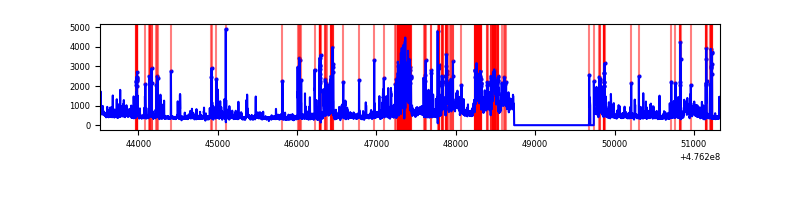 |
Top three noisy pixels from each quadrant. If the there are fewer than three noisy pixels in the level2.evt file, extra rows are filled as -1
| Pixel properties | Quadrant properties | ||||||
|---|---|---|---|---|---|---|---|
| Quadrant | DetID | PixID | Counts | Sigma | Mean | Median | Sigma |
| A | 4 | 249 | 307319 | 1730.78 | 716 | 697 | 177.2 |
| A | 4 | 3 | 267213 | 1504.39 | 716 | 697 | 177.2 |
| A | 8 | 38 | 224337 | 1262.37 | 716 | 697 | 177.2 |
| B | 5 | 172 | 1335318 | 9282.73 | 679 | 657 | 143.8 |
| B | 4 | 170 | 1120403 | 7787.97 | 679 | 657 | 143.8 |
| B | 7 | 0 | 862656 | 5995.31 | 679 | 657 | 143.8 |
| C | 15 | 196 | 1905090 | 10226.84 | 672 | 667 | 186.2 |
| C | 15 | 195 | 837438 | 4493.5 | 672 | 667 | 186.2 |
| C | 15 | 236 | 242528 | 1298.8 | 672 | 667 | 186.2 |
| D | 2 | 249 | 513905 | 2718.55 | 683 | 660 | 188.8 |
| D | 8 | 48 | 425535 | 2250.47 | 683 | 660 | 188.8 |
| D | 8 | 246 | 232780 | 1229.49 | 683 | 660 | 188.8 |
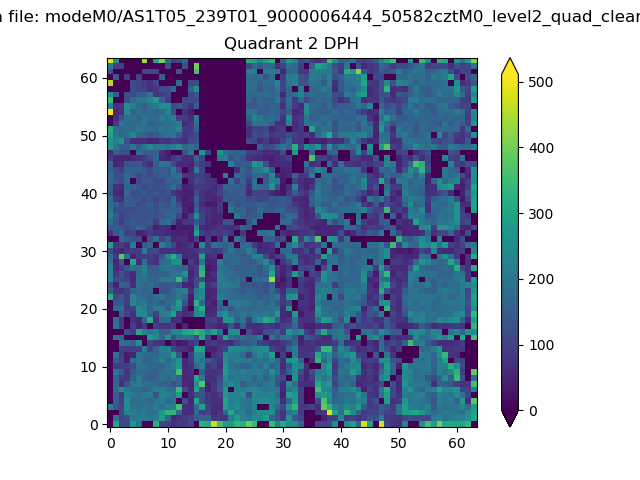
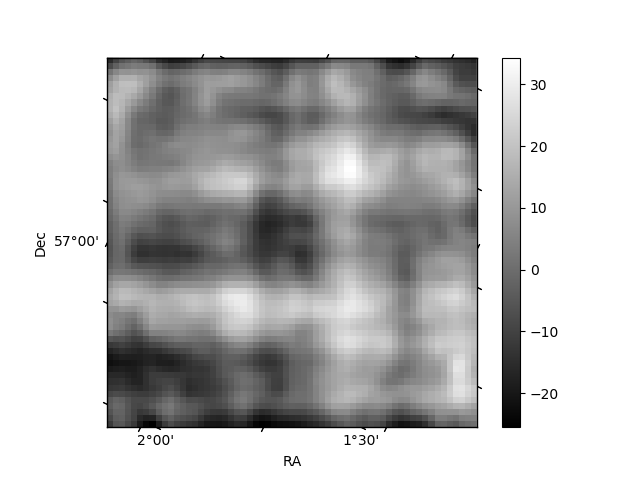
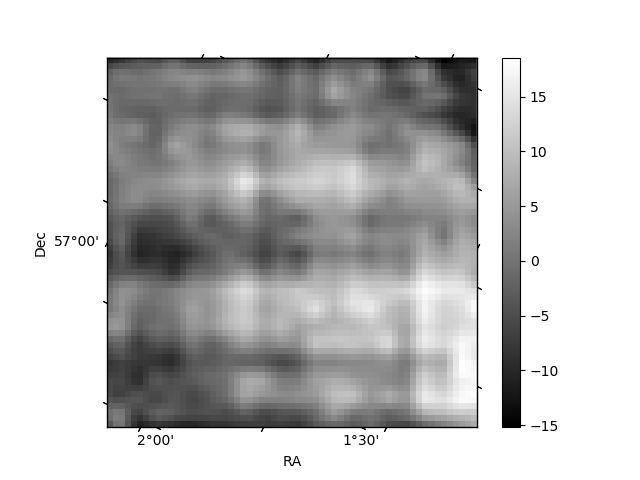
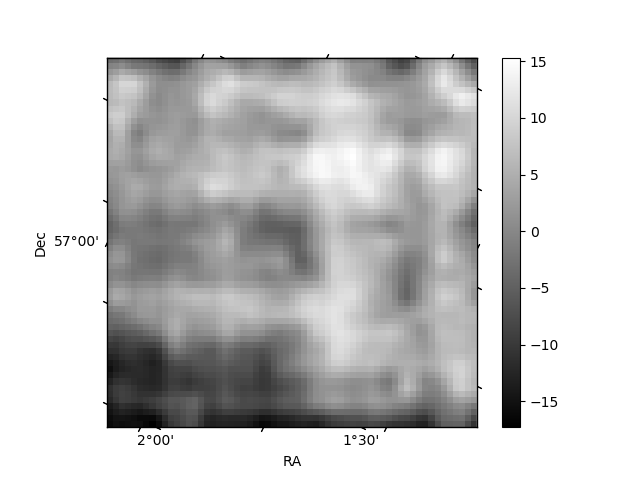
Histogram calculated using DETX and DETY for each event in the final _common_clean file
| Quadrant A | 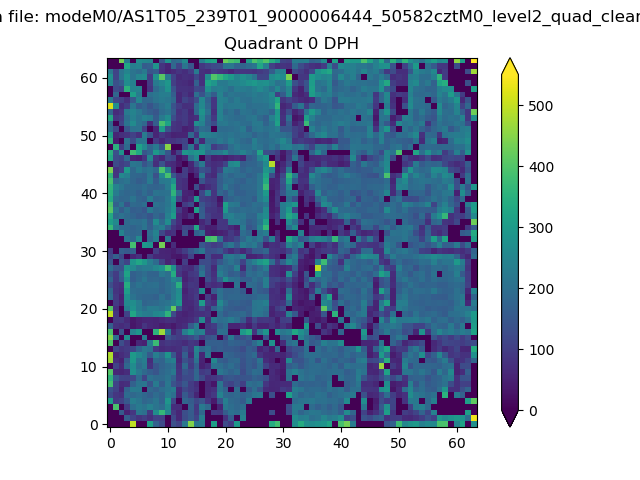 |
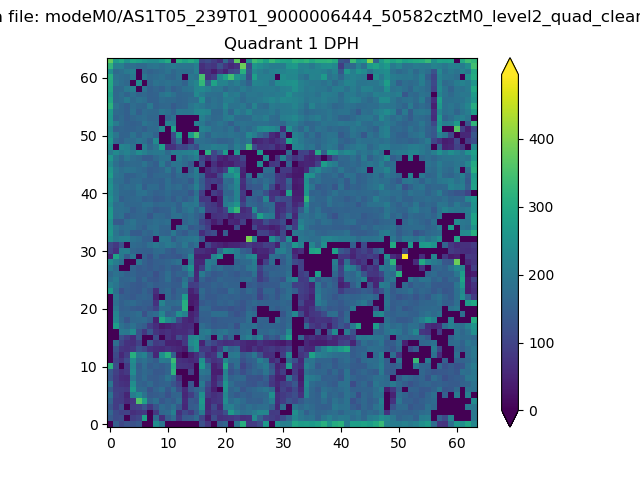 |
Quadrant B |
|---|---|---|---|
| Quadrant D | 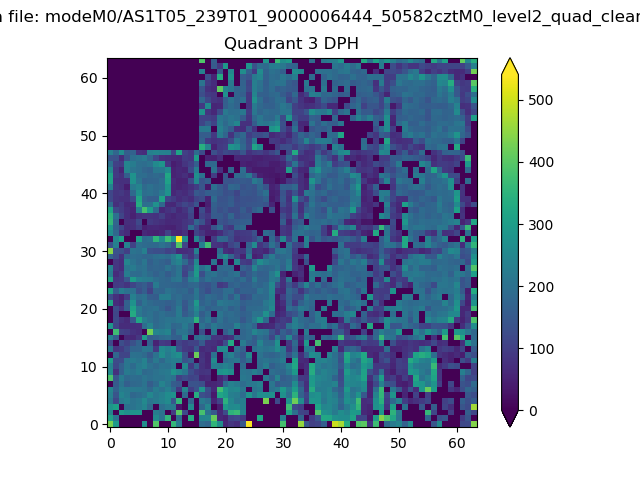 |
 |
Quadrant C |
| Plot type | Count rate plots | Images |
|---|---|---|
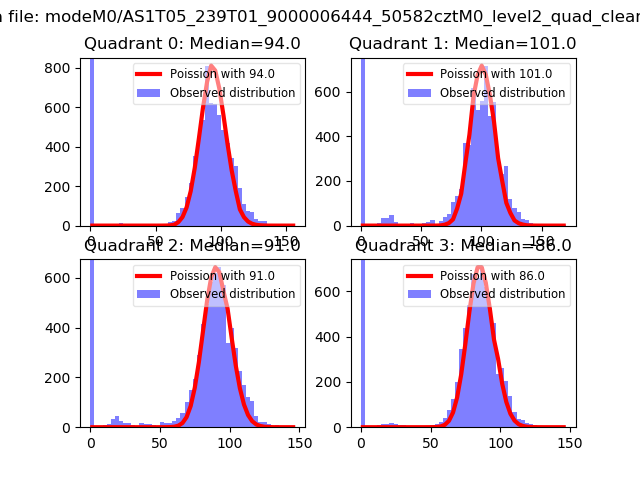
| Comparison with Poisson distribution Blue bars denote a histogram of data divided into 1 sec bins. Red curve is a Poisson curve with rate = median count rate of data. |
 |
 |
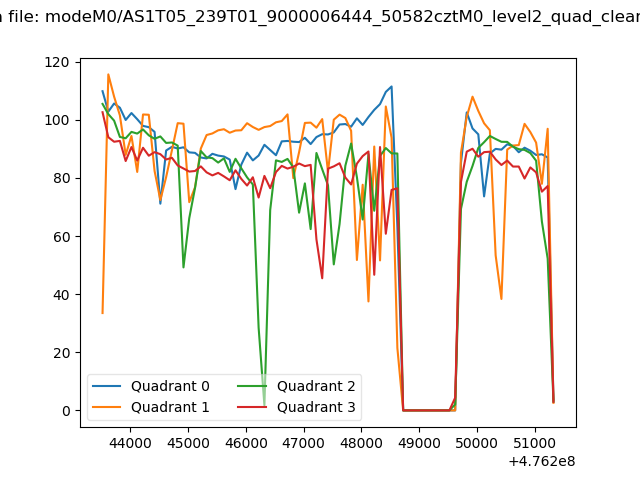
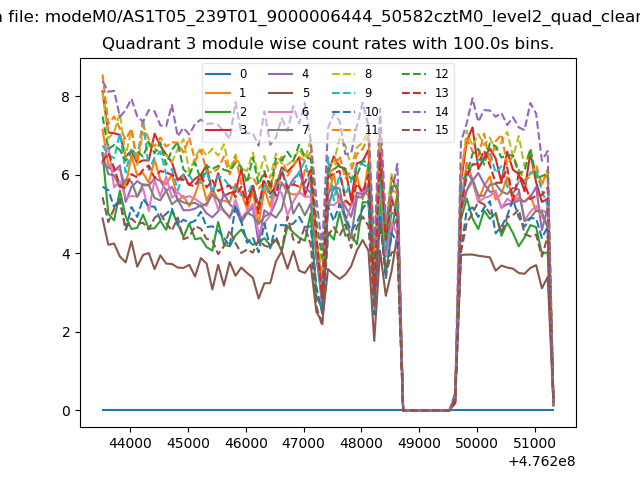
| Quadrant-wise count rates Data is divided into 100 sec bins |
 |
|
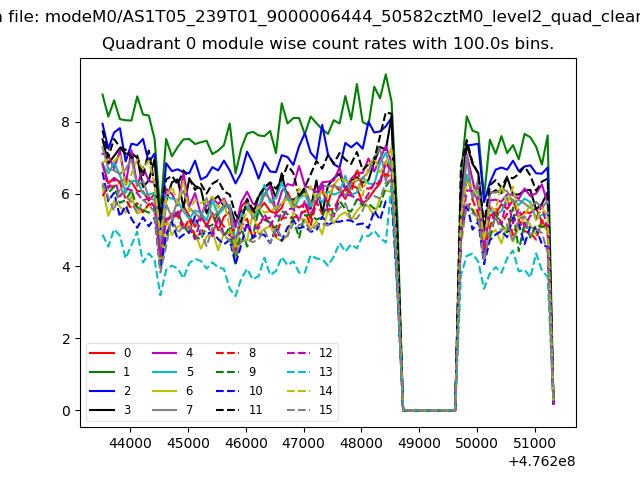
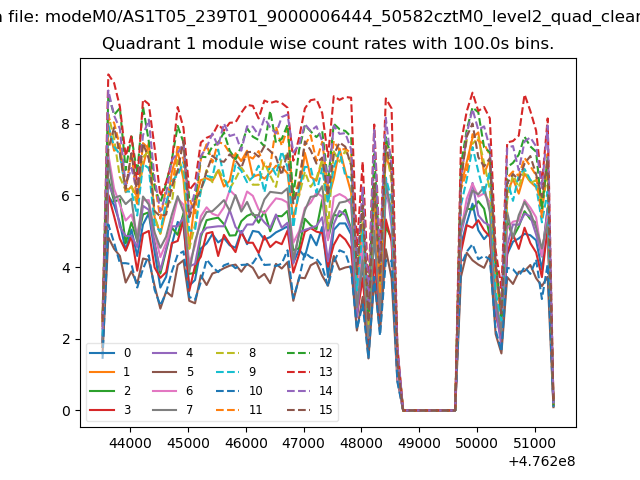
| Module-wise count rates for Quadrant A Data is divided into 100 sec bins |
 |
 |
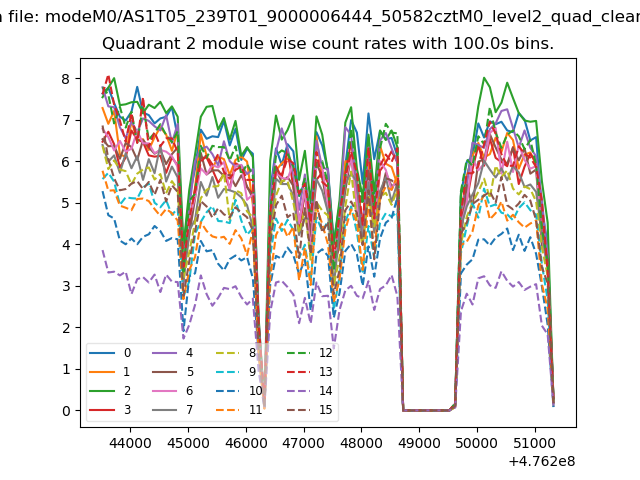
| Module-wise count rates for Quadrant B Data is divided into 100 sec bins |
 |
 |
| Module-wise count rates for Quadrant C Data is divided into 100 sec bins |
 |
 |
| Module-wise count rates for Quadrant D Data is divided into 100 sec bins |
 |
 |
| Parameter | Plot |
|---|---|
| CZT HV Monitor | 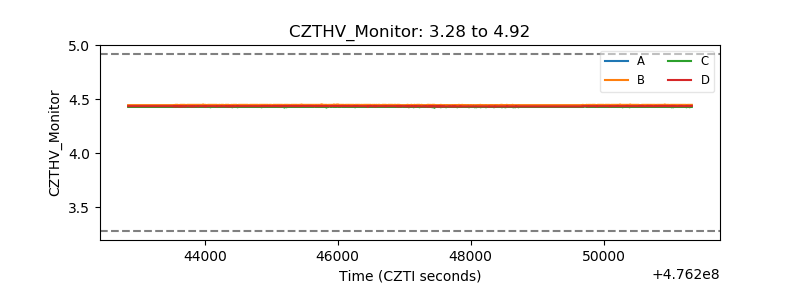 |
| D_VDD | 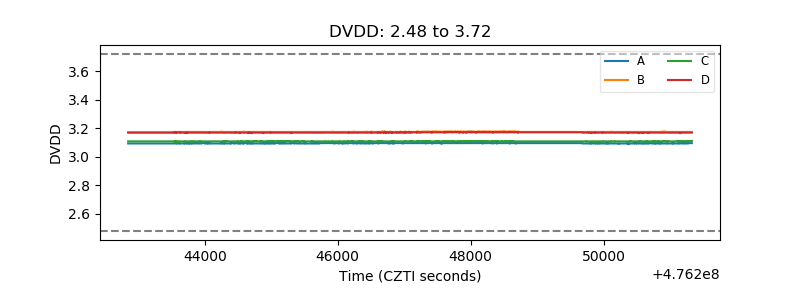 |
| Temperature 1 | 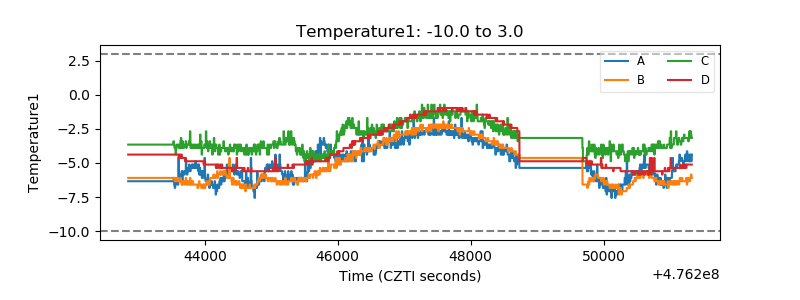 |
| Veto HV Monitor | 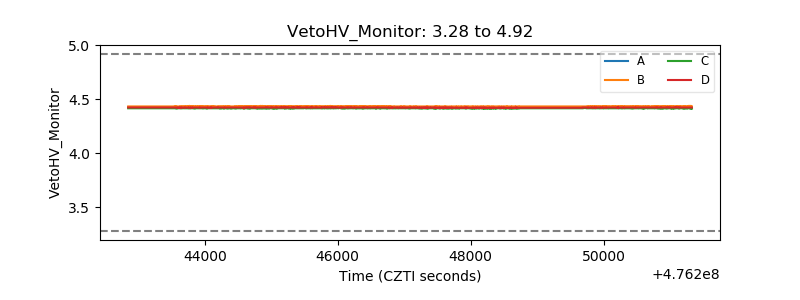 |
| Veto LLD | 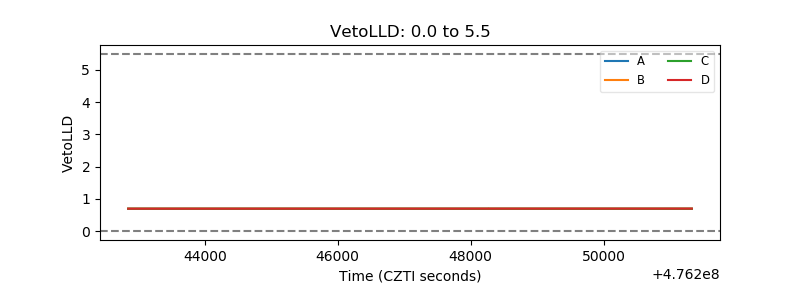 |
| Alpha Counter | 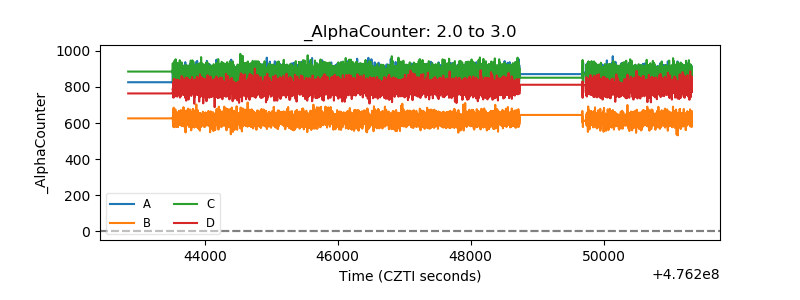 |
| _CPM_Rate | 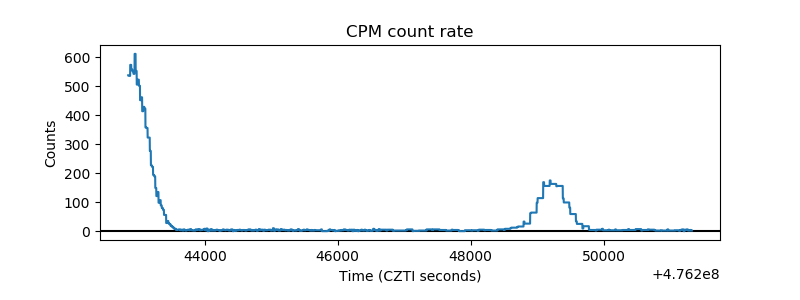 |
| CZT Counter | 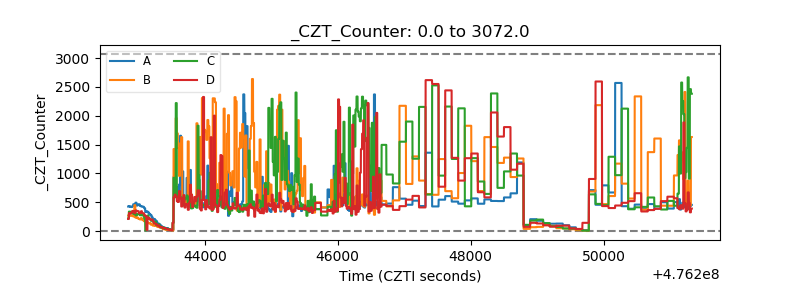 |
| +2.5 Volts monitor |  |
| +5 Volts monitor | 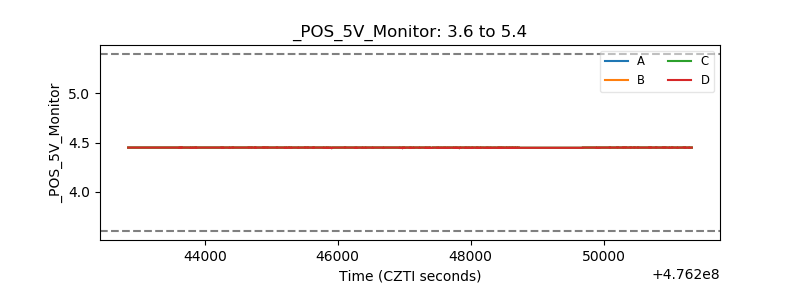 |
| _ROLL_ROT | 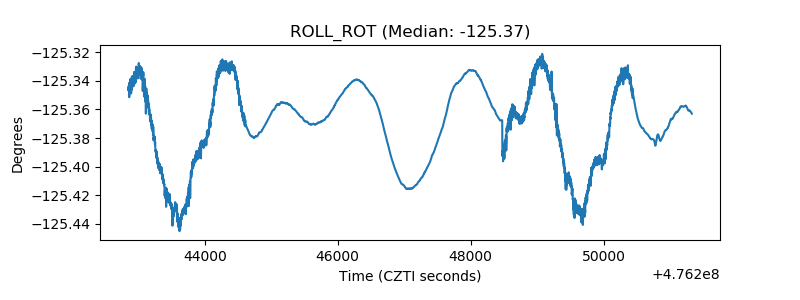 |
| _Roll_DEC | 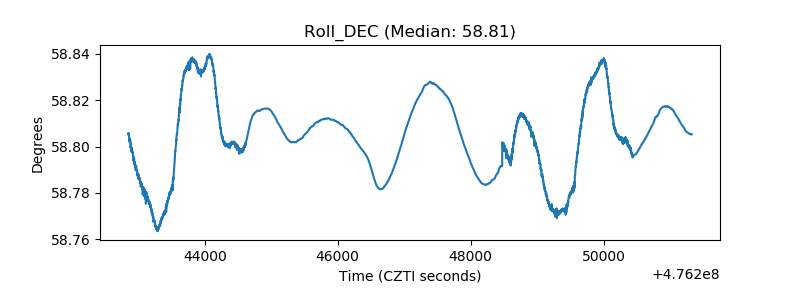 |
| _Roll_RA | 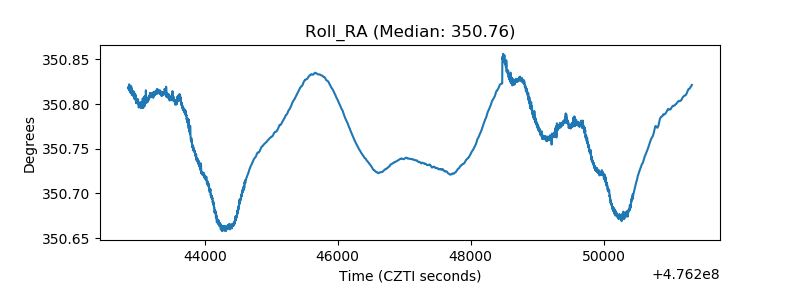 |
| Veto Counter | 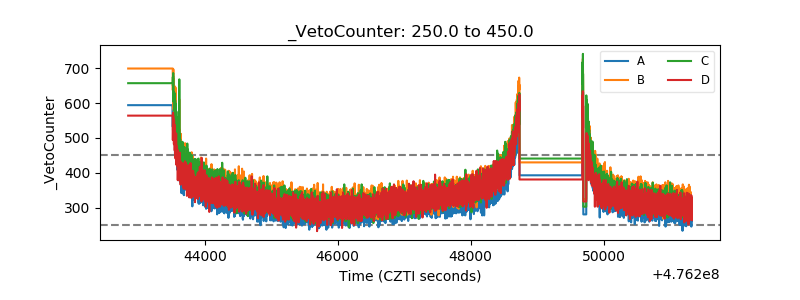 |