| Param | Original file | Final file |
|---|---|---|
| Filename | modeM0/AS1T05_239T01_9000006444_50583cztM0_level2.fits | modeM0/AS1T05_239T01_9000006444_50583cztM0_level2_quad_clean.evt |
| Size (bytes) | 654,713,280 | 86,564,160 |
| Size | 624.4 MB | 82.6 MB |
| Events in quadrant A | 3,422,652 | 596,006 |
| Events in quadrant B | 6,175,193 | 591,531 |
| Events in quadrant C | 8,080,858 | 466,129 |
| Events in quadrant D | 6,047,446 | 508,941 |
| Mode M0 | |||
|---|---|---|---|
| Quadrant | BADHDUFLAG | Total packets | Discarded packets |
| A | 0 | 14832 | 1 |
| B | 0 | 22966 | 1 |
| C | 0 | 28629 | 7 |
| D | 0 | 22568 | 1 |
| Mode M9 | |||
|---|---|---|---|
| Quadrant | BADHDUFLAG | Total packets | Discarded packets |
| A | 0 | 5 | 0 |
| B | 0 | 5 | 0 |
| C | 0 | 5 | 0 |
| D | 0 | 5 | 0 |
| Mode SS | |||
|---|---|---|---|
| Quadrant | BADHDUFLAG | Total packets | Discarded packets |
| A | 0 | 134 | 0 |
| B | 0 | 134 | 0 |
| C | 0 | 134 | 0 |
| D | 0 | 134 | 0 |
| Quadrant | Total seconds | Saturated seconds | Saturation percentage |
|---|---|---|---|
| A | 6570 | 192 | 2.922374% |
| B | 6570 | 853 | 12.983257% |
| C | 6569 | 1627 | 24.767849% |
| D | 6570 | 689 | 10.487062% |
Noise dominated data is calculated using 1-second bins in cleaned event files. If a bin has >2000 counts, and if more than 50% of those come from <1% of pixels, then it is considered to be noise-dominated and hence unusable.
| Quadrant | # 1 sec bins | Bins with >0 counts | Bins with >2000 counts | High rate bins dominated by noise | Noise dominated (total time) | Noise dominated (detector-on time) | Marked lightcurve |
|---|---|---|---|---|---|---|---|
| A | 7115 | 6571 | 49 | 49 | 0.69% | 0.75% | 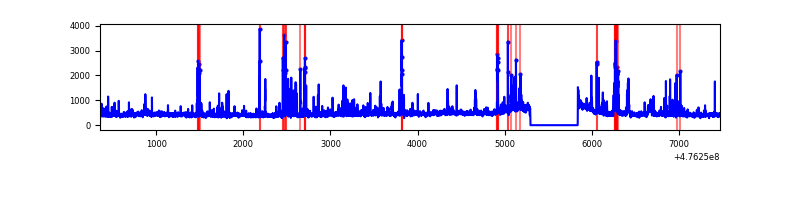 |
| B | 7115 | 6571 | 465 | 465 | 6.54% | 7.08% | 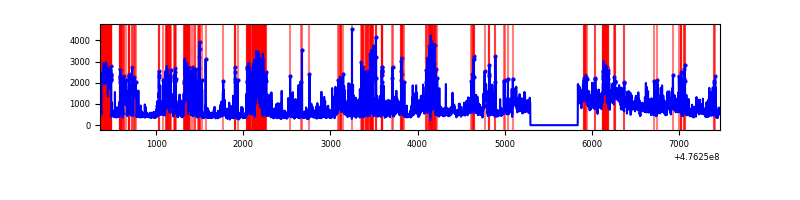 |
| C | 7114 | 6570 | 1414 | 1414 | 19.88% | 21.52% | 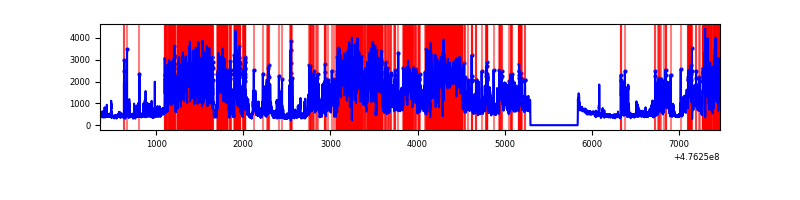 |
| D | 7115 | 6571 | 558 | 558 | 7.84% | 8.49% | 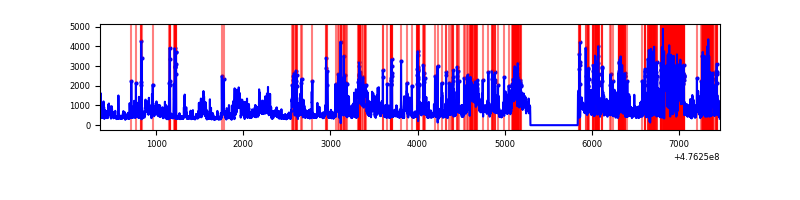 |
Top three noisy pixels from each quadrant. If the there are fewer than three noisy pixels in the level2.evt file, extra rows are filled as -1
| Pixel properties | Quadrant properties | ||||||
|---|---|---|---|---|---|---|---|
| Quadrant | DetID | PixID | Counts | Sigma | Mean | Median | Sigma |
| A | 4 | 3 | 172169 | 1026.23 | 680 | 664 | 167.1 |
| A | 4 | 249 | 83040 | 492.91 | 680 | 664 | 167.1 |
| A | 5 | 240 | 77621 | 460.49 | 680 | 664 | 167.1 |
| B | 4 | 170 | 1766070 | 12663.76 | 651 | 629 | 139.4 |
| B | 7 | 0 | 623825 | 4470.27 | 651 | 629 | 139.4 |
| B | 5 | 172 | 448071 | 3209.56 | 651 | 629 | 139.4 |
| C | 15 | 196 | 2885900 | 17520.66 | 600 | 597 | 164.7 |
| C | 15 | 195 | 1637427 | 9939.45 | 600 | 597 | 164.7 |
| C | 15 | 147 | 261176 | 1582.33 | 600 | 597 | 164.7 |
| D | 1 | 7 | 1119361 | 6326.59 | 637 | 614 | 176.8 |
| D | 8 | 246 | 720477 | 4070.87 | 637 | 614 | 176.8 |
| D | 8 | 48 | 572645 | 3234.87 | 637 | 614 | 176.8 |
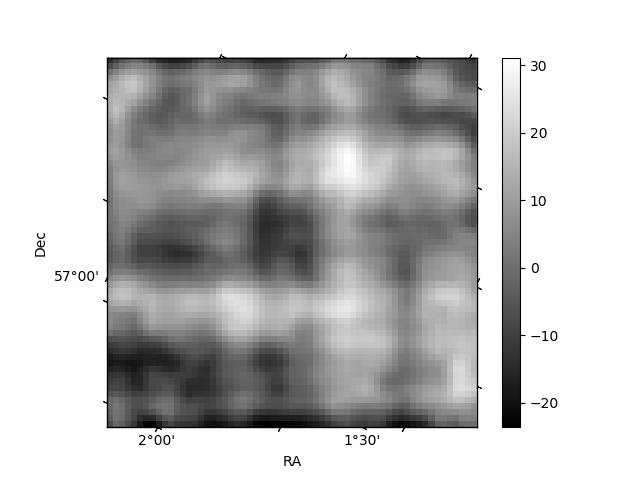
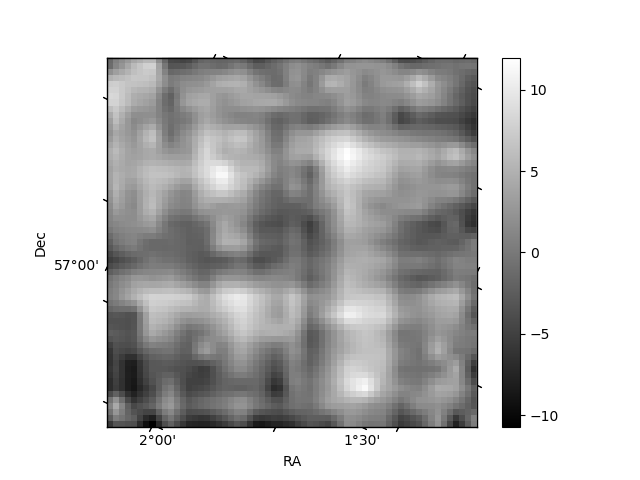
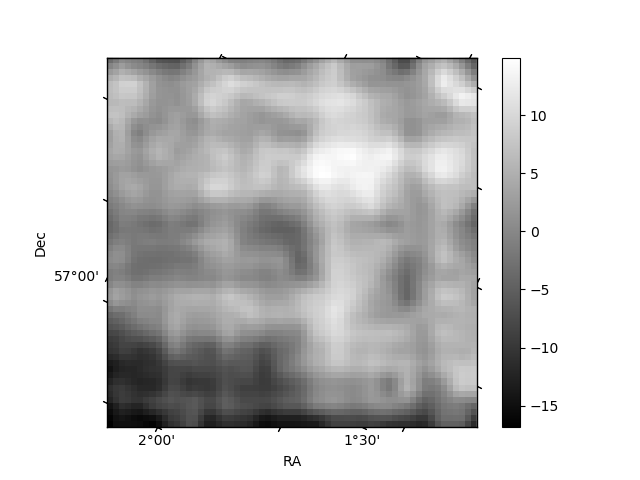
Histogram calculated using DETX and DETY for each event in the final _common_clean file
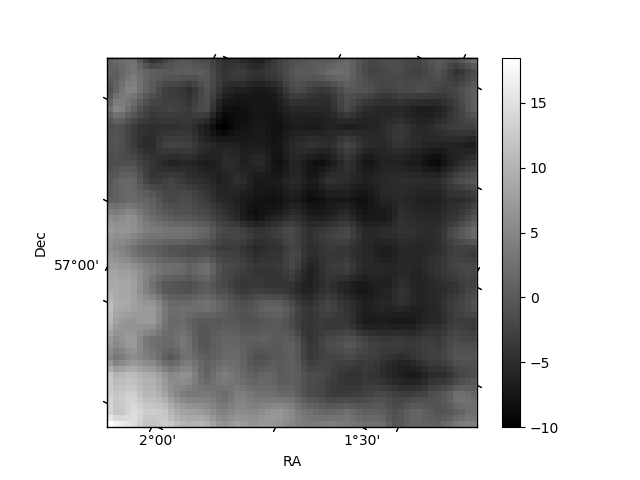
| Quadrant A | 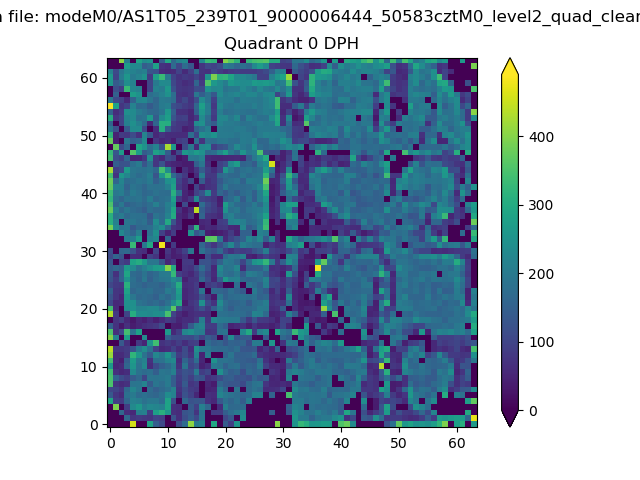 |
 |
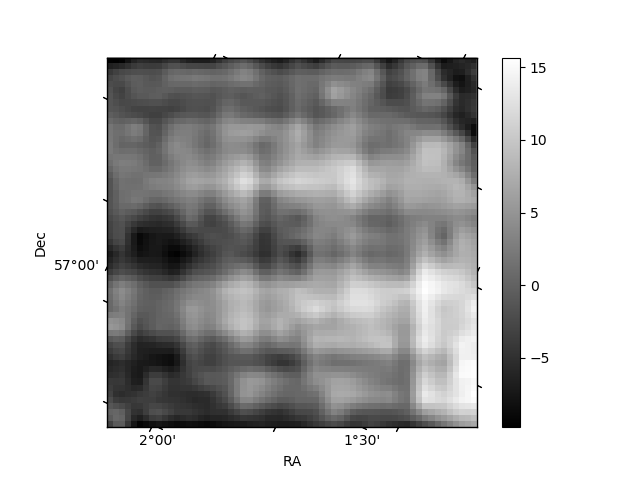
Quadrant B |
|---|---|---|---|
| Quadrant D | 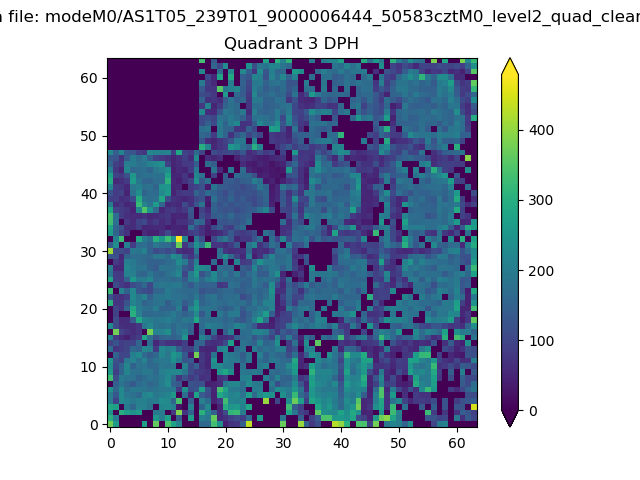 |
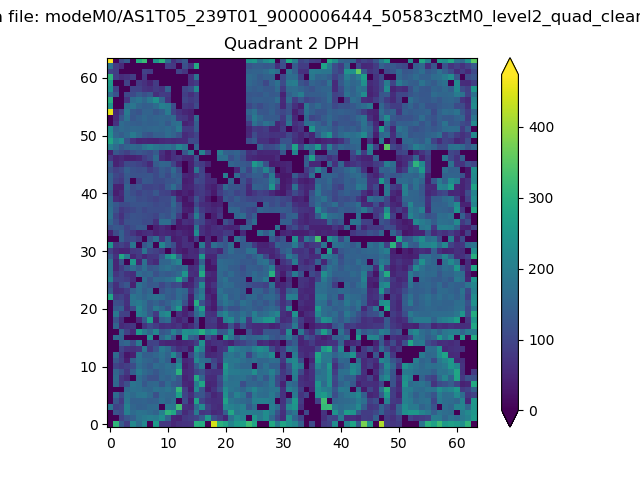 |
Quadrant C |
| Plot type | Count rate plots | Images |
|---|---|---|
| Comparison with Poisson distribution Blue bars denote a histogram of data divided into 1 sec bins. Red curve is a Poisson curve with rate = median count rate of data. |
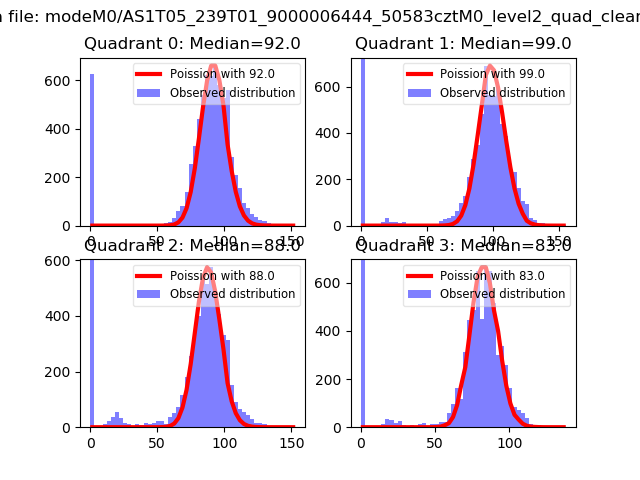 |
 |
| Quadrant-wise count rates Data is divided into 100 sec bins |
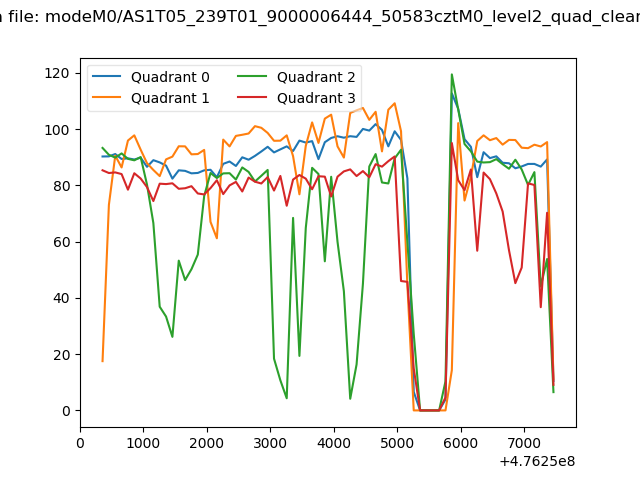 |
|
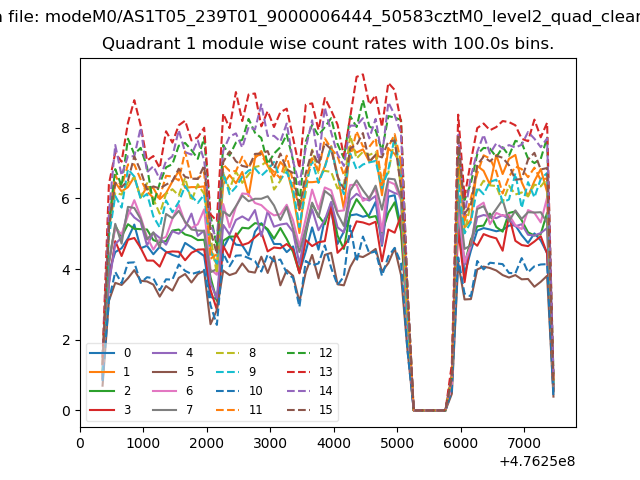
| Module-wise count rates for Quadrant A Data is divided into 100 sec bins |
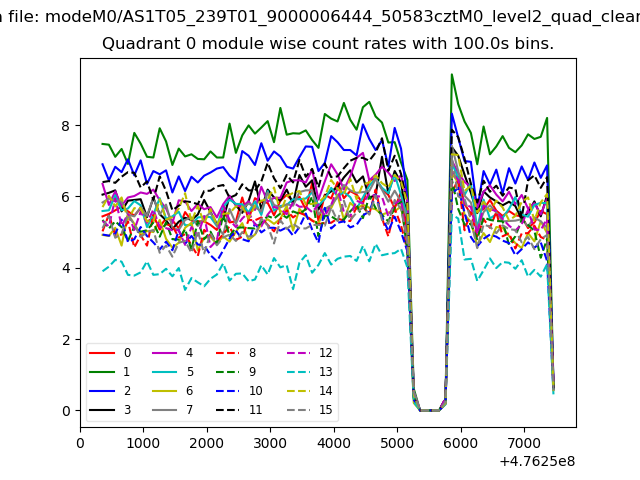 |
 |
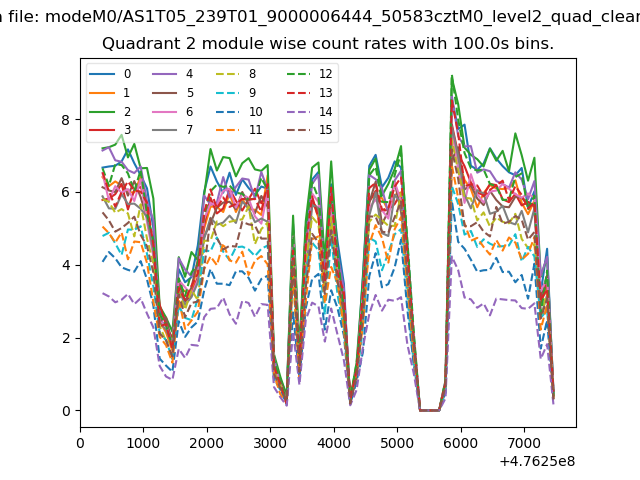
| Module-wise count rates for Quadrant B Data is divided into 100 sec bins |
 |
 |
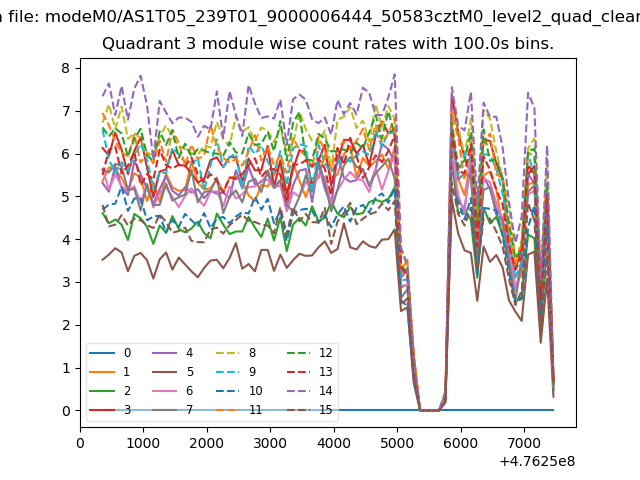
| Module-wise count rates for Quadrant C Data is divided into 100 sec bins |
 |
 |
| Module-wise count rates for Quadrant D Data is divided into 100 sec bins |
 |
 |
| Parameter | Plot |
|---|---|
| CZT HV Monitor | 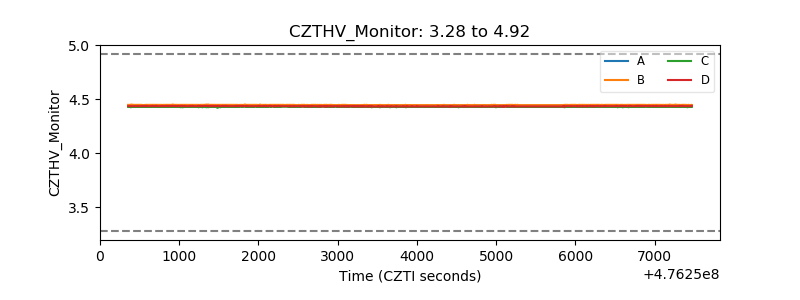 |
| D_VDD | 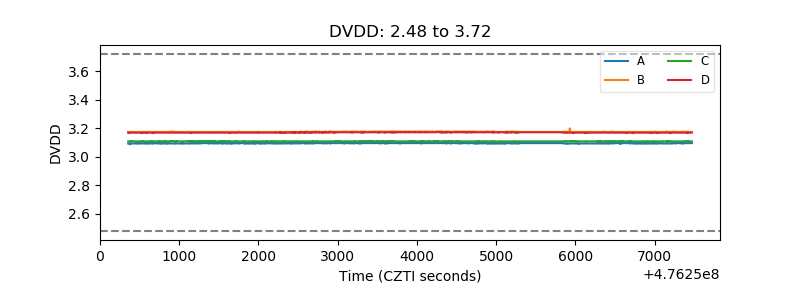 |
| Temperature 1 | 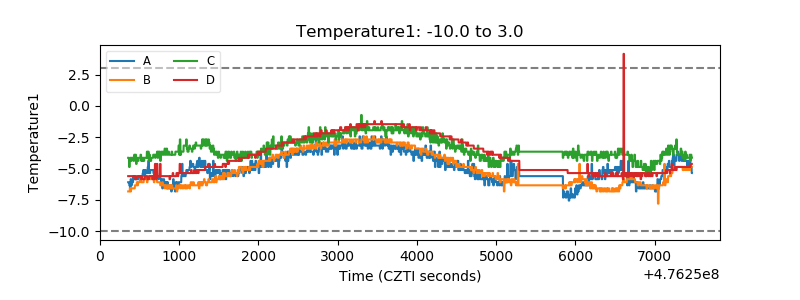 |
| Veto HV Monitor | 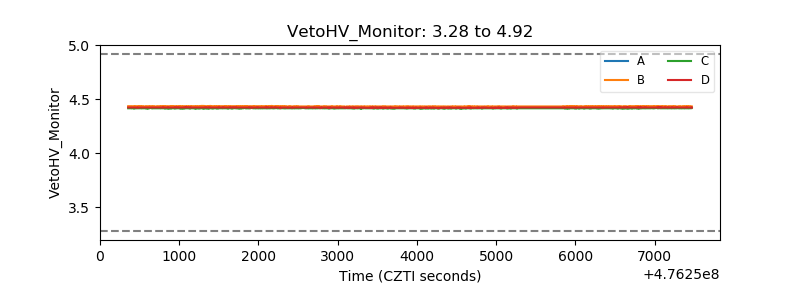 |
| Veto LLD | 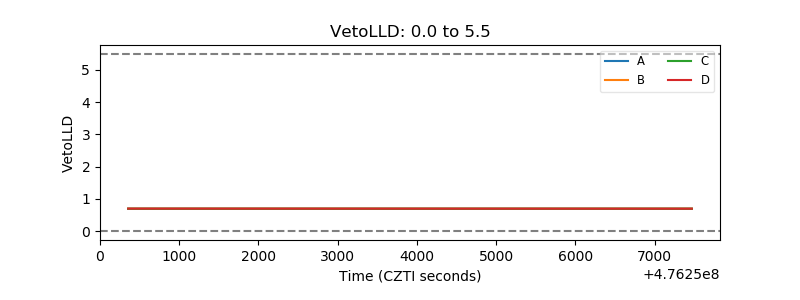 |
| Alpha Counter | 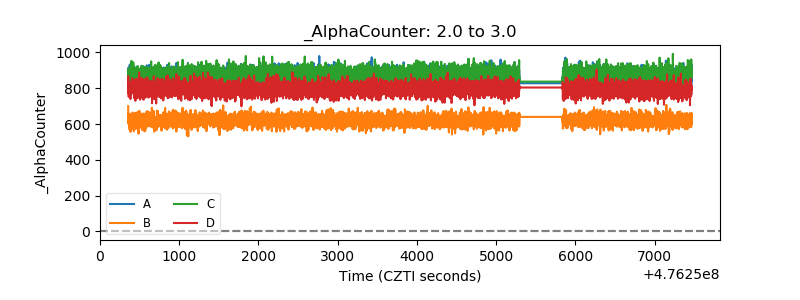 |
| _CPM_Rate | 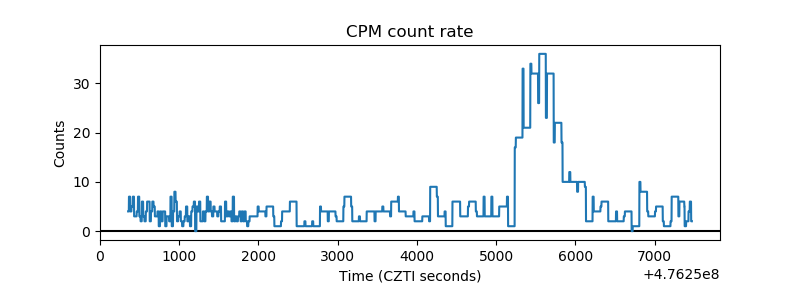 |
| CZT Counter | 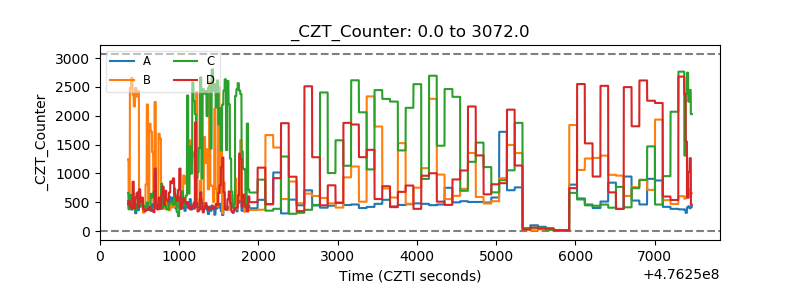 |
| +2.5 Volts monitor | 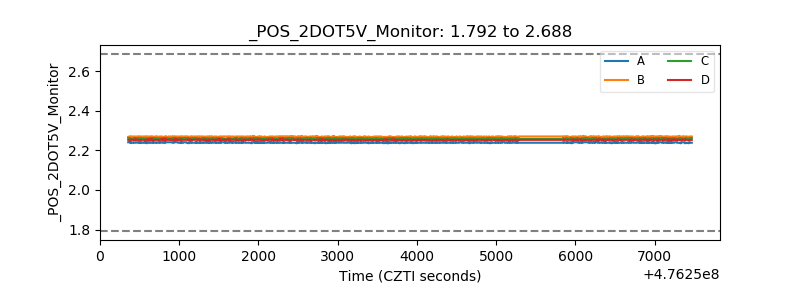 |
| +5 Volts monitor |  |
| _ROLL_ROT | 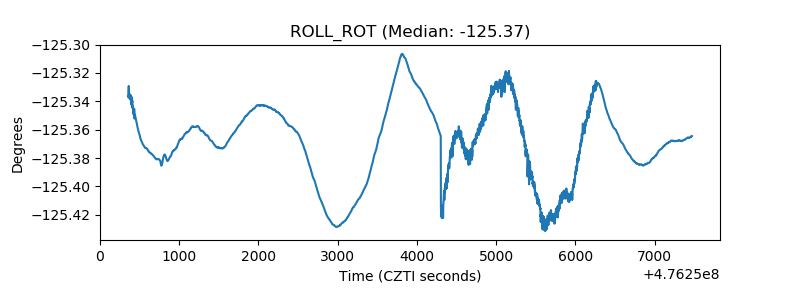 |
| _Roll_DEC | 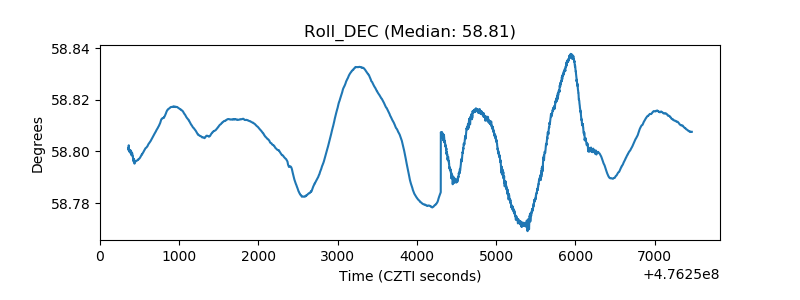 |
| _Roll_RA | 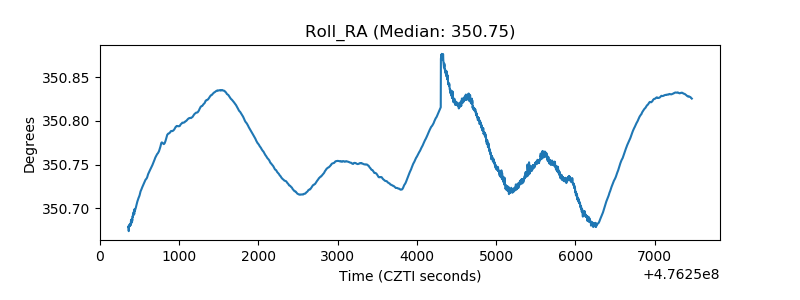 |
| Veto Counter | 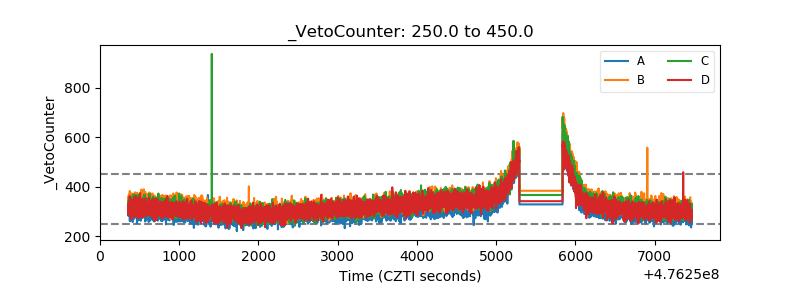 |