| Param | Original file | Final file |
|---|---|---|
| Filename | modeM0/AS1T05_239T01_9000006444_50585cztM0_level2.fits | modeM0/AS1T05_239T01_9000006444_50585cztM0_level2_quad_clean.evt |
| Size (bytes) | 822,559,680 | 98,121,600 |
| Size | 784.5 MB | 93.6 MB |
| Events in quadrant A | 4,584,001 | 671,907 |
| Events in quadrant B | 4,891,742 | 724,035 |
| Events in quadrant C | 10,753,338 | 488,628 |
| Events in quadrant D | 9,639,398 | 563,084 |
| Mode M0 | |||
|---|---|---|---|
| Quadrant | BADHDUFLAG | Total packets | Discarded packets |
| A | 0 | 18792 | 0 |
| B | 0 | 19564 | 0 |
| C | 0 | 37079 | 0 |
| D | 0 | 33965 | 6 |
| Mode SS | |||
|---|---|---|---|
| Quadrant | BADHDUFLAG | Total packets | Discarded packets |
| A | 0 | 152 | 0 |
| B | 0 | 152 | 0 |
| C | 0 | 152 | 0 |
| D | 0 | 152 | 0 |
| Quadrant | Total seconds | Saturated seconds | Saturation percentage |
|---|---|---|---|
| A | 7511 | 176 | 2.343230% |
| B | 7511 | 268 | 3.568100% |
| C | 7511 | 2300 | 30.621755% |
| D | 7511 | 927 | 12.341899% |
Noise dominated data is calculated using 1-second bins in cleaned event files. If a bin has >2000 counts, and if more than 50% of those come from <1% of pixels, then it is considered to be noise-dominated and hence unusable.
| Quadrant | # 1 sec bins | Bins with >0 counts | Bins with >2000 counts | High rate bins dominated by noise | Noise dominated (total time) | Noise dominated (detector-on time) | Marked lightcurve |
|---|---|---|---|---|---|---|---|
| A | 7511 | 7511 | 96 | 96 | 1.28% | 1.28% | 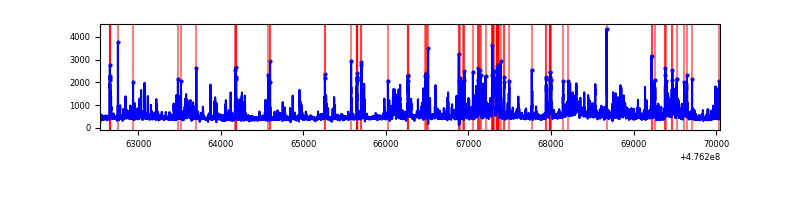 |
| B | 7511 | 7511 | 190 | 190 | 2.53% | 2.53% | 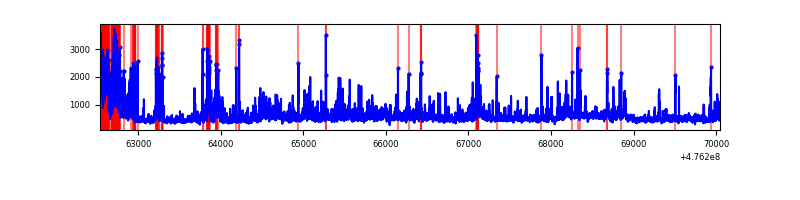 |
| C | 7511 | 7511 | 2014 | 2014 | 26.81% | 26.81% | 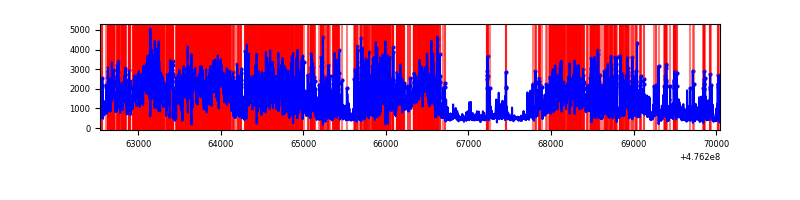 |
| D | 7511 | 7511 | 975 | 975 | 12.98% | 12.98% | 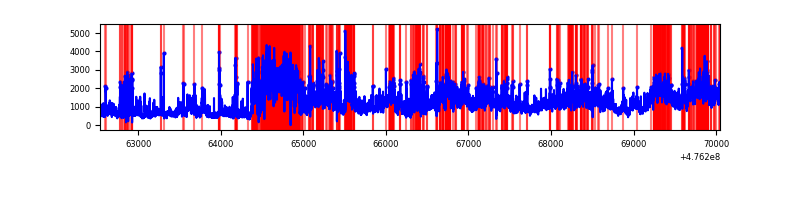 |
Top three noisy pixels from each quadrant. If the there are fewer than three noisy pixels in the level2.evt file, extra rows are filled as -1
| Pixel properties | Quadrant properties | ||||||
|---|---|---|---|---|---|---|---|
| Quadrant | DetID | PixID | Counts | Sigma | Mean | Median | Sigma |
| A | 12 | 250 | 704884 | 3706.73 | 763 | 744 | 190.0 |
| A | 4 | 3 | 183705 | 963.14 | 763 | 744 | 190.0 |
| A | 10 | 253 | 134288 | 703.0 | 763 | 744 | 190.0 |
| B | 4 | 170 | 899711 | 5583.88 | 754 | 728 | 161.0 |
| B | 7 | 0 | 325570 | 2017.7 | 754 | 728 | 161.0 |
| B | 0 | 229 | 166792 | 1031.48 | 754 | 728 | 161.0 |
| C | 15 | 157 | 2571922 | 14030.06 | 663 | 660 | 183.3 |
| C | 15 | 174 | 1670796 | 9113.08 | 663 | 660 | 183.3 |
| C | 15 | 196 | 1174249 | 6403.67 | 663 | 660 | 183.3 |
| D | 7 | 61 | 3201650 | 16382.04 | 701 | 678 | 195.4 |
| D | 2 | 165 | 834474 | 4267.23 | 701 | 678 | 195.4 |
| D | 7 | 60 | 596994 | 3051.85 | 701 | 678 | 195.4 |
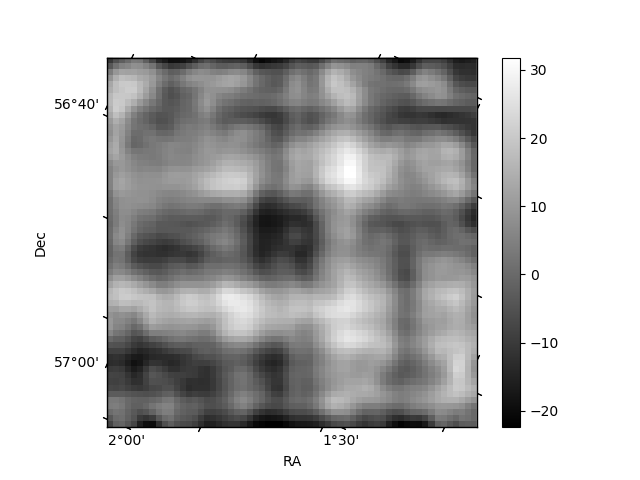
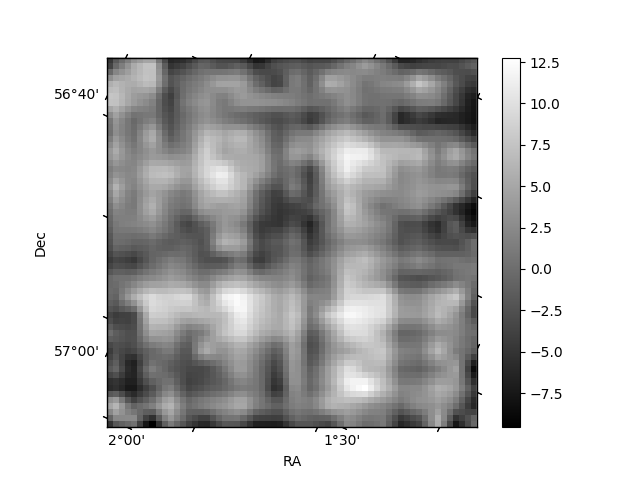
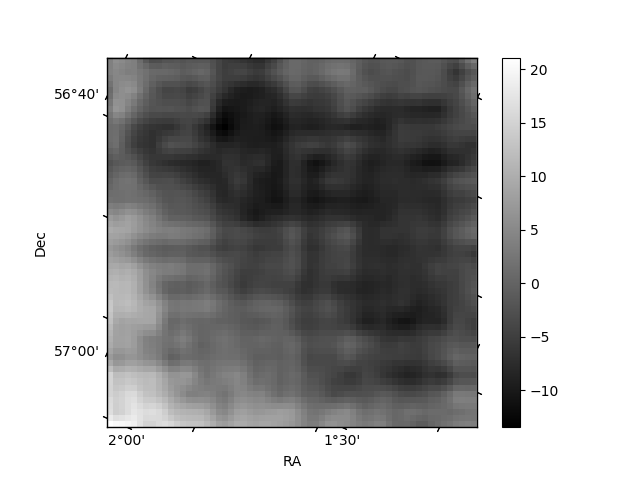
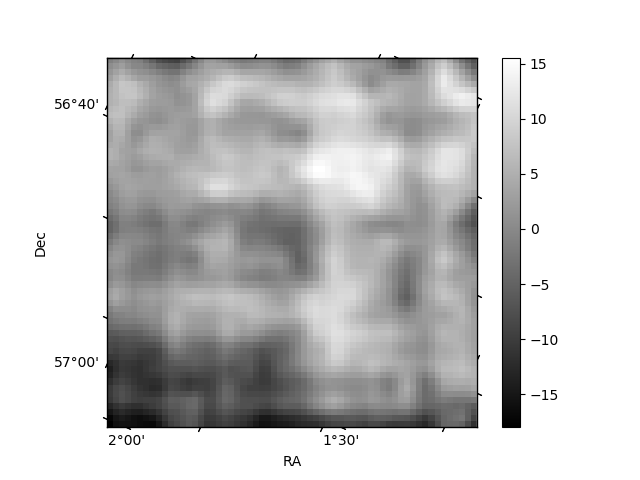
Histogram calculated using DETX and DETY for each event in the final _common_clean file
| Quadrant A | 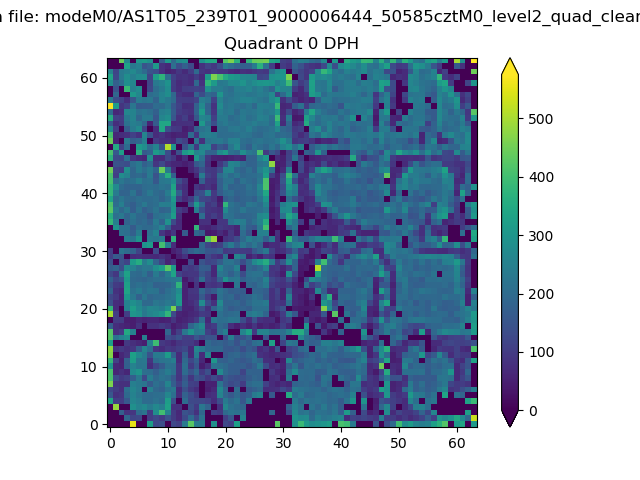 |
 |
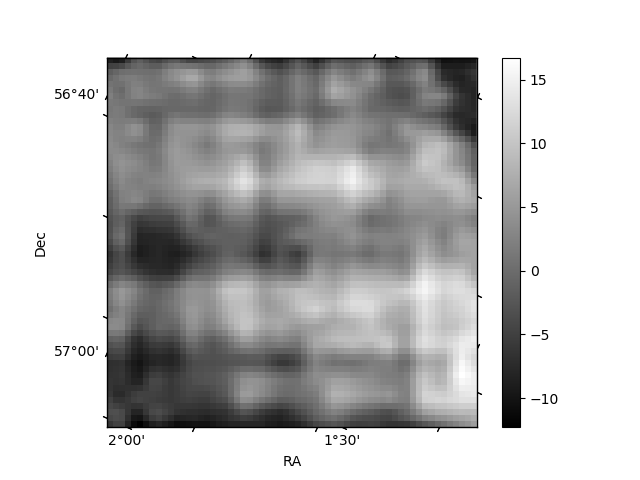
Quadrant B |
|---|---|---|---|
| Quadrant D | 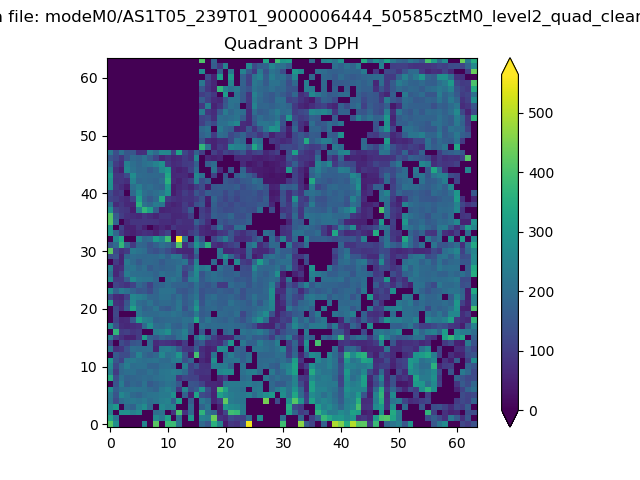 |
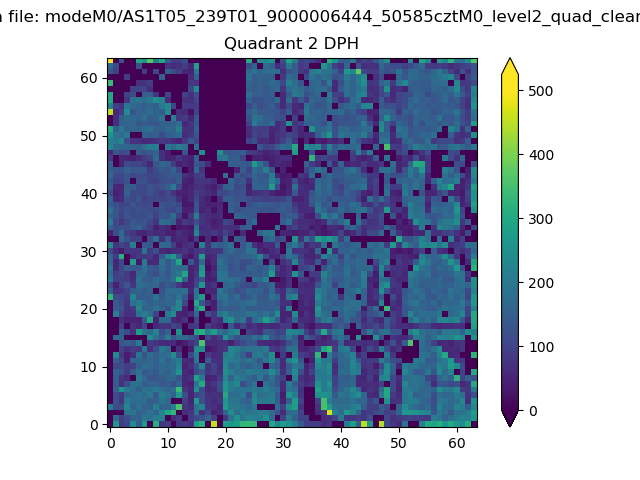 |
Quadrant C |
| Plot type | Count rate plots | Images |
|---|---|---|
| Comparison with Poisson distribution Blue bars denote a histogram of data divided into 1 sec bins. Red curve is a Poisson curve with rate = median count rate of data. |
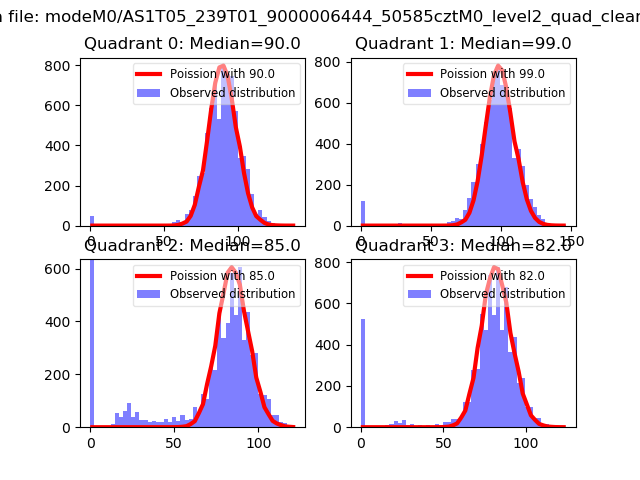 |
 |
| Quadrant-wise count rates Data is divided into 100 sec bins |
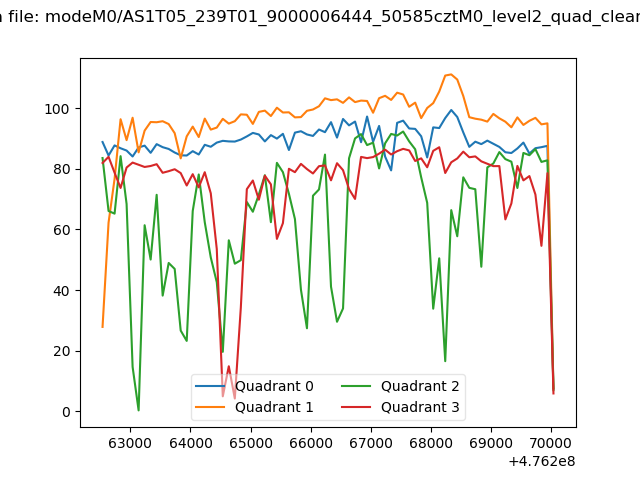 |
|
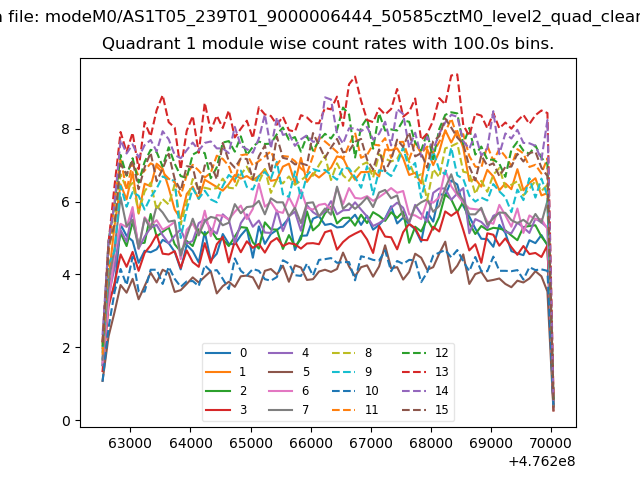
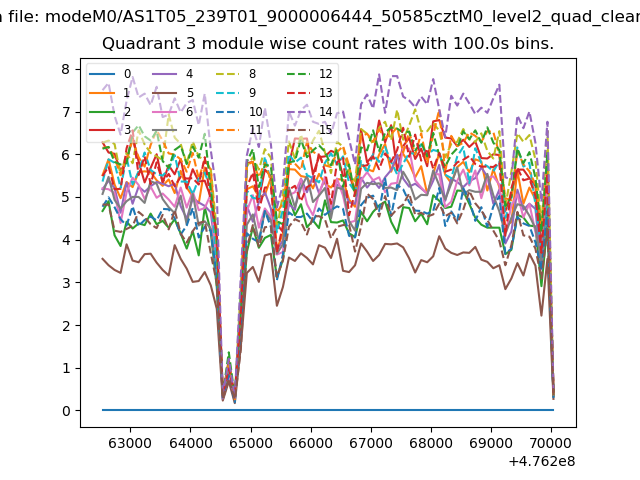
| Module-wise count rates for Quadrant A Data is divided into 100 sec bins |
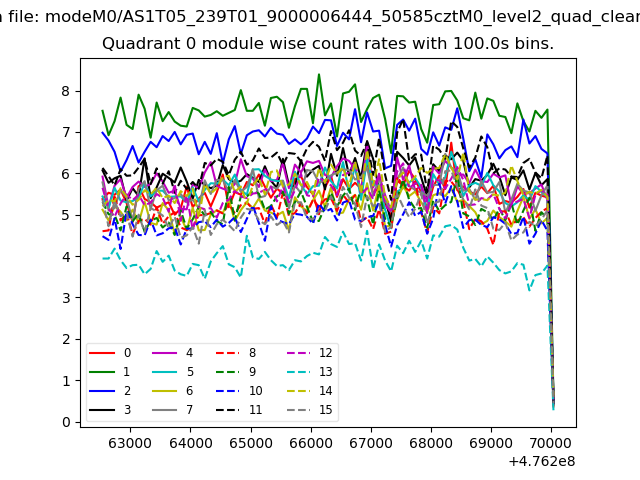 |
 |
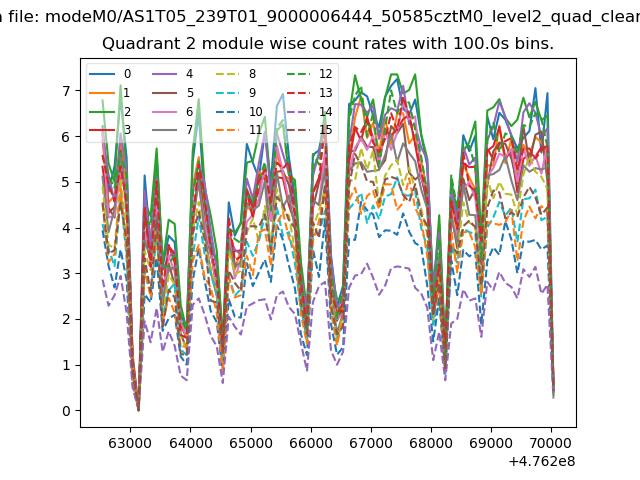
| Module-wise count rates for Quadrant B Data is divided into 100 sec bins |
 |
 |
| Module-wise count rates for Quadrant C Data is divided into 100 sec bins |
 |
 |
| Module-wise count rates for Quadrant D Data is divided into 100 sec bins |
 |
 |
| Parameter | Plot |
|---|---|
| CZT HV Monitor | 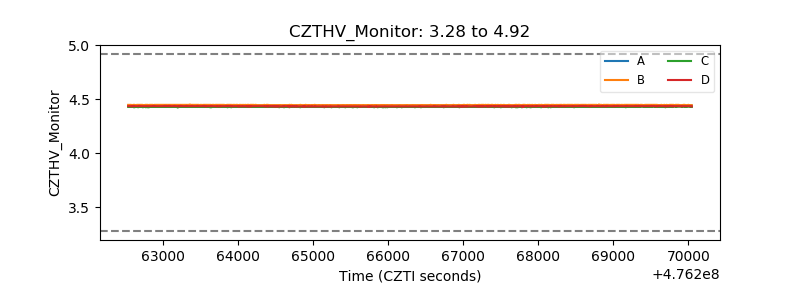 |
| D_VDD | 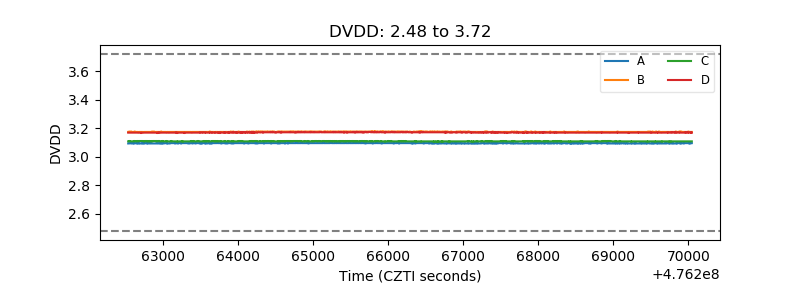 |
| Temperature 1 | 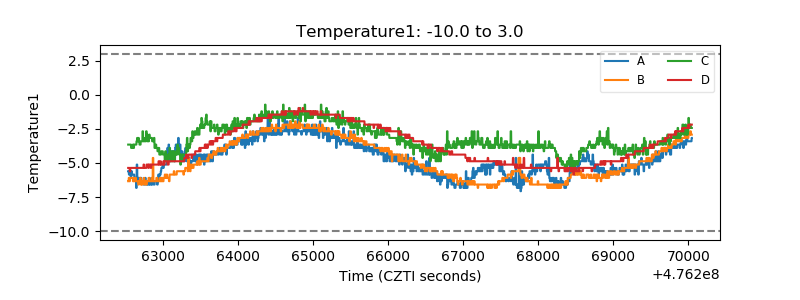 |
| Veto HV Monitor | 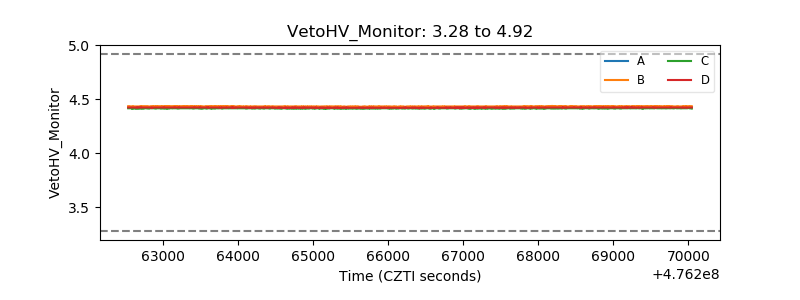 |
| Veto LLD | 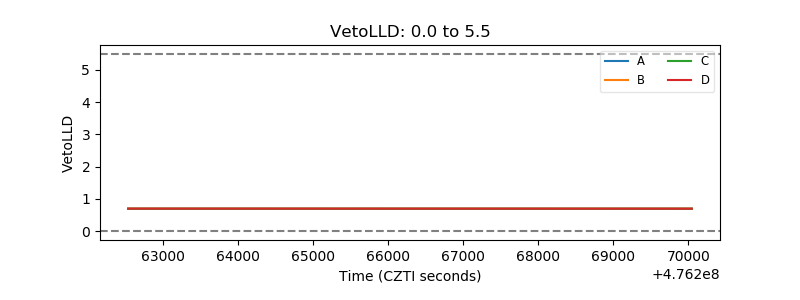 |
| Alpha Counter | 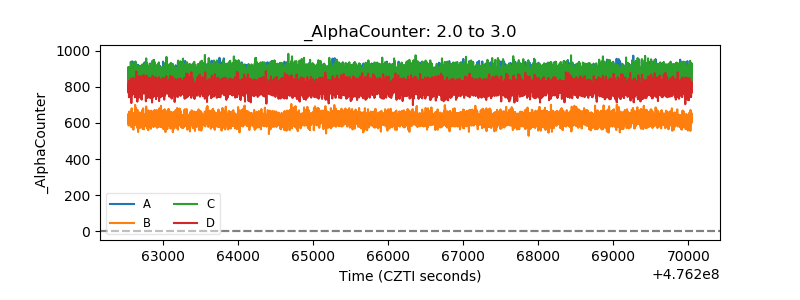 |
| _CPM_Rate | 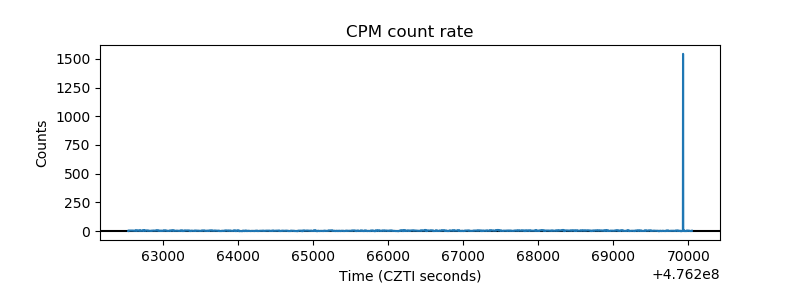 |
| CZT Counter | 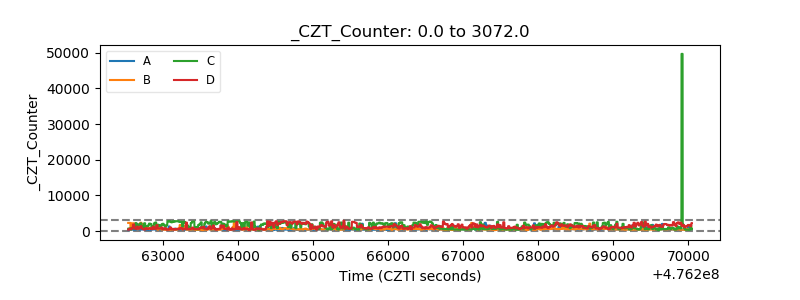 |
| +2.5 Volts monitor | 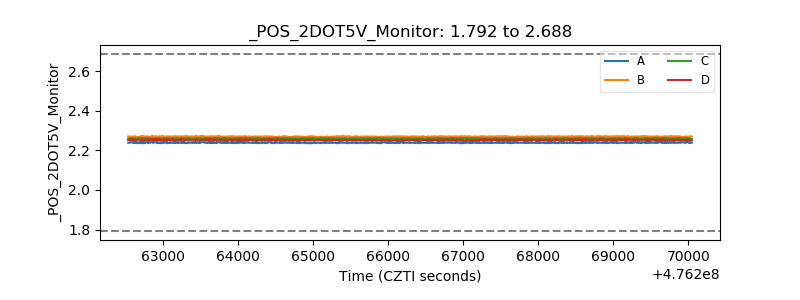 |
| +5 Volts monitor |  |
| _ROLL_ROT | 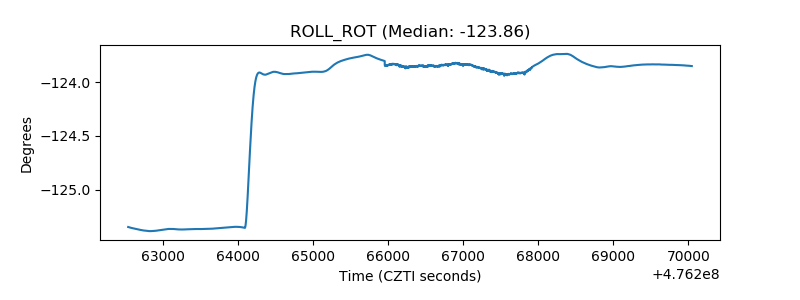 |
| _Roll_DEC | 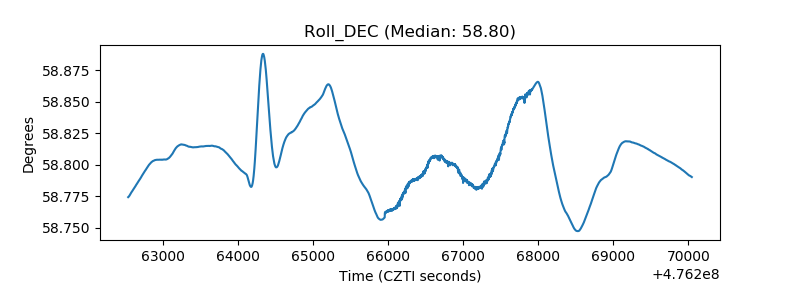 |
| _Roll_RA | 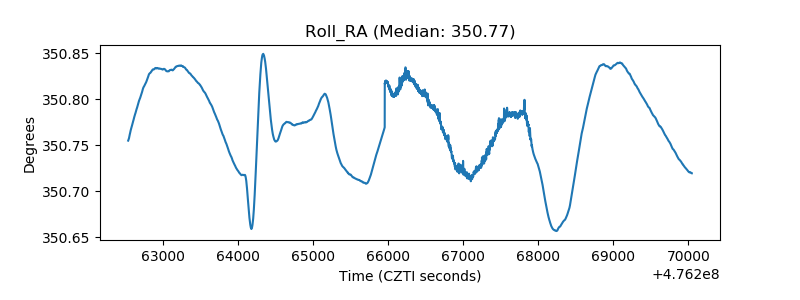 |
| Veto Counter | 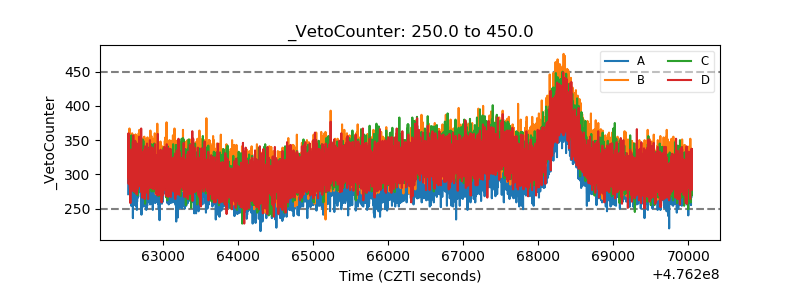 |