| Param | Original file | Final file |
|---|---|---|
| Filename | modeM0/AS1T05_239T01_9000006444_50586cztM0_level2.fits | modeM0/AS1T05_239T01_9000006444_50586cztM0_level2_quad_clean.evt |
| Size (bytes) | 1,007,472,960 | 82,569,600 |
| Size | 960.8 MB | 78.7 MB |
| Events in quadrant A | 5,626,217 | 605,552 |
| Events in quadrant B | 6,817,606 | 631,585 |
| Events in quadrant C | 10,019,270 | 462,420 |
| Events in quadrant D | 14,279,200 | 302,213 |
| Mode M0 | |||
|---|---|---|---|
| Quadrant | BADHDUFLAG | Total packets | Discarded packets |
| A | 0 | 21559 | 0 |
| B | 0 | 25199 | 0 |
| C | 0 | 34721 | 3 |
| D | 0 | 47293 | 0 |
| Mode SS | |||
|---|---|---|---|
| Quadrant | BADHDUFLAG | Total packets | Discarded packets |
| A | 0 | 144 | 0 |
| B | 0 | 144 | 0 |
| C | 0 | 144 | 0 |
| D | 0 | 144 | 0 |
| Quadrant | Total seconds | Saturated seconds | Saturation percentage |
|---|---|---|---|
| A | 7146 | 638 | 8.928072% |
| B | 7147 | 891 | 12.466769% |
| C | 7146 | 2177 | 30.464596% |
| D | 7146 | 3838 | 53.708368% |
Noise dominated data is calculated using 1-second bins in cleaned event files. If a bin has >2000 counts, and if more than 50% of those come from <1% of pixels, then it is considered to be noise-dominated and hence unusable.
| Quadrant | # 1 sec bins | Bins with >0 counts | Bins with >2000 counts | High rate bins dominated by noise | Noise dominated (total time) | Noise dominated (detector-on time) | Marked lightcurve |
|---|---|---|---|---|---|---|---|
| A | 7146 | 7146 | 374 | 374 | 5.23% | 5.23% | 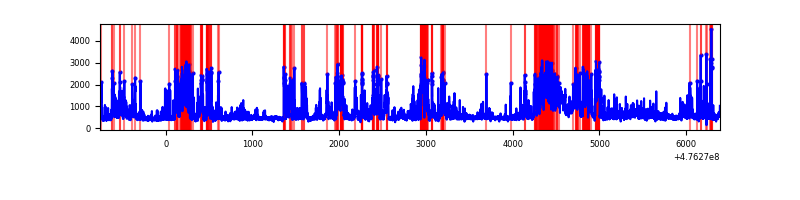 |
| B | 7147 | 7147 | 734 | 734 | 10.27% | 10.27% | 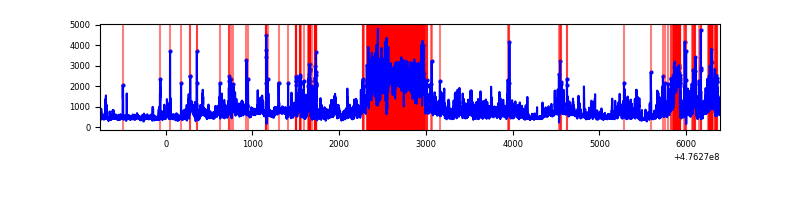 |
| C | 7145 | 7145 | 1880 | 1880 | 26.31% | 26.31% | 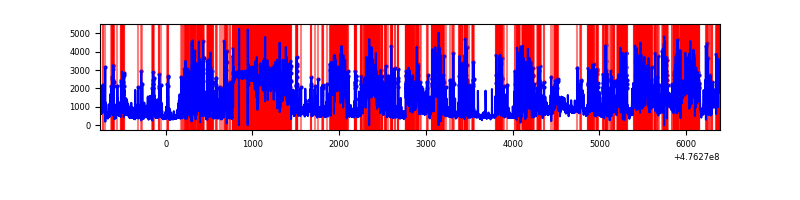 |
| D | 7146 | 7146 | 3956 | 3956 | 55.36% | 55.36% | 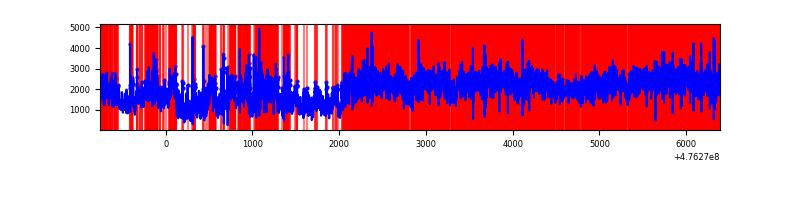 |
Top three noisy pixels from each quadrant. If the there are fewer than three noisy pixels in the level2.evt file, extra rows are filled as -1
| Pixel properties | Quadrant properties | ||||||
|---|---|---|---|---|---|---|---|
| Quadrant | DetID | PixID | Counts | Sigma | Mean | Median | Sigma |
| A | 12 | 250 | 1861977 | 10272.84 | 718 | 699 | 181.2 |
| A | 4 | 3 | 189776 | 1043.56 | 718 | 699 | 181.2 |
| A | 4 | 4 | 121277 | 665.5 | 718 | 699 | 181.2 |
| B | 4 | 170 | 1441069 | 9675.07 | 694 | 671 | 148.9 |
| B | 2 | 249 | 1422225 | 9548.49 | 694 | 671 | 148.9 |
| B | 5 | 172 | 328132 | 2199.54 | 694 | 671 | 148.9 |
| C | 15 | 178 | 2306301 | 13555.39 | 605 | 600 | 170.1 |
| C | 15 | 147 | 1501865 | 8826.05 | 605 | 600 | 170.1 |
| C | 15 | 196 | 1246860 | 7326.86 | 605 | 600 | 170.1 |
| D | 7 | 61 | 9238290 | 56306.9 | 588 | 567 | 164.1 |
| D | 7 | 60 | 530811 | 3232.01 | 588 | 567 | 164.1 |
| D | 14 | 67 | 512539 | 3120.63 | 588 | 567 | 164.1 |
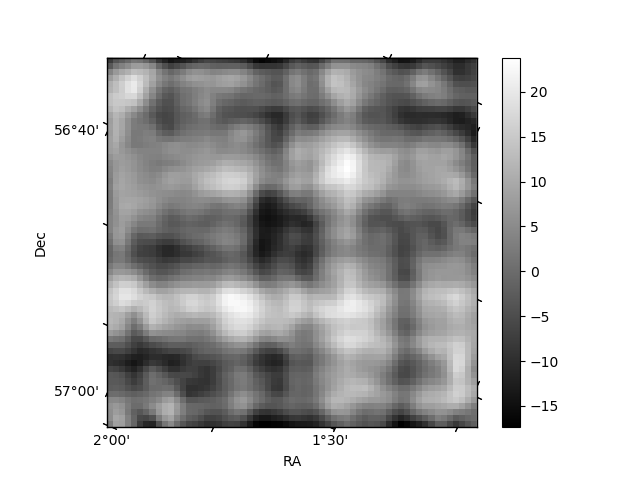
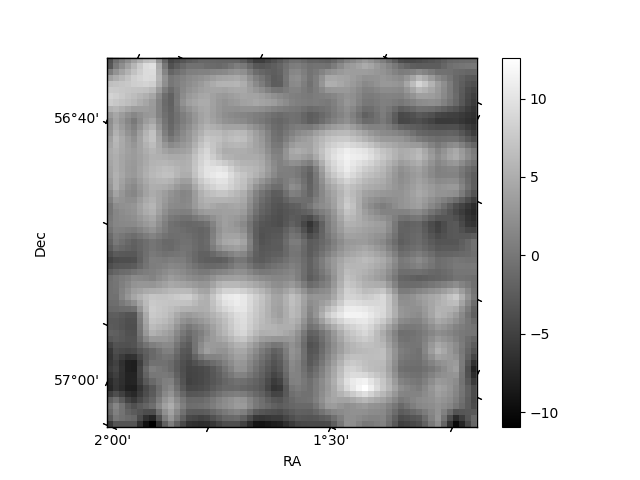
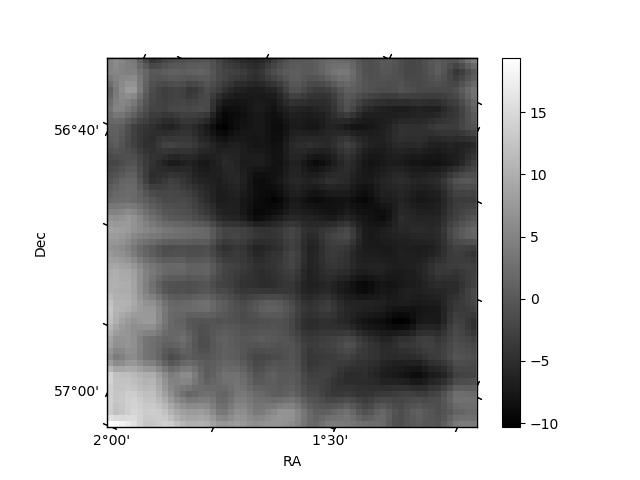
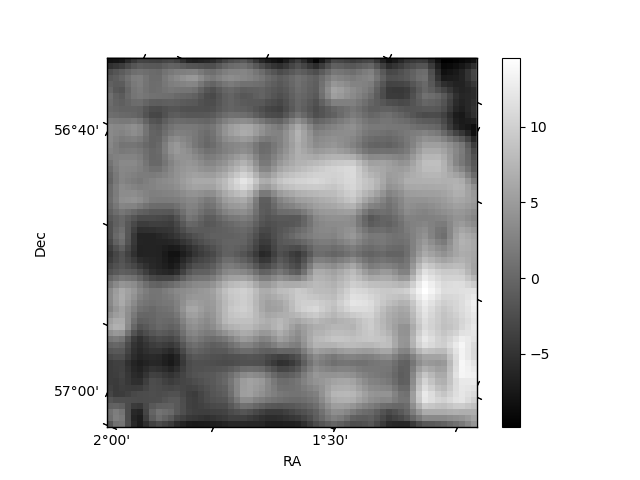
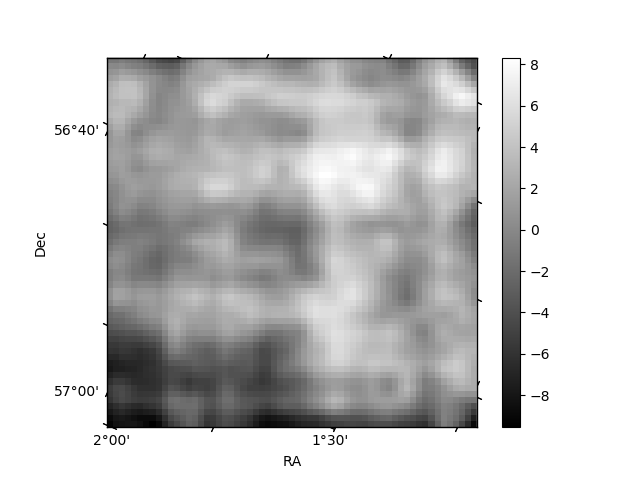
Histogram calculated using DETX and DETY for each event in the final _common_clean file
| Quadrant A | 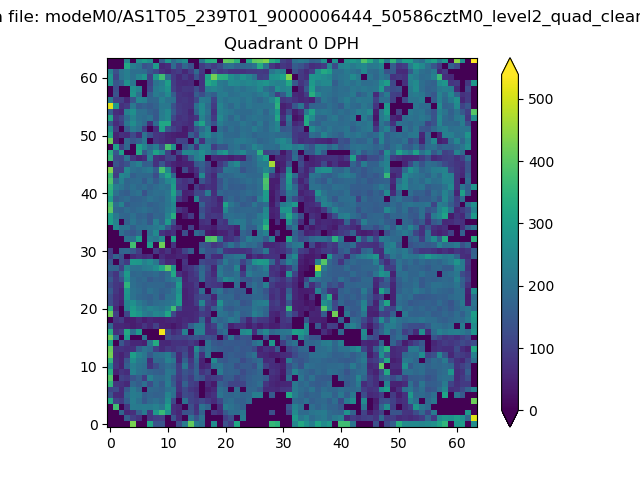 |
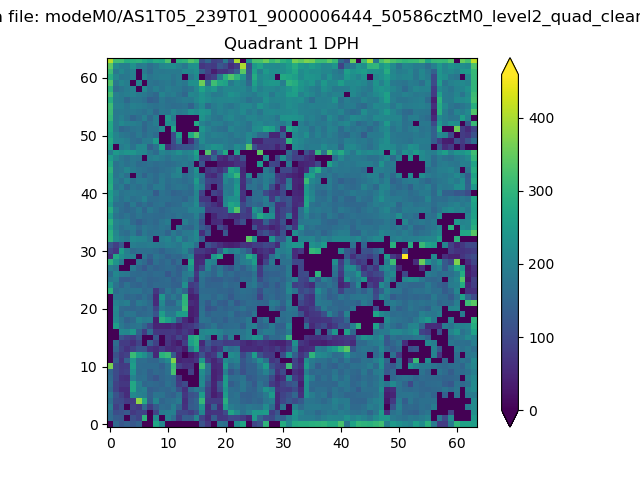 |
Quadrant B |
|---|---|---|---|
| Quadrant D | 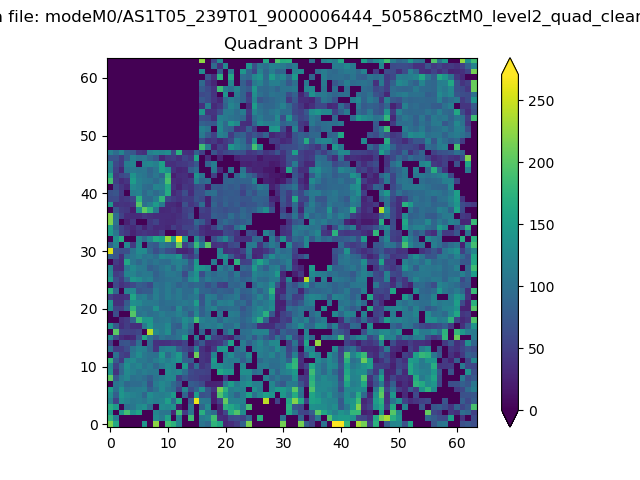 |
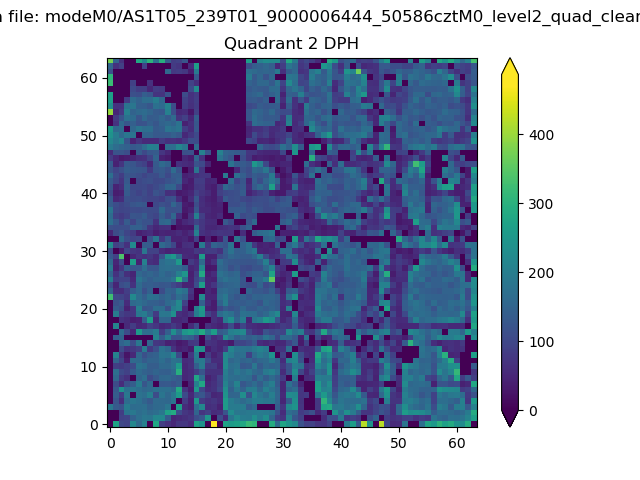 |
Quadrant C |
| Plot type | Count rate plots | Images |
|---|---|---|
| Comparison with Poisson distribution Blue bars denote a histogram of data divided into 1 sec bins. Red curve is a Poisson curve with rate = median count rate of data. |
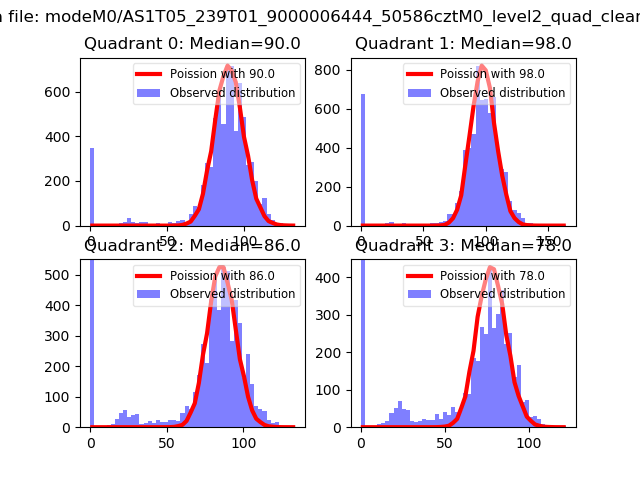 |
 |
| Quadrant-wise count rates Data is divided into 100 sec bins |
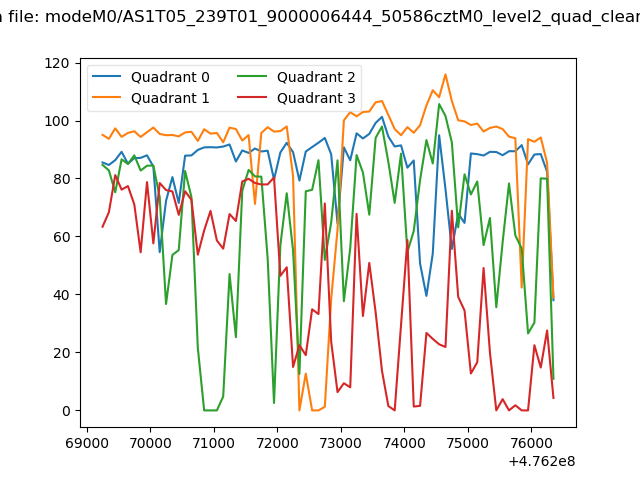 |
|
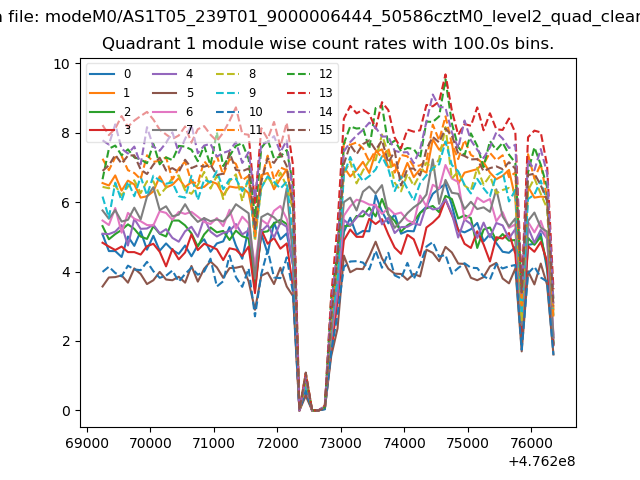
| Module-wise count rates for Quadrant A Data is divided into 100 sec bins |
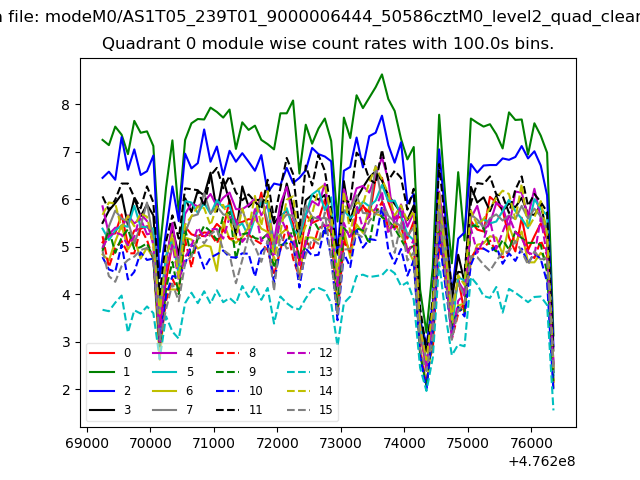 |
 |
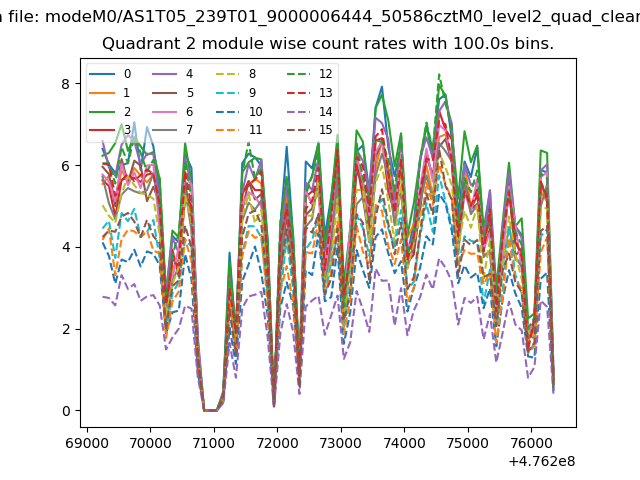
| Module-wise count rates for Quadrant B Data is divided into 100 sec bins |
 |
 |
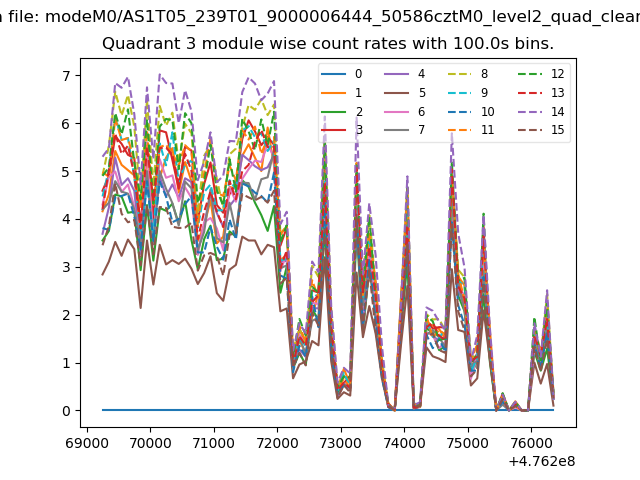
| Module-wise count rates for Quadrant C Data is divided into 100 sec bins |
 |
 |
| Module-wise count rates for Quadrant D Data is divided into 100 sec bins |
 |
 |
| Parameter | Plot |
|---|---|
| CZT HV Monitor |  |
| D_VDD | 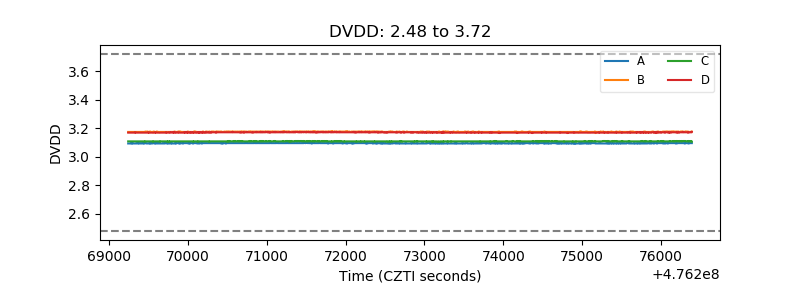 |
| Temperature 1 | 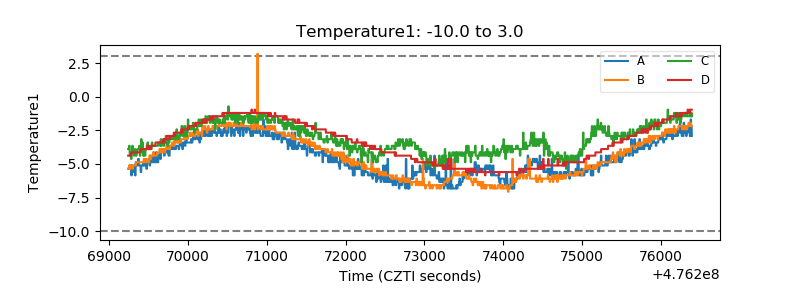 |
| Veto HV Monitor | 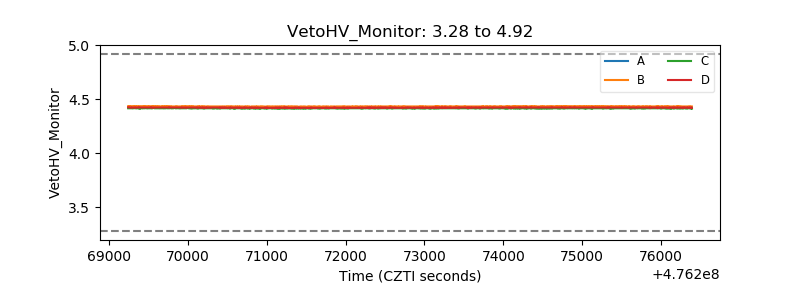 |
| Veto LLD | 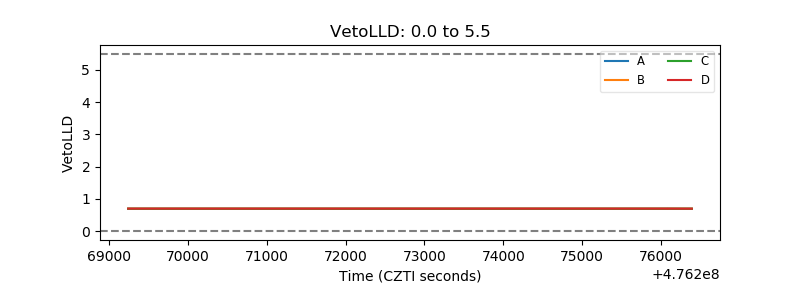 |
| Alpha Counter | 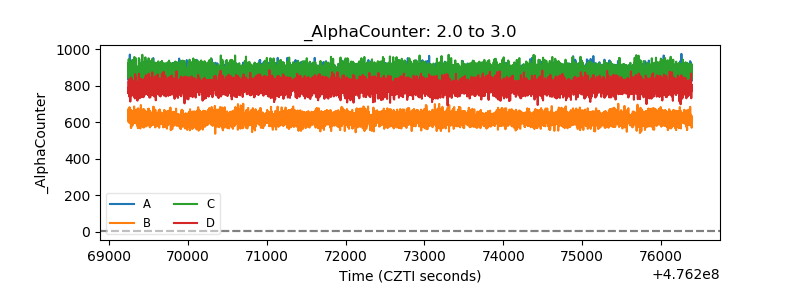 |
| _CPM_Rate | 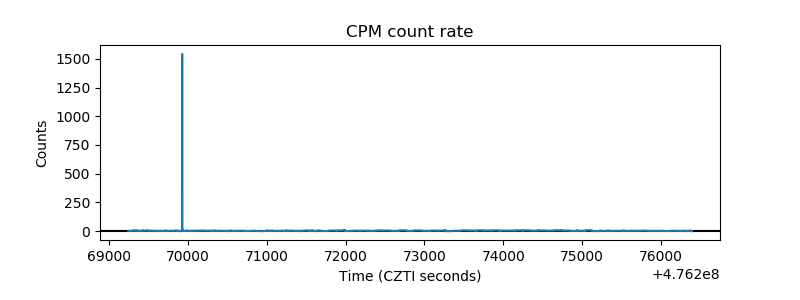 |
| CZT Counter | 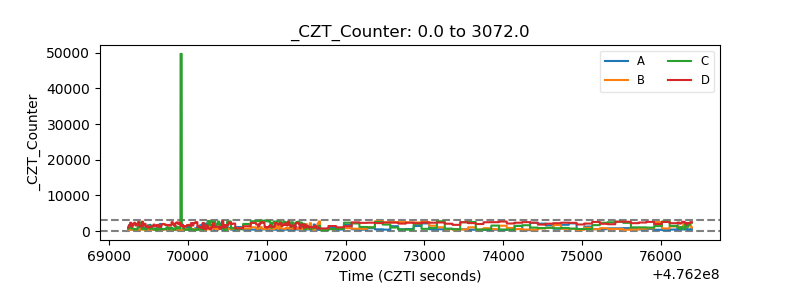 |
| +2.5 Volts monitor |  |
| +5 Volts monitor |  |
| _ROLL_ROT | 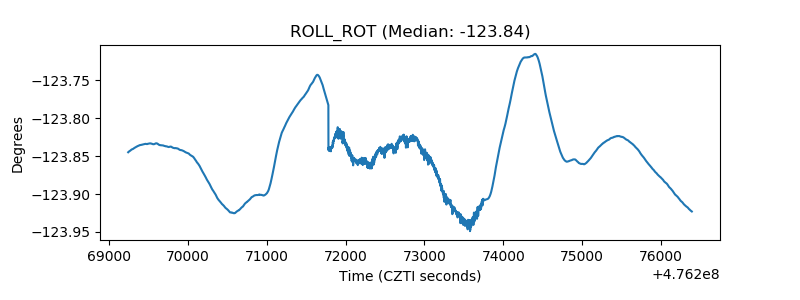 |
| _Roll_DEC | 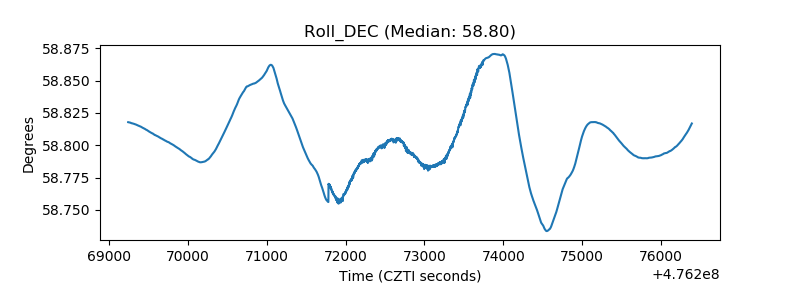 |
| _Roll_RA | 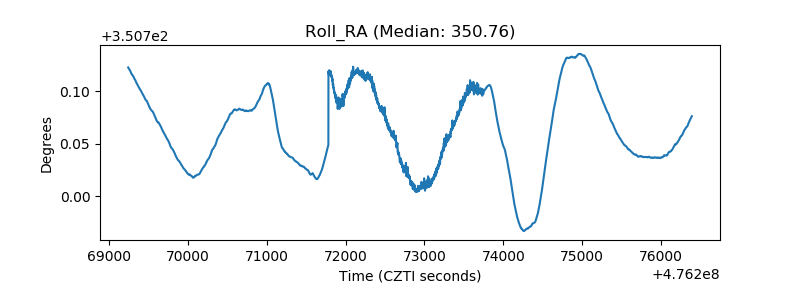 |
| Veto Counter | 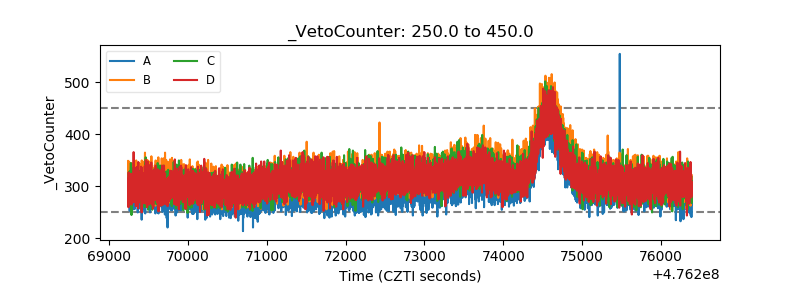 |