| Param | Original file | Final file |
|---|---|---|
| Filename | modeM0/AS1T05_239T01_9000006444_50589cztM0_level2.fits | modeM0/AS1T05_239T01_9000006444_50589cztM0_level2_quad_clean.evt |
| Size (bytes) | 2,326,619,520 | 210,211,200 |
| Size | 2.2 GB | 200.5 MB |
| Events in quadrant A | 11,049,534 | 1,666,263 |
| Events in quadrant B | 20,097,468 | 1,522,482 |
| Events in quadrant C | 25,752,202 | 1,036,194 |
| Events in quadrant D | 27,801,355 | 864,135 |
| Mode M0 | |||
|---|---|---|---|
| Quadrant | BADHDUFLAG | Total packets | Discarded packets |
| A | 0 | 45023 | 3 |
| B | 0 | 72584 | 2 |
| C | 0 | 89496 | 25 |
| D | 0 | 95358 | 2 |
| Mode M9 | |||
|---|---|---|---|
| Quadrant | BADHDUFLAG | Total packets | Discarded packets |
| A | 0 | 11 | 0 |
| B | 0 | 11 | 0 |
| C | 0 | 11 | 0 |
| D | 0 | 11 | 0 |
| Mode SS | |||
|---|---|---|---|
| Quadrant | BADHDUFLAG | Total packets | Discarded packets |
| A | 0 | 376 | 0 |
| B | 0 | 376 | 0 |
| C | 0 | 376 | 0 |
| D | 0 | 376 | 0 |
| Quadrant | Total seconds | Saturated seconds | Saturation percentage |
|---|---|---|---|
| A | 18546 | 398 | 2.146015% |
| B | 18546 | 3268 | 17.621050% |
| C | 18360 | 6322 | 34.433551% |
| D | 18482 | 8107 | 43.864300% |
Noise dominated data is calculated using 1-second bins in cleaned event files. If a bin has >2000 counts, and if more than 50% of those come from <1% of pixels, then it is considered to be noise-dominated and hence unusable.
| Quadrant | # 1 sec bins | Bins with >0 counts | Bins with >2000 counts | High rate bins dominated by noise | Noise dominated (total time) | Noise dominated (detector-on time) | Marked lightcurve |
|---|---|---|---|---|---|---|---|
| A | 19636 | 18548 | 178 | 178 | 0.91% | 0.96% | 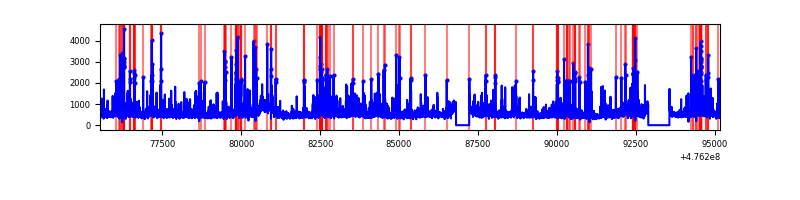 |
| B | 19636 | 18548 | 2390 | 2390 | 12.17% | 12.89% | 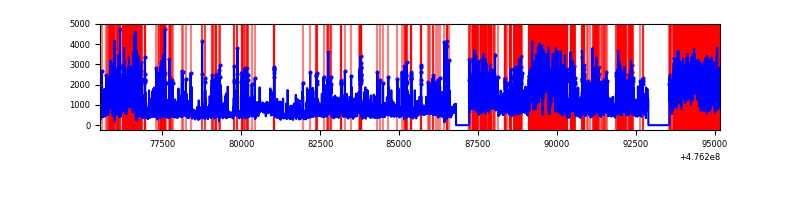 |
| C | 19636 | 18362 | 5118 | 5118 | 26.06% | 27.87% | 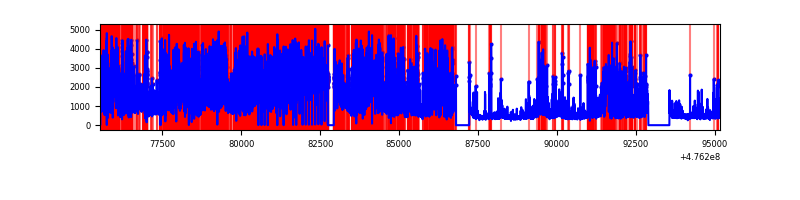 |
| D | 19636 | 18484 | 7144 | 7144 | 36.38% | 38.65% | 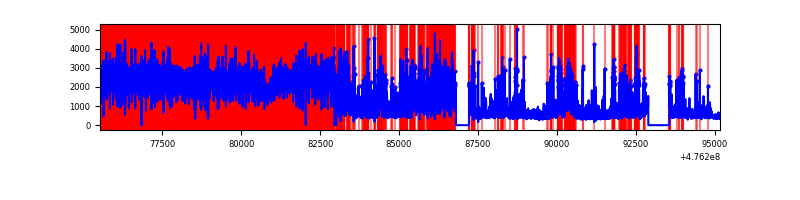 |
Top three noisy pixels from each quadrant. If the there are fewer than three noisy pixels in the level2.evt file, extra rows are filled as -1
| Pixel properties | Quadrant properties | ||||||
|---|---|---|---|---|---|---|---|
| Quadrant | DetID | PixID | Counts | Sigma | Mean | Median | Sigma |
| A | 4 | 3 | 589996 | 1225.27 | 1951 | 1900 | 480.0 |
| A | 4 | 4 | 368402 | 763.59 | 1951 | 1900 | 480.0 |
| A | 4 | 78 | 333283 | 690.42 | 1951 | 1900 | 480.0 |
| B | 4 | 170 | 5319905 | 13652.39 | 1833 | 1771 | 389.5 |
| B | 7 | 0 | 2178980 | 5589.2 | 1833 | 1771 | 389.5 |
| B | 5 | 172 | 1750310 | 4488.74 | 1833 | 1771 | 389.5 |
| C | 15 | 236 | 5228880 | 12373.9 | 1522 | 1514 | 422.5 |
| C | 15 | 178 | 1804608 | 4268.17 | 1522 | 1514 | 422.5 |
| C | 15 | 196 | 1564247 | 3699.21 | 1522 | 1514 | 422.5 |
| D | 7 | 61 | 11889761 | 26250.33 | 1590 | 1533 | 452.9 |
| D | 7 | 126 | 1697670 | 3745.23 | 1590 | 1533 | 452.9 |
| D | 8 | 48 | 982136 | 2165.26 | 1590 | 1533 | 452.9 |
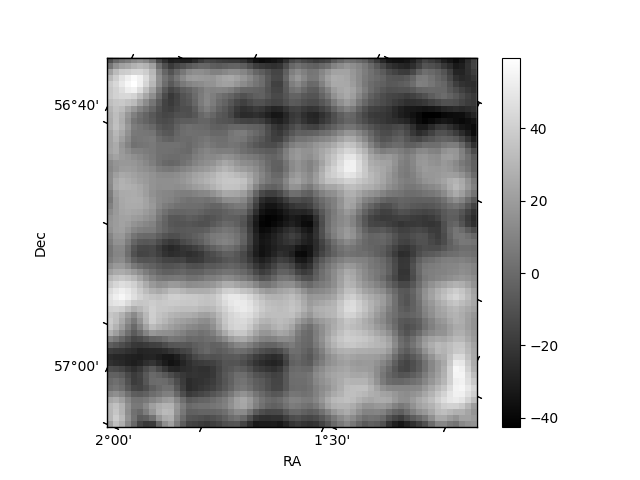
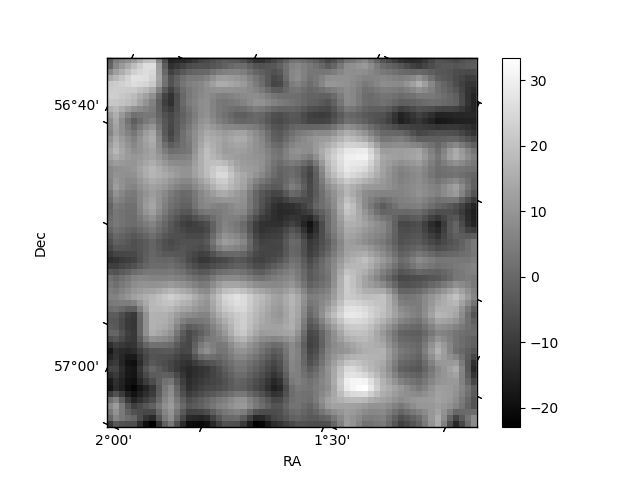
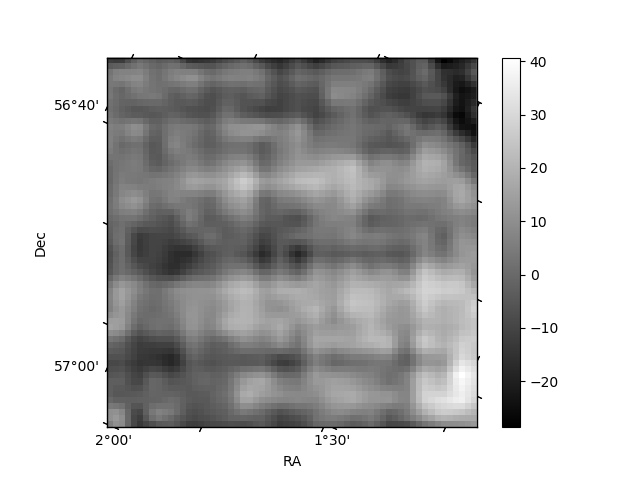
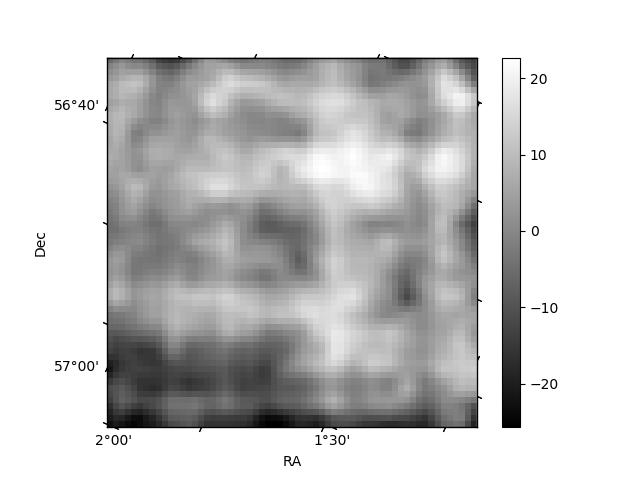
Histogram calculated using DETX and DETY for each event in the final _common_clean file
| Quadrant A | 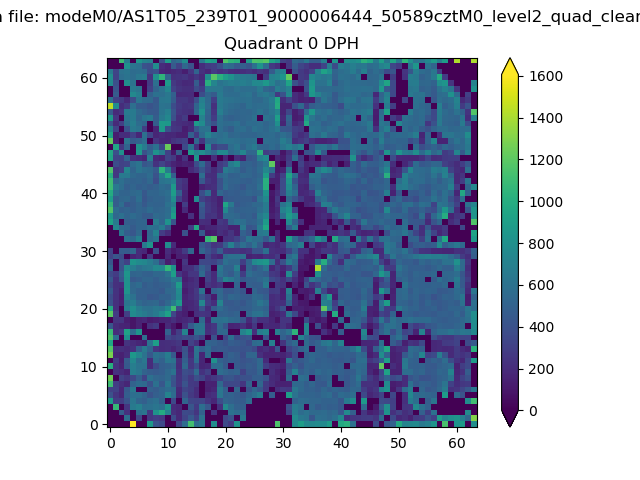 |
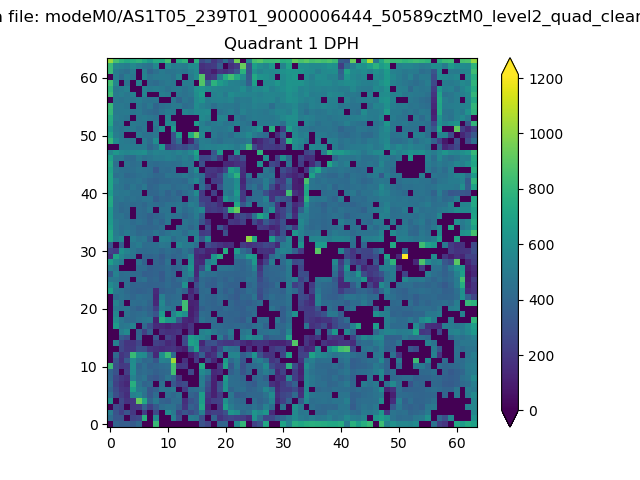 |
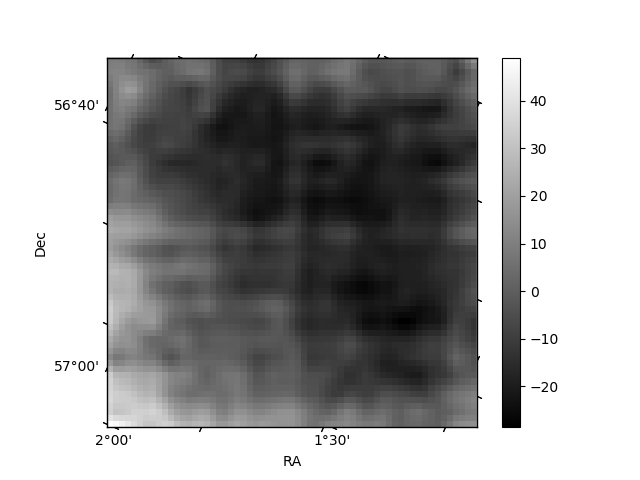
Quadrant B |
|---|---|---|---|
| Quadrant D | 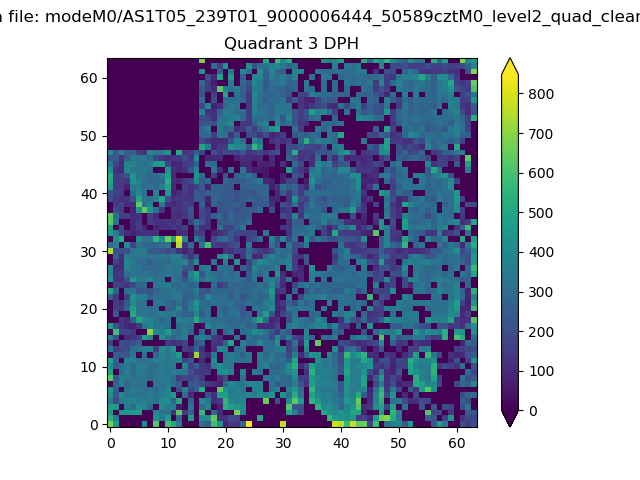 |
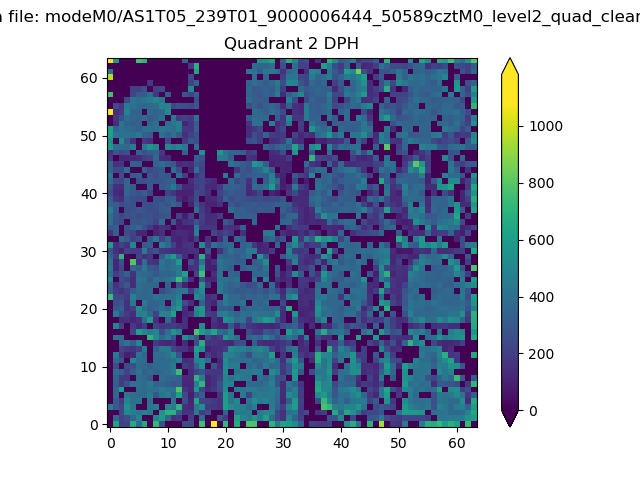 |
Quadrant C |
| Plot type | Count rate plots | Images |
|---|---|---|
| Comparison with Poisson distribution Blue bars denote a histogram of data divided into 1 sec bins. Red curve is a Poisson curve with rate = median count rate of data. |
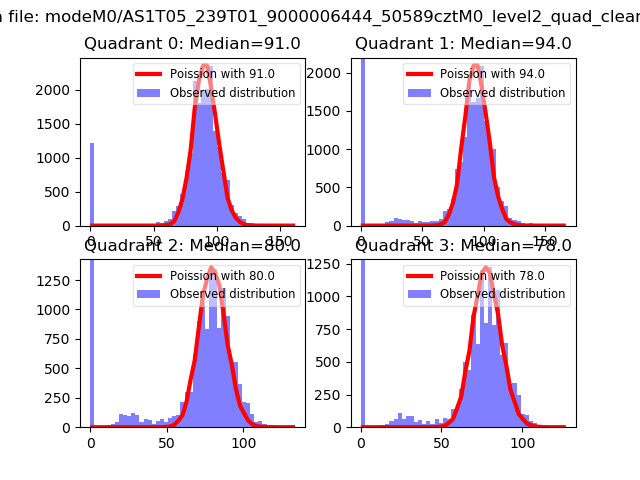 |
 |
| Quadrant-wise count rates Data is divided into 100 sec bins |
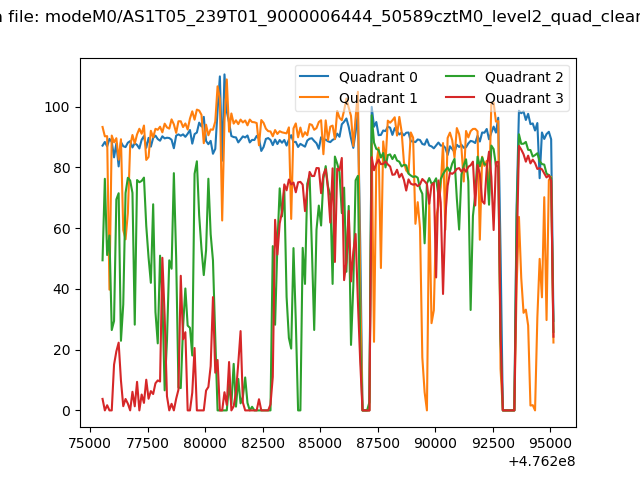 |
|
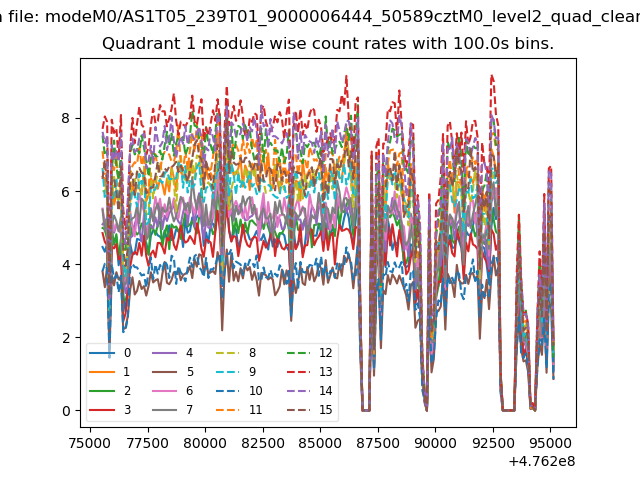
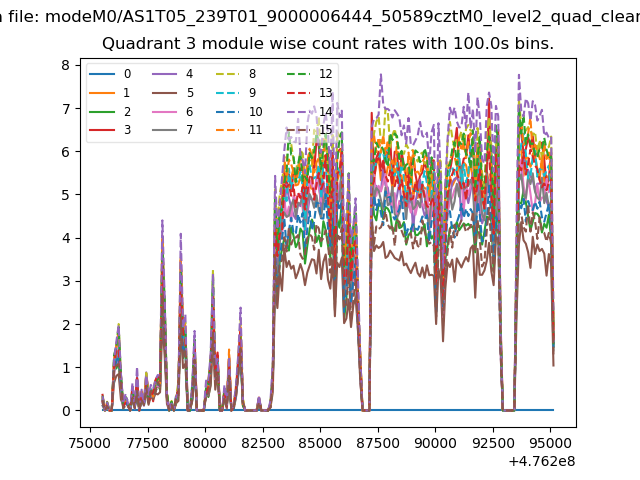
| Module-wise count rates for Quadrant A Data is divided into 100 sec bins |
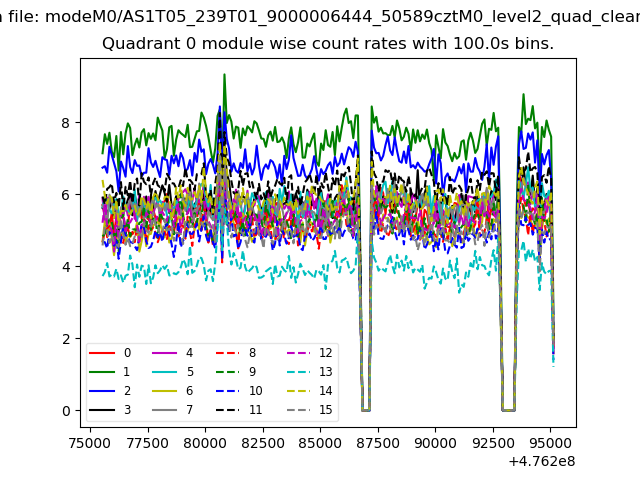 |
 |
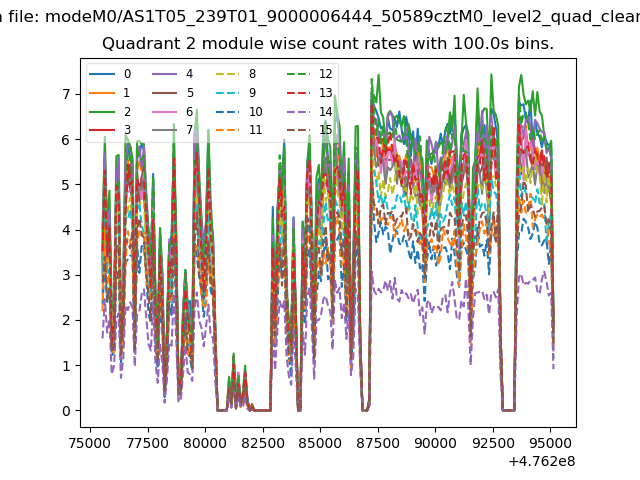
| Module-wise count rates for Quadrant B Data is divided into 100 sec bins |
 |
 |
| Module-wise count rates for Quadrant C Data is divided into 100 sec bins |
 |
 |
| Module-wise count rates for Quadrant D Data is divided into 100 sec bins |
 |
 |
| Parameter | Plot |
|---|---|
| CZT HV Monitor | 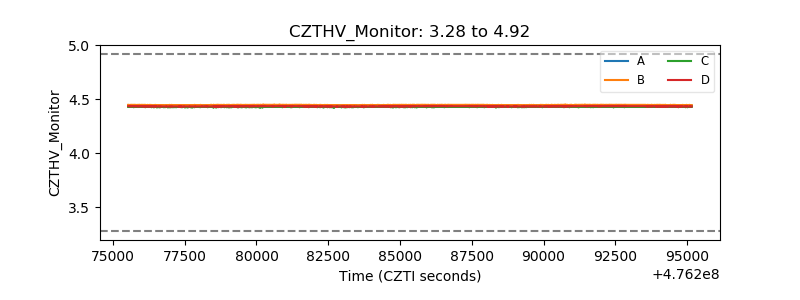 |
| D_VDD | 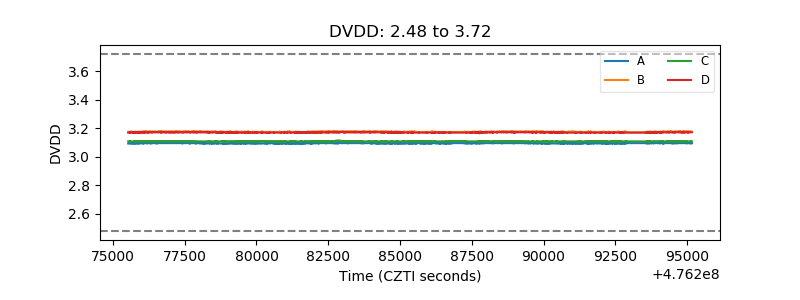 |
| Temperature 1 | 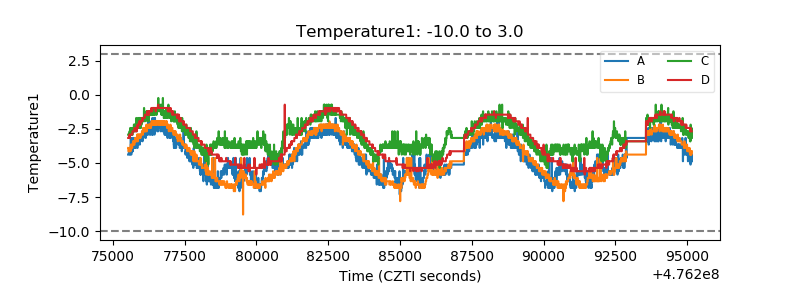 |
| Veto HV Monitor | 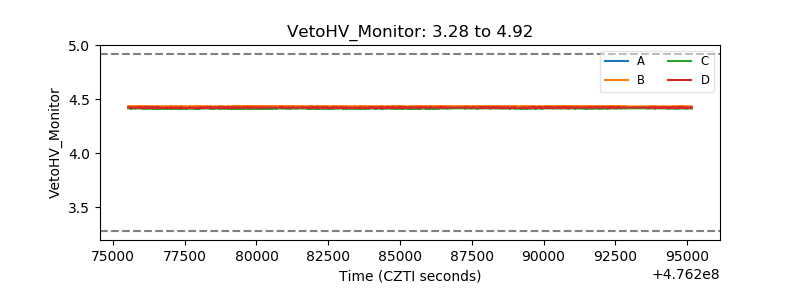 |
| Veto LLD | 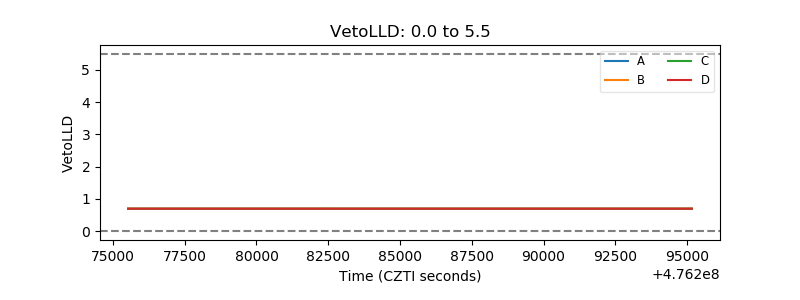 |
| Alpha Counter | 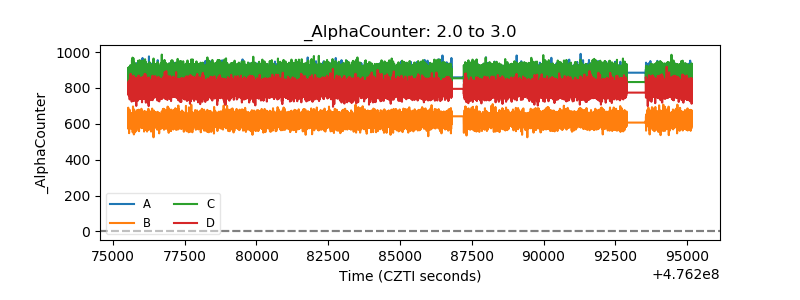 |
| _CPM_Rate | 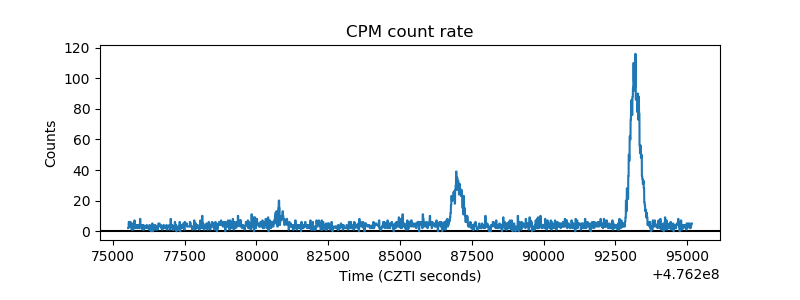 |
| CZT Counter | 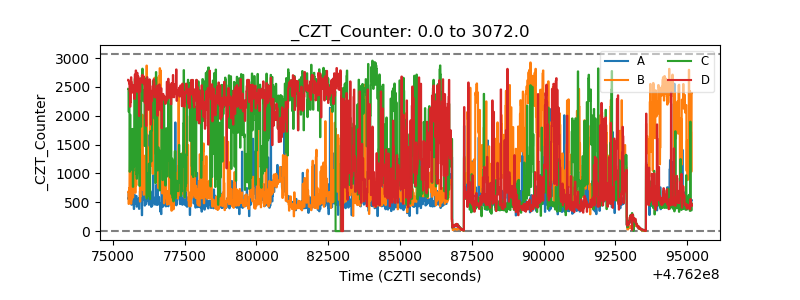 |
| +2.5 Volts monitor | 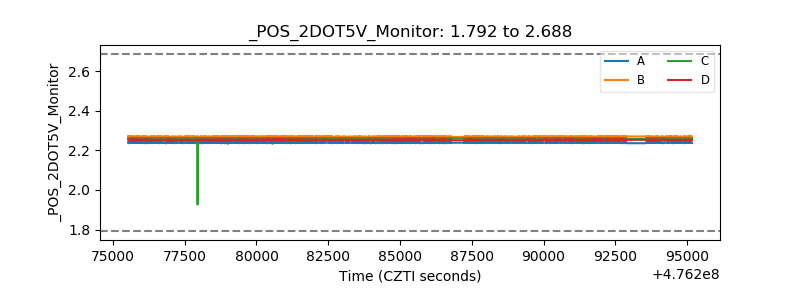 |
| +5 Volts monitor |  |
| _ROLL_ROT | 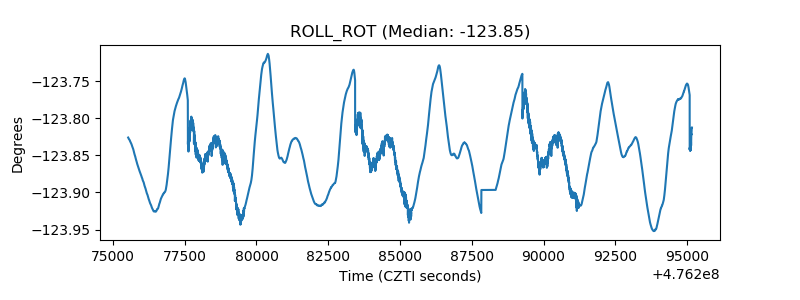 |
| _Roll_DEC | 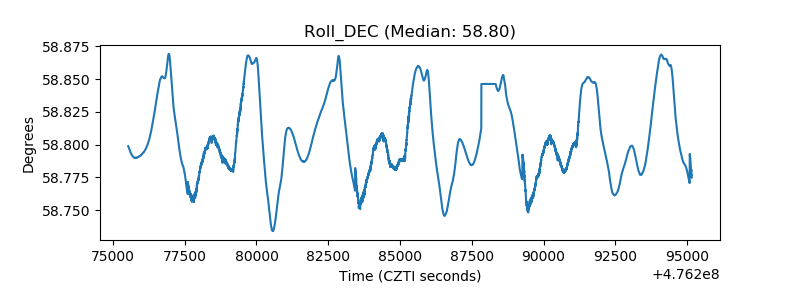 |
| _Roll_RA | 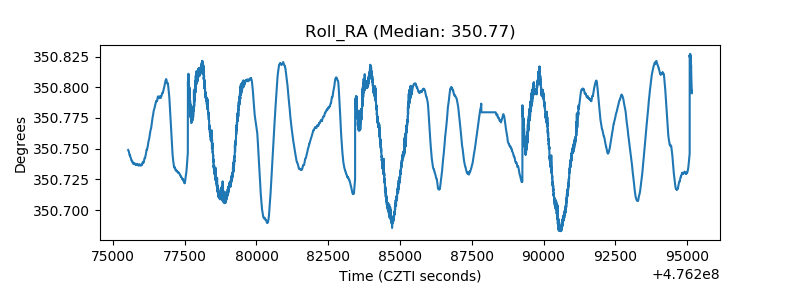 |
| Veto Counter | 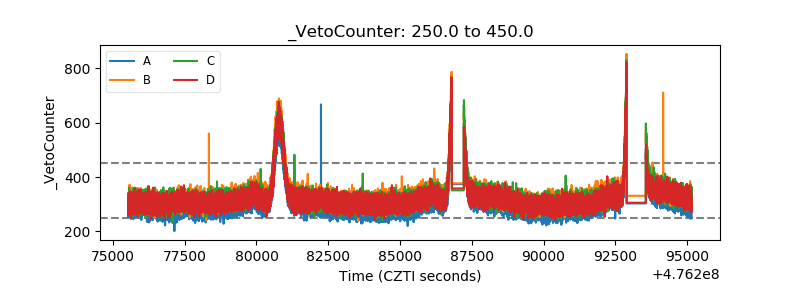 |