| Param | Original file | Final file |
|---|---|---|
| Filename | modeM0/AS1T05_239T01_9000006444_50590cztM0_level2.fits | modeM0/AS1T05_239T01_9000006444_50590cztM0_level2_quad_clean.evt |
| Size (bytes) | 794,856,960 | 79,182,720 |
| Size | 758.0 MB | 75.5 MB |
| Events in quadrant A | 4,255,029 | 609,175 |
| Events in quadrant B | 12,258,208 | 337,931 |
| Events in quadrant C | 5,295,539 | 555,987 |
| Events in quadrant D | 7,095,740 | 427,877 |
| Mode M0 | |||
|---|---|---|---|
| Quadrant | BADHDUFLAG | Total packets | Discarded packets |
| A | 0 | 17042 | 1 |
| B | 0 | 41022 | 1 |
| C | 0 | 20272 | 1 |
| D | 0 | 25747 | 1 |
| Mode M9 | |||
|---|---|---|---|
| Quadrant | BADHDUFLAG | Total packets | Discarded packets |
| A | 0 | 9 | 0 |
| B | 0 | 9 | 0 |
| C | 0 | 9 | 0 |
| D | 0 | 9 | 0 |
| Mode SS | |||
|---|---|---|---|
| Quadrant | BADHDUFLAG | Total packets | Discarded packets |
| A | 0 | 134 | 0 |
| B | 0 | 134 | 0 |
| C | 0 | 134 | 0 |
| D | 0 | 134 | 0 |
| Quadrant | Total seconds | Saturated seconds | Saturation percentage |
|---|---|---|---|
| A | 6692 | 209 | 3.123132% |
| B | 6693 | 3692 | 55.162110% |
| C | 6693 | 537 | 8.023308% |
| D | 6693 | 1640 | 24.503212% |
Noise dominated data is calculated using 1-second bins in cleaned event files. If a bin has >2000 counts, and if more than 50% of those come from <1% of pixels, then it is considered to be noise-dominated and hence unusable.
| Quadrant | # 1 sec bins | Bins with >0 counts | Bins with >2000 counts | High rate bins dominated by noise | Noise dominated (total time) | Noise dominated (detector-on time) | Marked lightcurve |
|---|---|---|---|---|---|---|---|
| A | 7567 | 6693 | 143 | 143 | 1.89% | 2.14% | 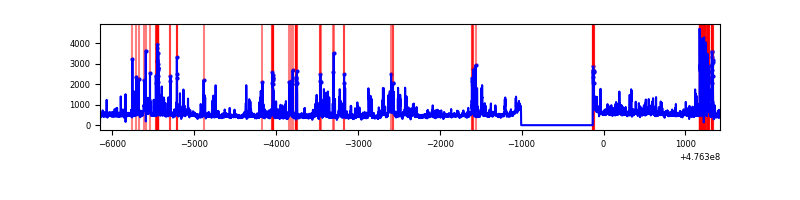 |
| B | 7568 | 6694 | 2988 | 2988 | 39.48% | 44.64% |  |
| C | 7568 | 6694 | 379 | 379 | 5.01% | 5.66% | 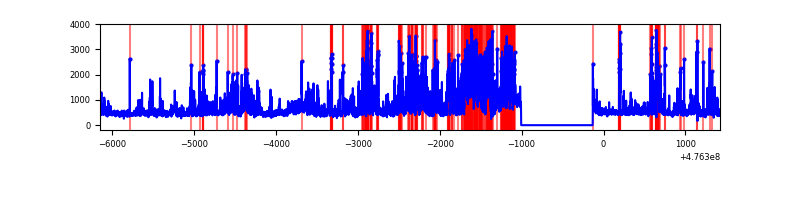 |
| D | 7568 | 6694 | 1296 | 1296 | 17.12% | 19.36% | 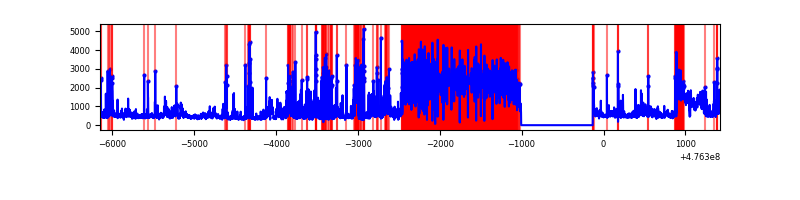 |
Top three noisy pixels from each quadrant. If the there are fewer than three noisy pixels in the level2.evt file, extra rows are filled as -1
| Pixel properties | Quadrant properties | ||||||
|---|---|---|---|---|---|---|---|
| Quadrant | DetID | PixID | Counts | Sigma | Mean | Median | Sigma |
| A | 12 | 250 | 420439 | 2477.56 | 686 | 670 | 169.4 |
| A | 8 | 38 | 287083 | 1690.46 | 686 | 670 | 169.4 |
| A | 4 | 3 | 228479 | 1344.57 | 686 | 670 | 169.4 |
| B | 4 | 170 | 4092289 | 34472.23 | 553 | 534 | 118.7 |
| B | 7 | 0 | 2948844 | 24838.93 | 553 | 534 | 118.7 |
| B | 5 | 172 | 2001597 | 16858.56 | 553 | 534 | 118.7 |
| C | 15 | 158 | 1446056 | 7942.93 | 664 | 658 | 182.0 |
| C | 15 | 157 | 197107 | 1079.55 | 664 | 658 | 182.0 |
| C | 15 | 234 | 157304 | 860.82 | 664 | 658 | 182.0 |
| D | 2 | 165 | 3355997 | 20765.94 | 579 | 558 | 161.6 |
| D | 5 | 157 | 388242 | 2399.28 | 579 | 558 | 161.6 |
| D | 8 | 48 | 292828 | 1808.78 | 579 | 558 | 161.6 |
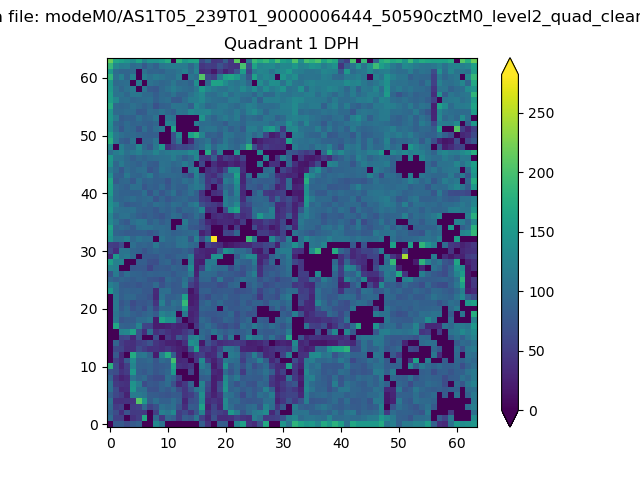
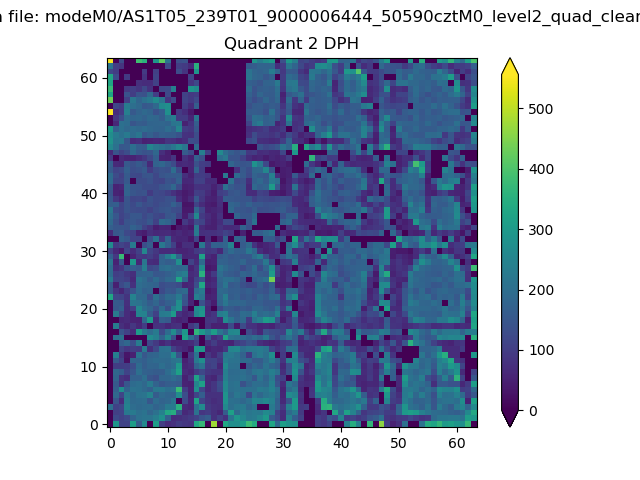
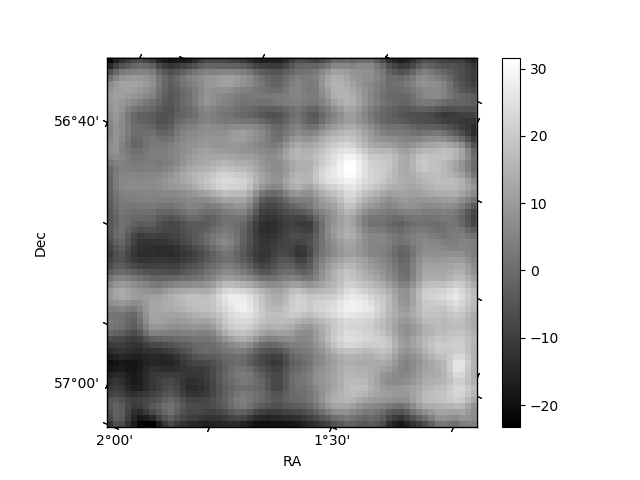
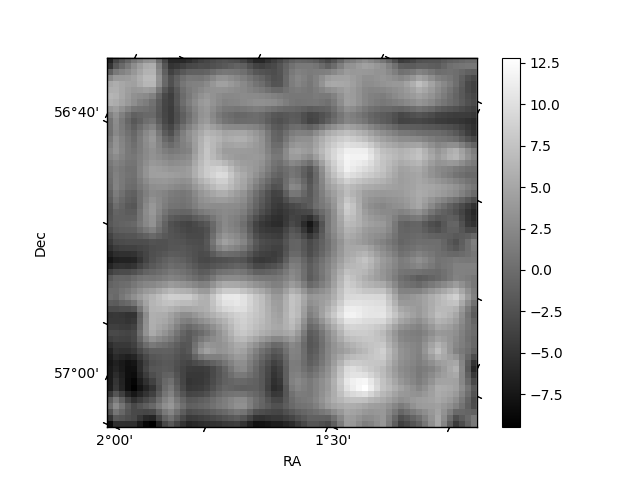
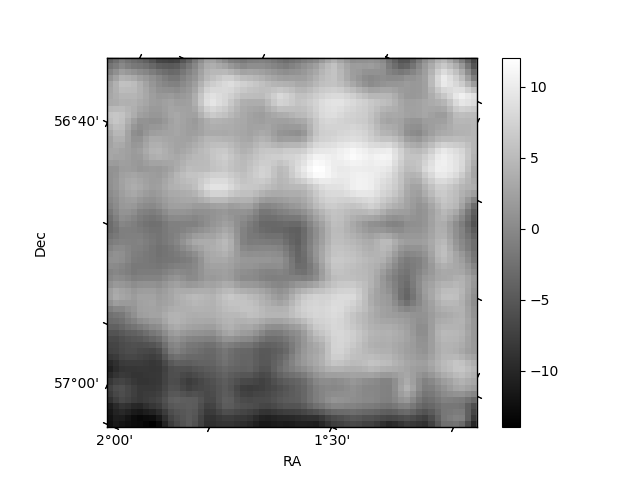
Histogram calculated using DETX and DETY for each event in the final _common_clean file
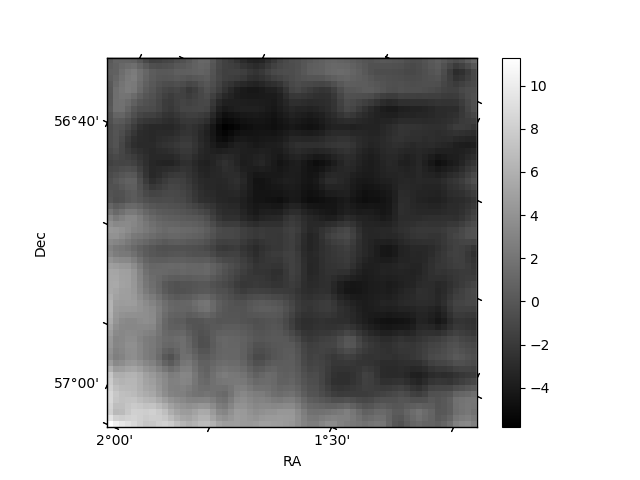
| Quadrant A | 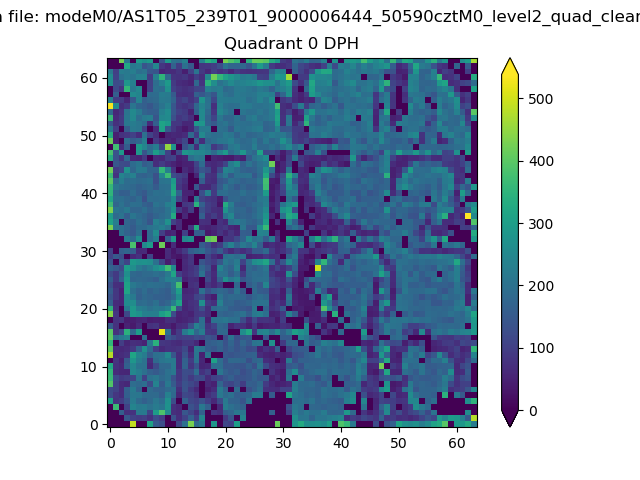 |
 |
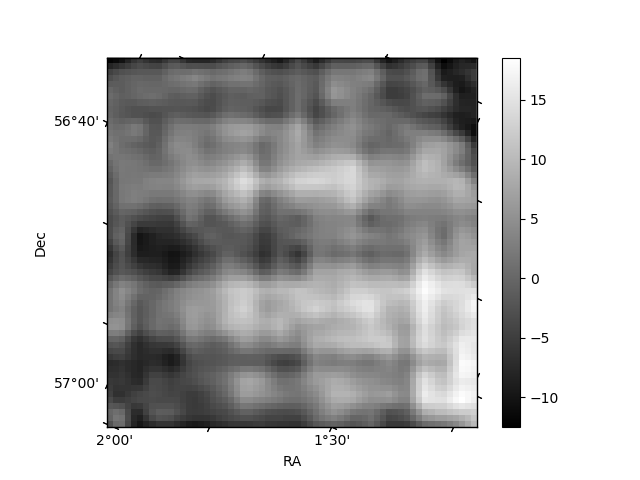
Quadrant B |
|---|---|---|---|
| Quadrant D | 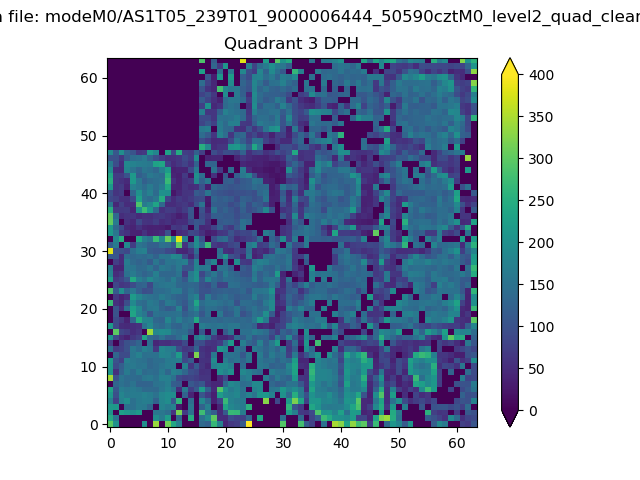 |
 |
Quadrant C |
| Plot type | Count rate plots | Images |
|---|---|---|
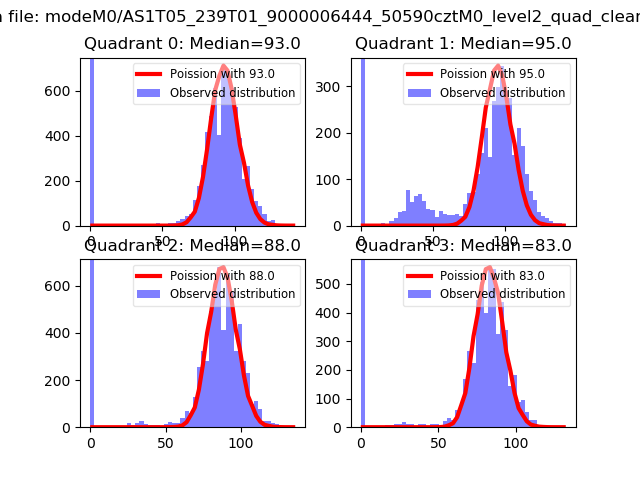
| Comparison with Poisson distribution Blue bars denote a histogram of data divided into 1 sec bins. Red curve is a Poisson curve with rate = median count rate of data. |
 |
 |
| Quadrant-wise count rates Data is divided into 100 sec bins |
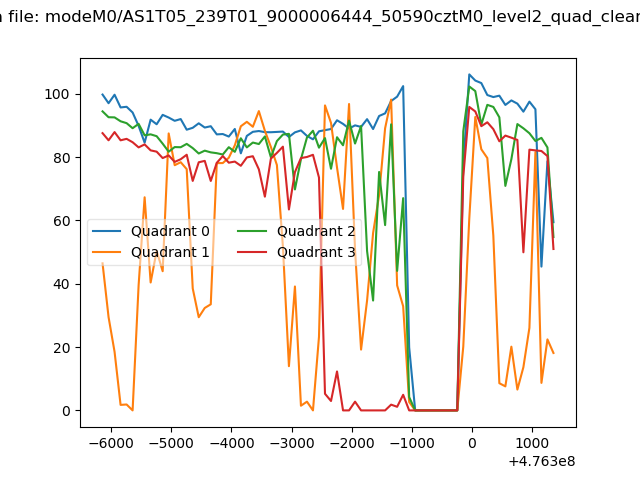 |
|
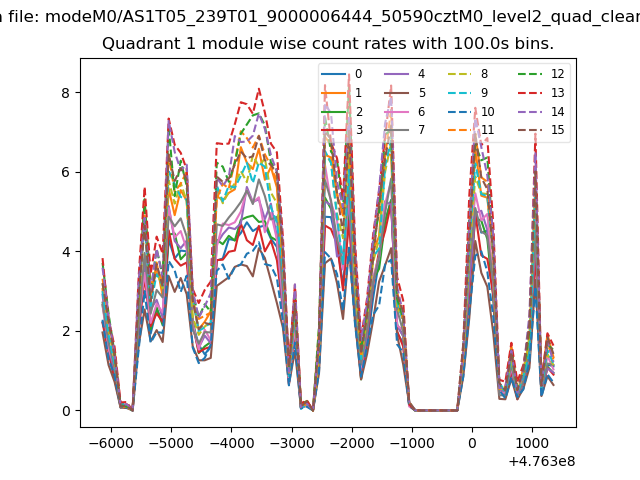
| Module-wise count rates for Quadrant A Data is divided into 100 sec bins |
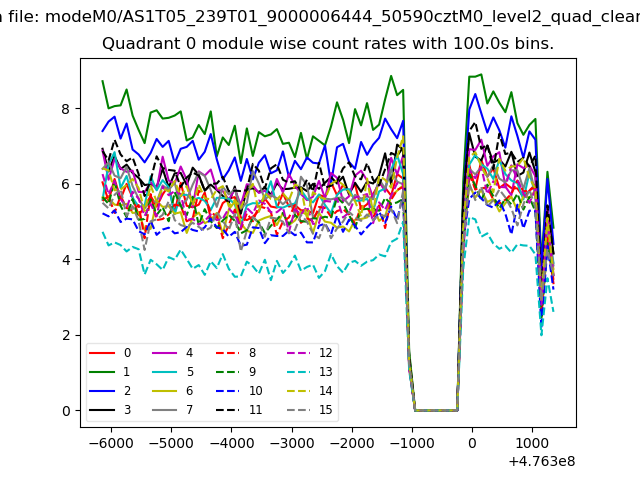 |
 |
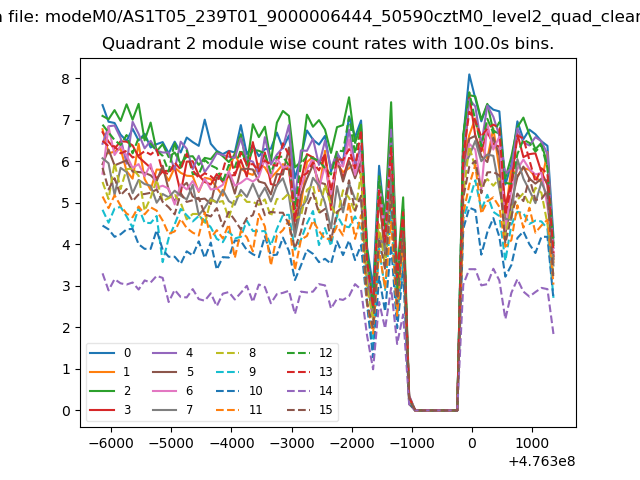
| Module-wise count rates for Quadrant B Data is divided into 100 sec bins |
 |
 |
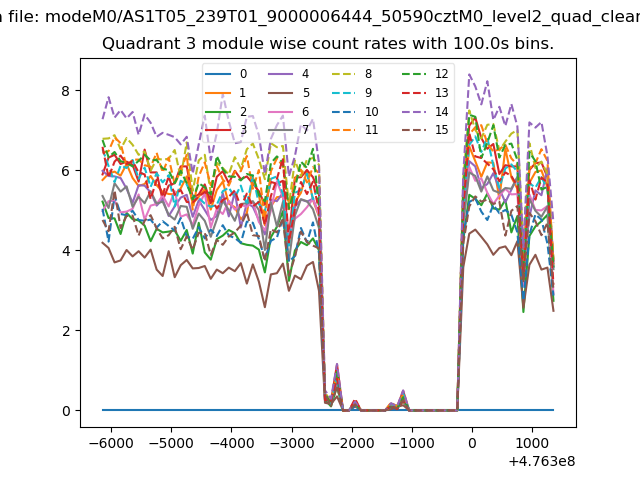
| Module-wise count rates for Quadrant C Data is divided into 100 sec bins |
 |
 |
| Module-wise count rates for Quadrant D Data is divided into 100 sec bins |
 |
 |
| Parameter | Plot |
|---|---|
| CZT HV Monitor |  |
| D_VDD | 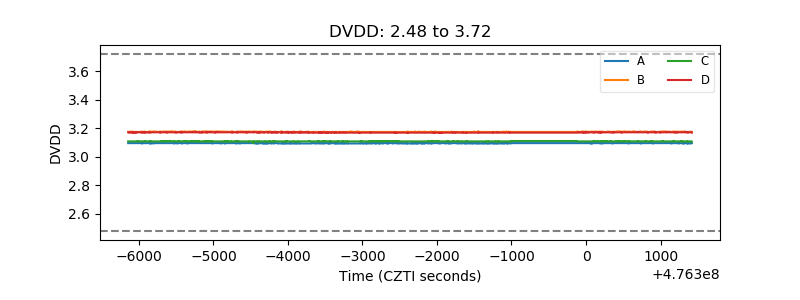 |
| Temperature 1 | 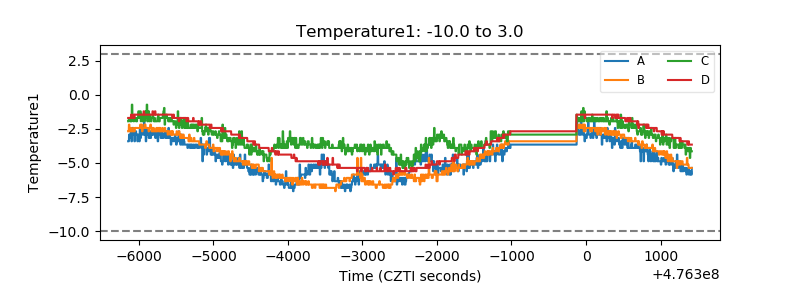 |
| Veto HV Monitor | 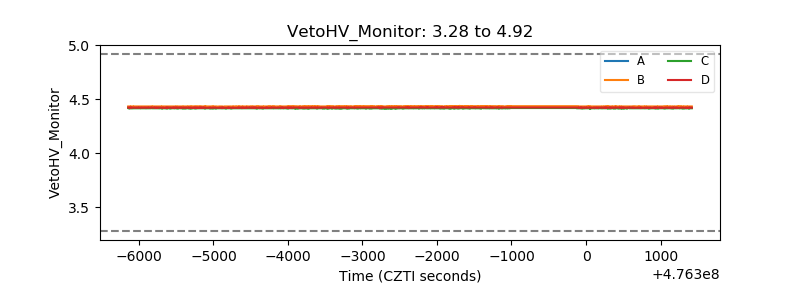 |
| Veto LLD | 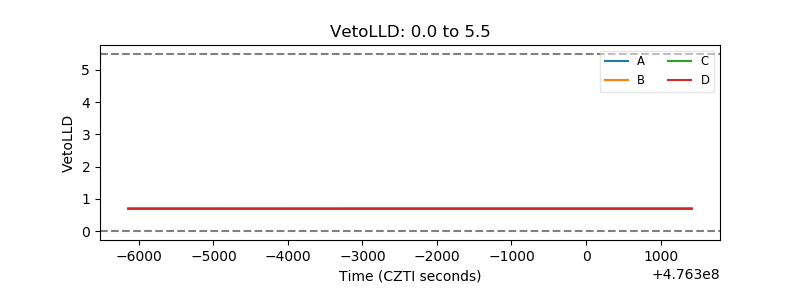 |
| Alpha Counter | 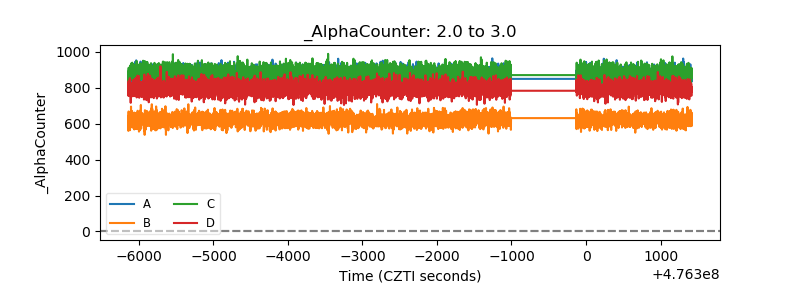 |
| _CPM_Rate | 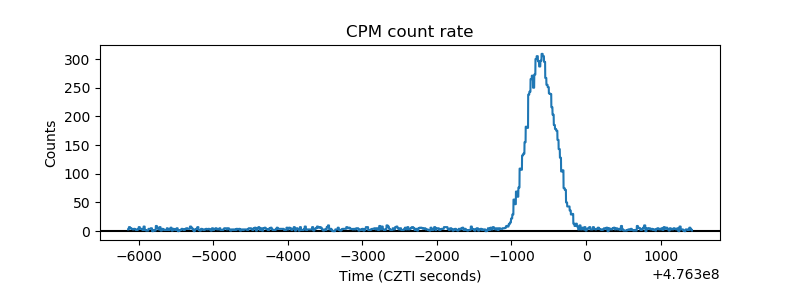 |
| CZT Counter | 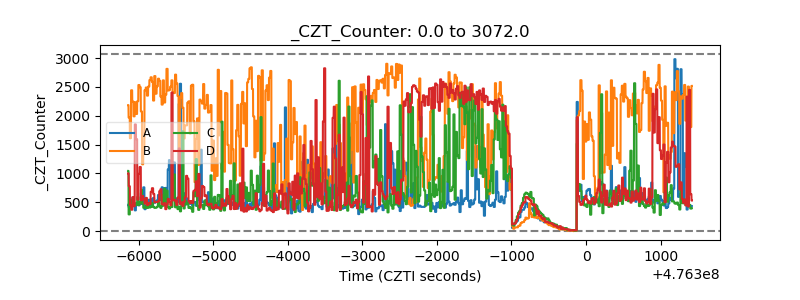 |
| +2.5 Volts monitor | 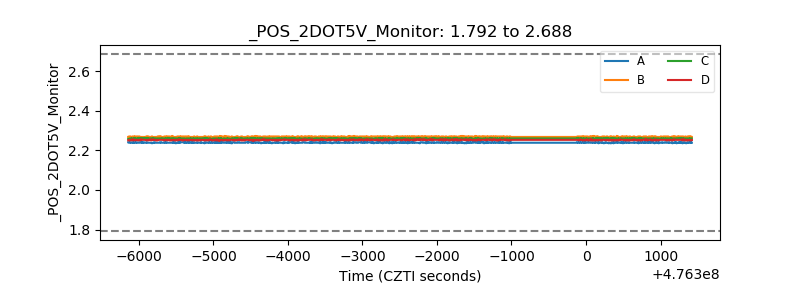 |
| +5 Volts monitor |  |
| _ROLL_ROT | 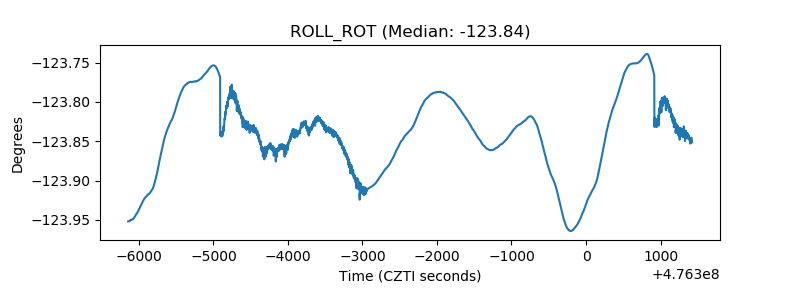 |
| _Roll_DEC | 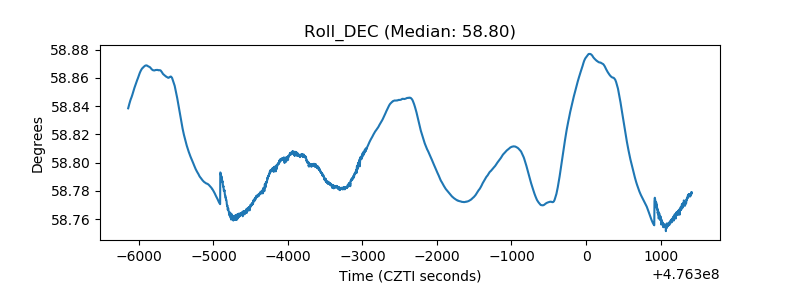 |
| _Roll_RA | 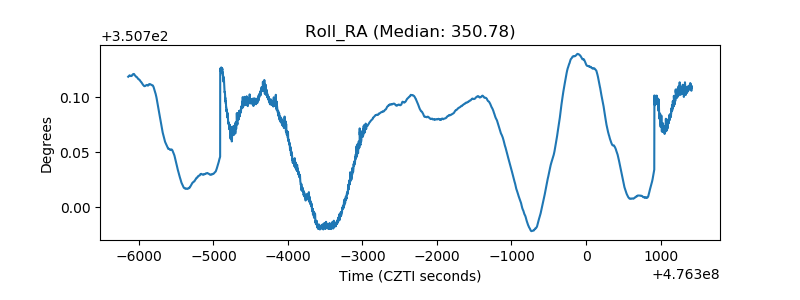 |
| Veto Counter | 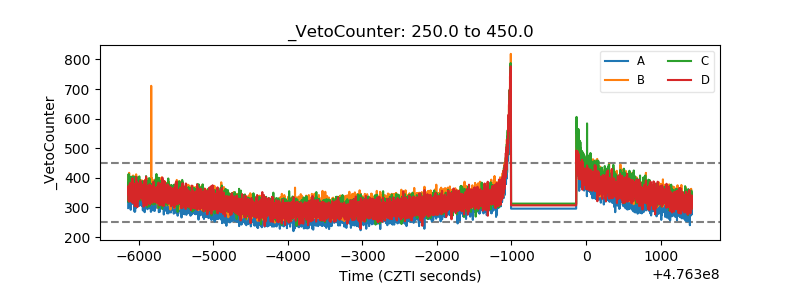 |