| Param | Original file | Final file |
|---|---|---|
| Filename | modeM0/AS1T05_239T01_9000006444_50592cztM0_level2.fits | modeM0/AS1T05_239T01_9000006444_50592cztM0_level2_quad_clean.evt |
| Size (bytes) | 676,192,320 | 83,715,840 |
| Size | 644.9 MB | 79.8 MB |
| Events in quadrant A | 4,098,570 | 584,372 |
| Events in quadrant B | 10,006,725 | 444,939 |
| Events in quadrant C | 5,264,013 | 531,316 |
| Events in quadrant D | 5,167,681 | 529,238 |
| Mode M0 | |||
|---|---|---|---|
| Quadrant | BADHDUFLAG | Total packets | Discarded packets |
| A | 0 | 16587 | 1 |
| B | 0 | 34148 | 1 |
| C | 0 | 19990 | 1 |
| D | 0 | 19823 | 1 |
| Mode M9 | |||
|---|---|---|---|
| Quadrant | BADHDUFLAG | Total packets | Discarded packets |
| A | 0 | 10 | 0 |
| B | 0 | 10 | 0 |
| C | 0 | 10 | 0 |
| D | 0 | 10 | 0 |
| Mode SS | |||
|---|---|---|---|
| Quadrant | BADHDUFLAG | Total packets | Discarded packets |
| A | 0 | 130 | 0 |
| B | 0 | 130 | 0 |
| C | 0 | 130 | 0 |
| D | 0 | 130 | 0 |
| Quadrant | Total seconds | Saturated seconds | Saturation percentage |
|---|---|---|---|
| A | 6371 | 234 | 3.672893% |
| B | 6371 | 2349 | 36.870193% |
| C | 6371 | 584 | 9.166536% |
| D | 6372 | 247 | 3.876334% |
Noise dominated data is calculated using 1-second bins in cleaned event files. If a bin has >2000 counts, and if more than 50% of those come from <1% of pixels, then it is considered to be noise-dominated and hence unusable.
| Quadrant | # 1 sec bins | Bins with >0 counts | Bins with >2000 counts | High rate bins dominated by noise | Noise dominated (total time) | Noise dominated (detector-on time) | Marked lightcurve |
|---|---|---|---|---|---|---|---|
| A | 7421 | 6372 | 205 | 205 | 2.76% | 3.22% | 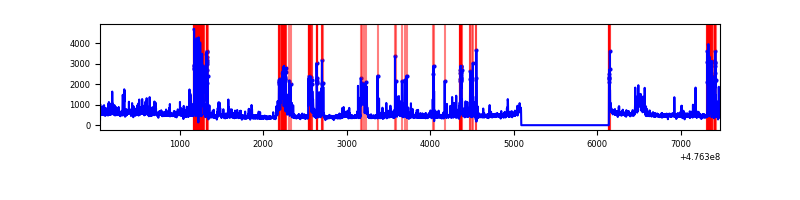 |
| B | 7421 | 6372 | 1893 | 1893 | 25.51% | 29.71% | 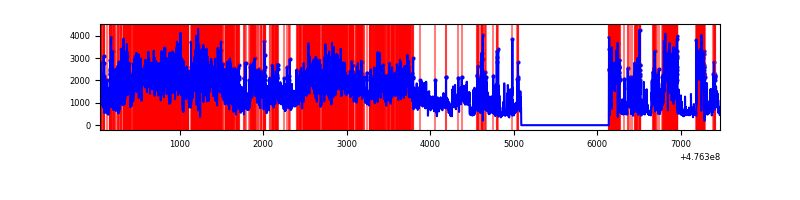 |
| C | 7421 | 6372 | 517 | 517 | 6.97% | 8.11% | 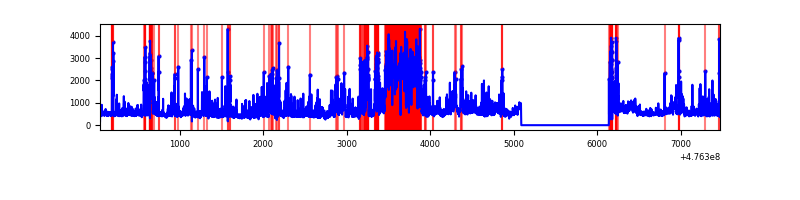 |
| D | 7422 | 6373 | 235 | 235 | 3.17% | 3.69% | 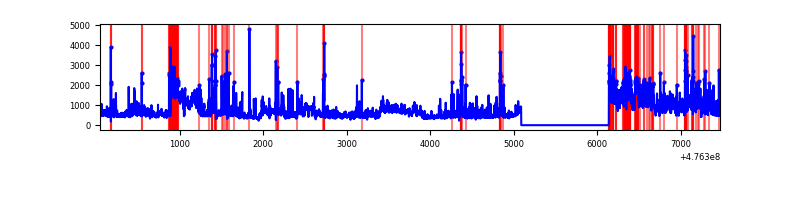 |
Top three noisy pixels from each quadrant. If the there are fewer than three noisy pixels in the level2.evt file, extra rows are filled as -1
| Pixel properties | Quadrant properties | ||||||
|---|---|---|---|---|---|---|---|
| Quadrant | DetID | PixID | Counts | Sigma | Mean | Median | Sigma |
| A | 12 | 250 | 470200 | 2862.96 | 655 | 638 | 164.0 |
| A | 8 | 38 | 361320 | 2199.11 | 655 | 638 | 164.0 |
| A | 4 | 3 | 133350 | 809.16 | 655 | 638 | 164.0 |
| B | 4 | 170 | 3743871 | 30045.39 | 579 | 557 | 124.6 |
| B | 5 | 172 | 1657943 | 13302.87 | 579 | 557 | 124.6 |
| B | 7 | 0 | 1181442 | 9478.27 | 579 | 557 | 124.6 |
| C | 15 | 147 | 1056240 | 6015.36 | 627 | 623 | 175.5 |
| C | 15 | 234 | 273079 | 1552.57 | 627 | 623 | 175.5 |
| C | 13 | 3 | 220856 | 1254.98 | 627 | 623 | 175.5 |
| D | 10 | 98 | 973065 | 5517.61 | 638 | 615 | 176.2 |
| D | 5 | 157 | 713925 | 4047.27 | 638 | 615 | 176.2 |
| D | 2 | 249 | 167271 | 945.59 | 638 | 615 | 176.2 |
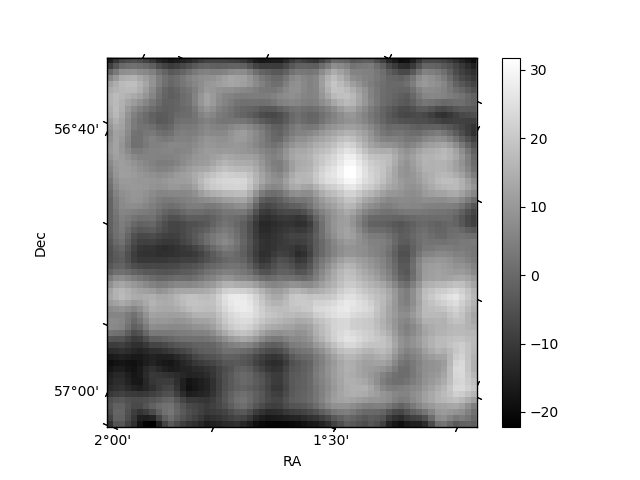
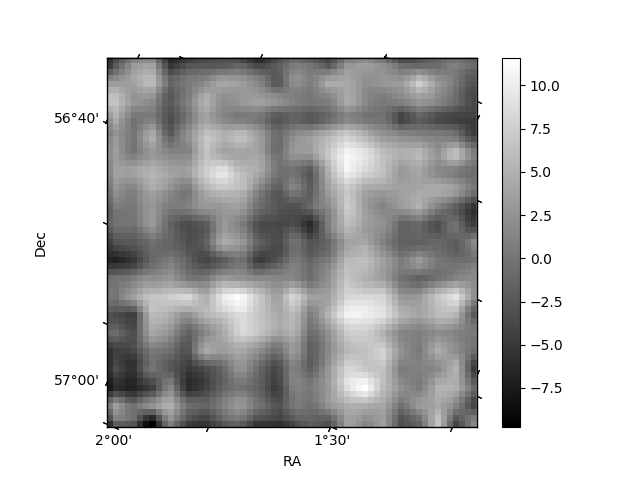
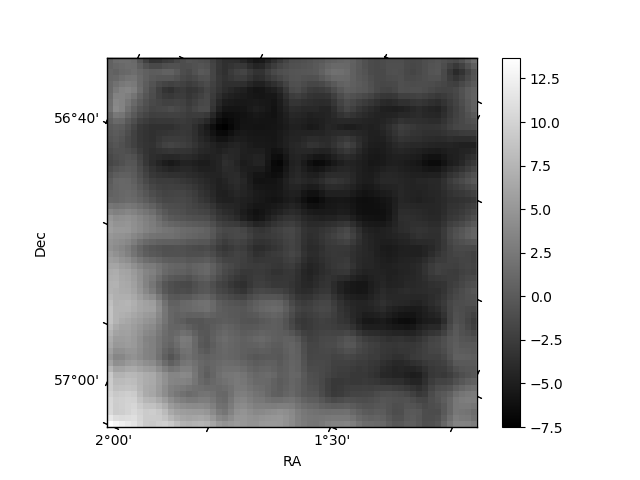
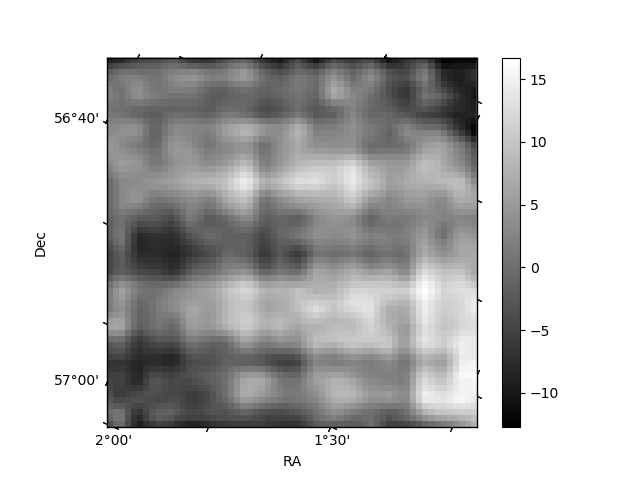
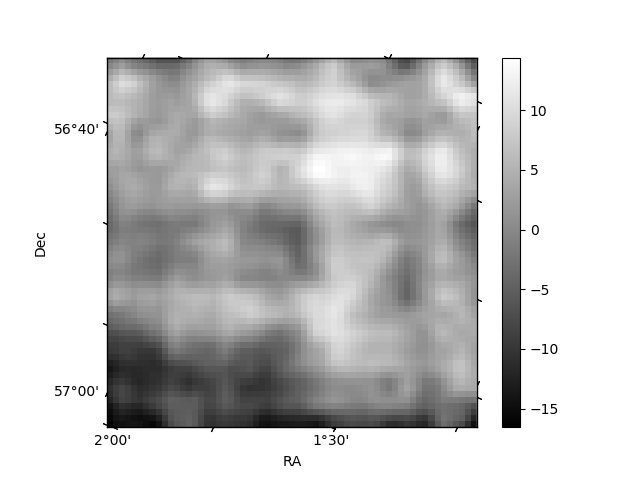
Histogram calculated using DETX and DETY for each event in the final _common_clean file
| Quadrant A | 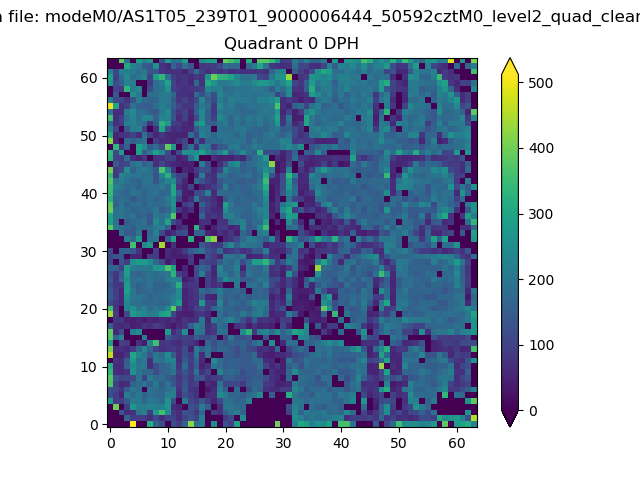 |
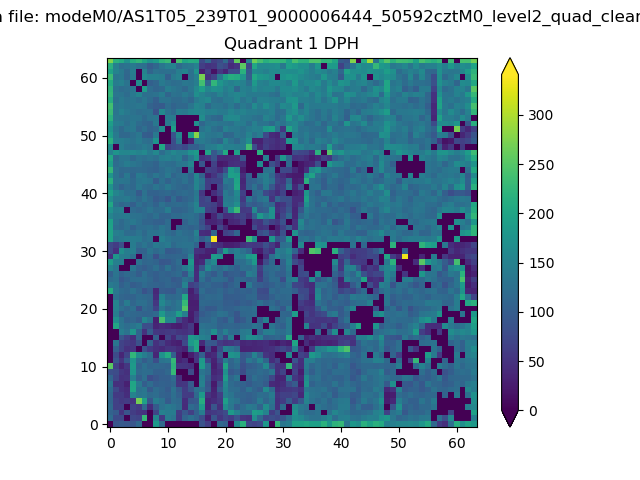 |
Quadrant B |
|---|---|---|---|
| Quadrant D |  |
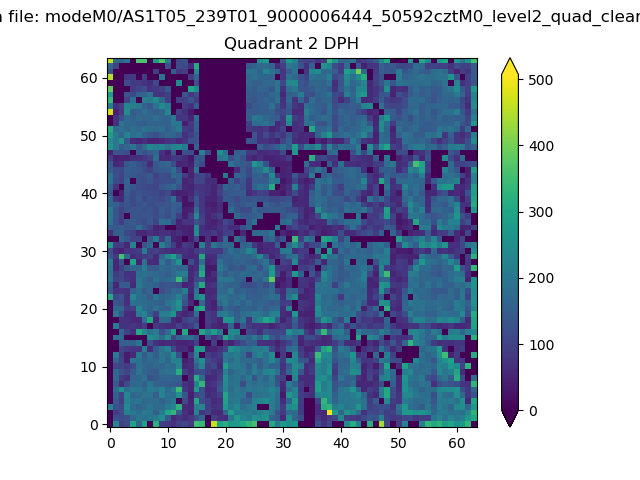 |
Quadrant C |
| Plot type | Count rate plots | Images |
|---|---|---|
| Comparison with Poisson distribution Blue bars denote a histogram of data divided into 1 sec bins. Red curve is a Poisson curve with rate = median count rate of data. |
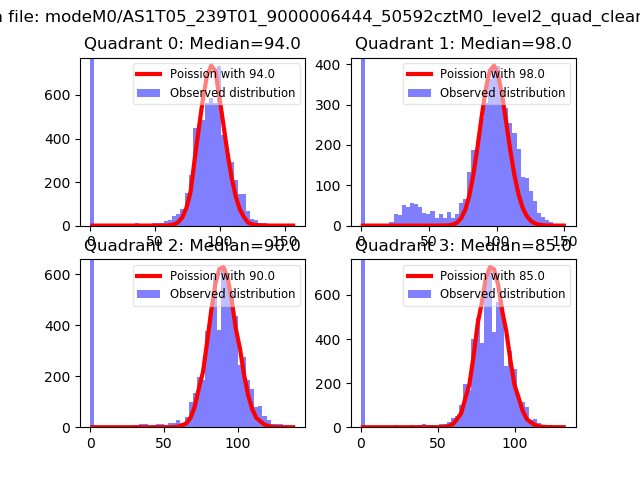 |
 |
| Quadrant-wise count rates Data is divided into 100 sec bins |
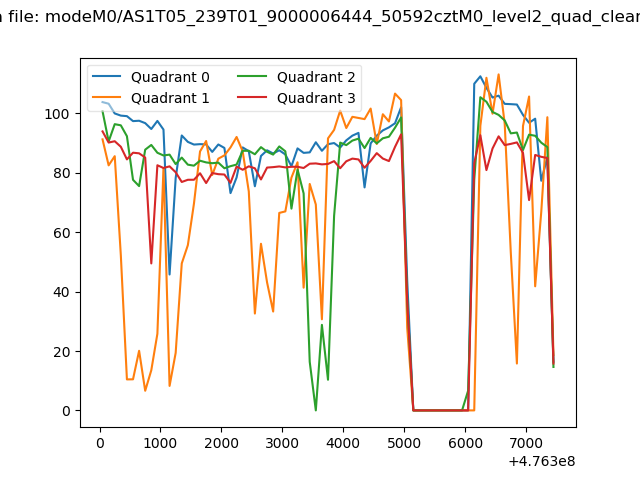 |
|
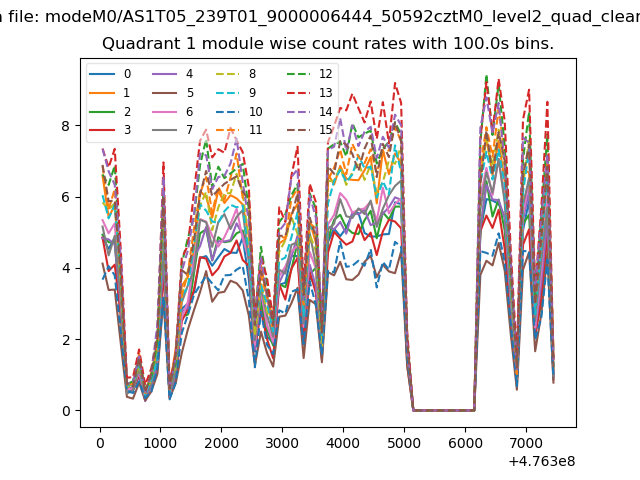
| Module-wise count rates for Quadrant A Data is divided into 100 sec bins |
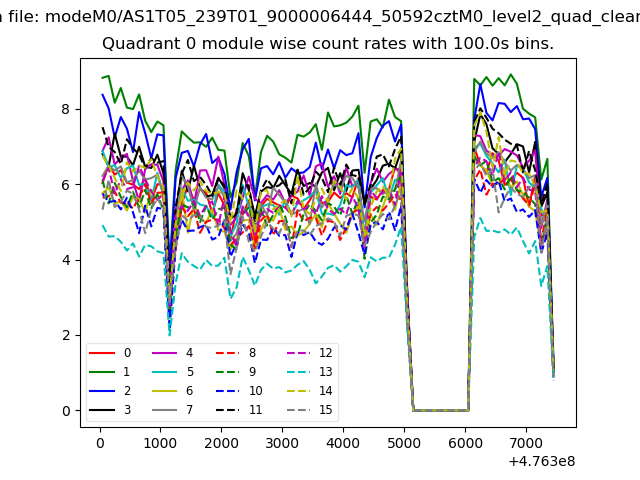 |
 |
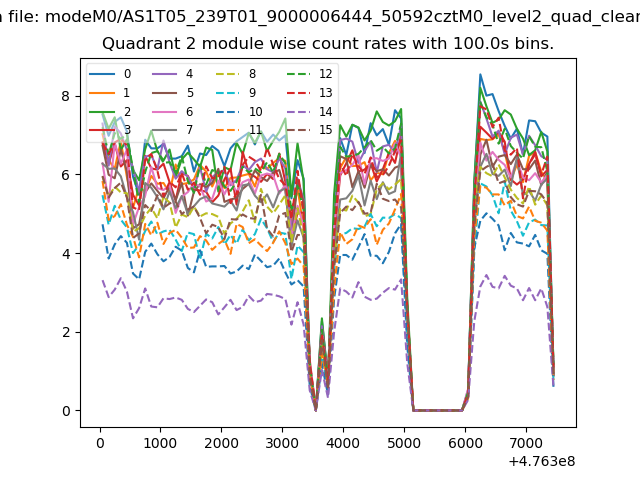
| Module-wise count rates for Quadrant B Data is divided into 100 sec bins |
 |
 |
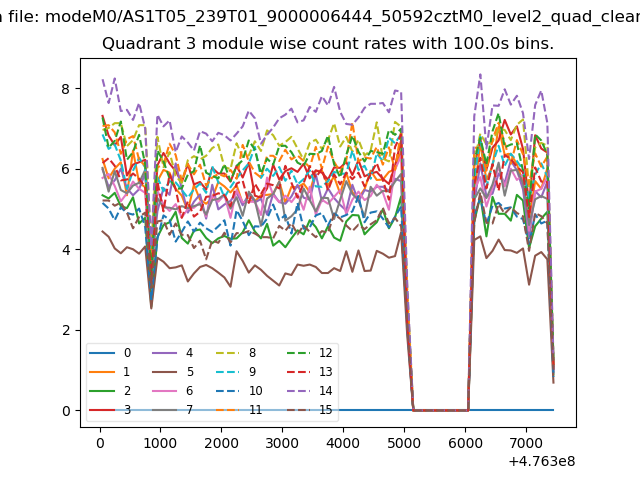
| Module-wise count rates for Quadrant C Data is divided into 100 sec bins |
 |
 |
| Module-wise count rates for Quadrant D Data is divided into 100 sec bins |
 |
 |
| Parameter | Plot |
|---|---|
| CZT HV Monitor | 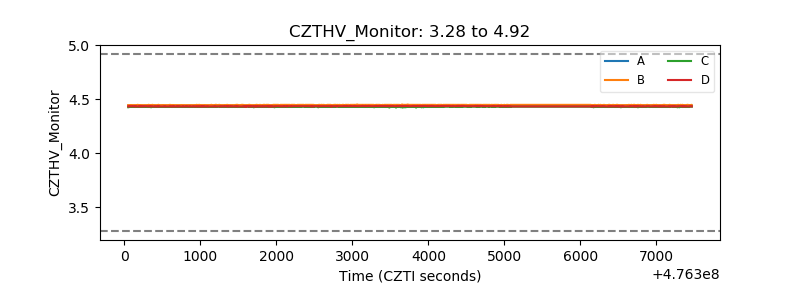 |
| D_VDD | 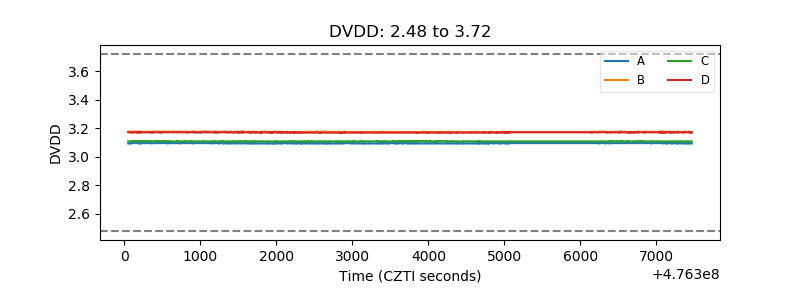 |
| Temperature 1 | 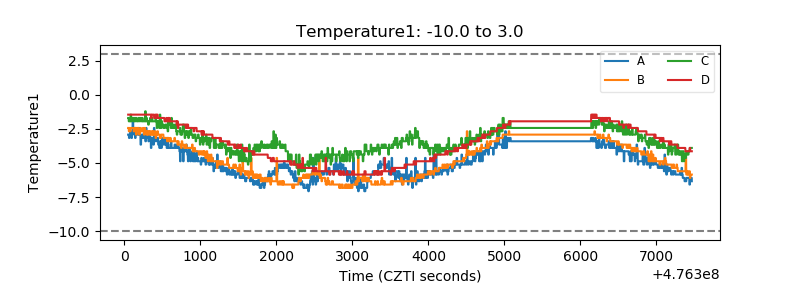 |
| Veto HV Monitor | 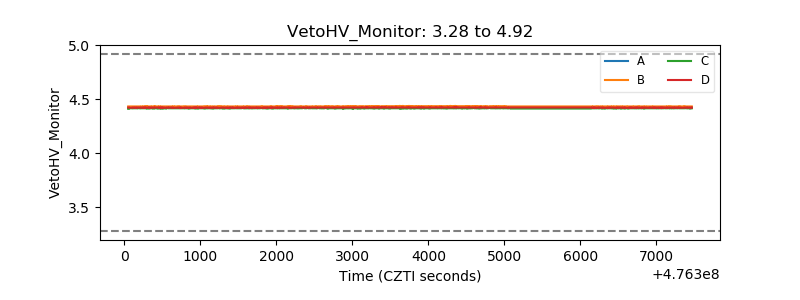 |
| Veto LLD | 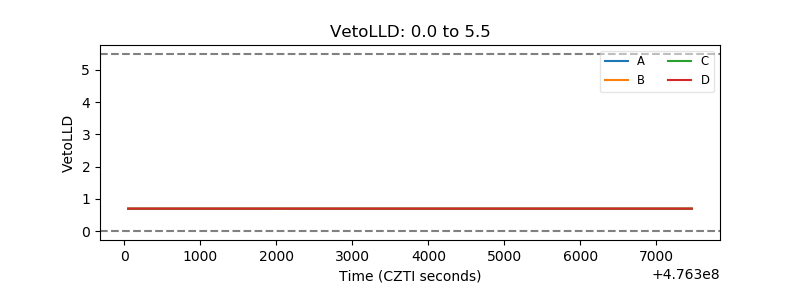 |
| Alpha Counter | 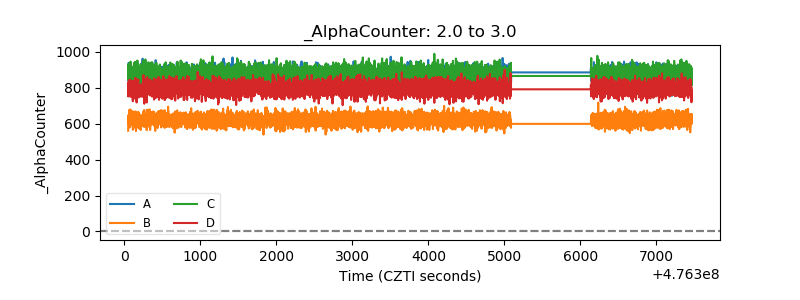 |
| _CPM_Rate | 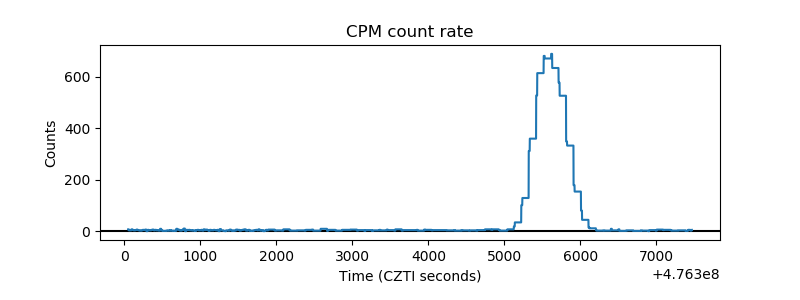 |
| CZT Counter | 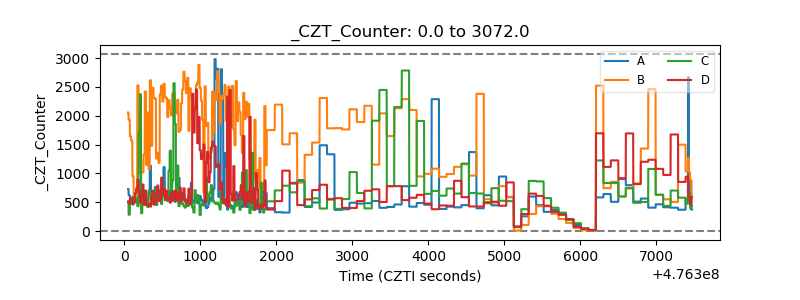 |
| +2.5 Volts monitor |  |
| +5 Volts monitor | 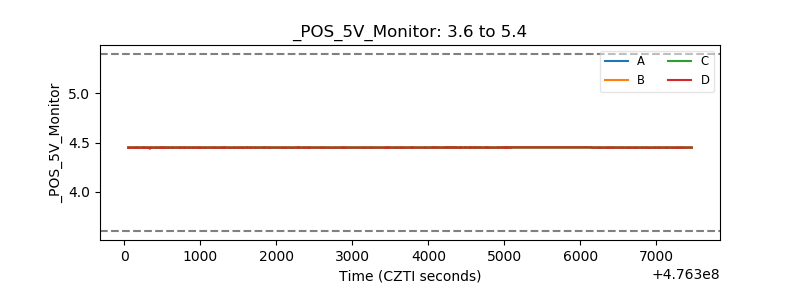 |
| _ROLL_ROT | 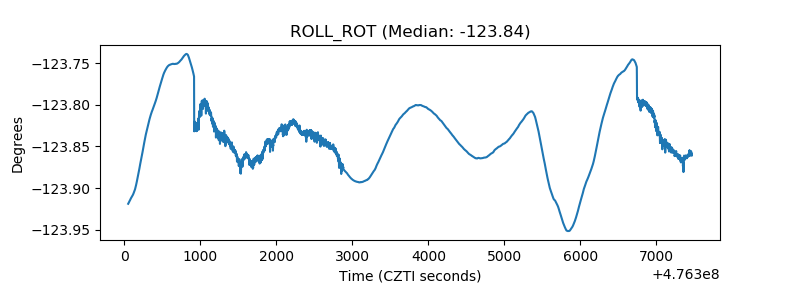 |
| _Roll_DEC | 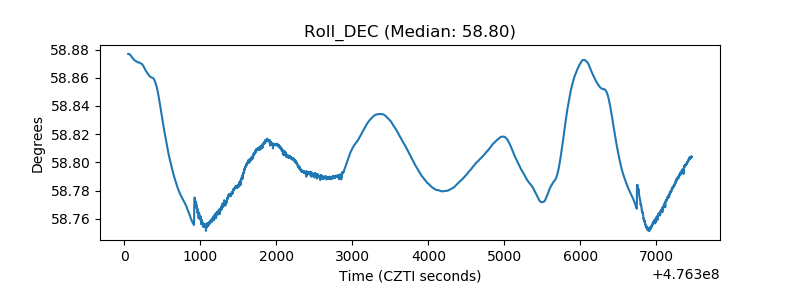 |
| _Roll_RA | 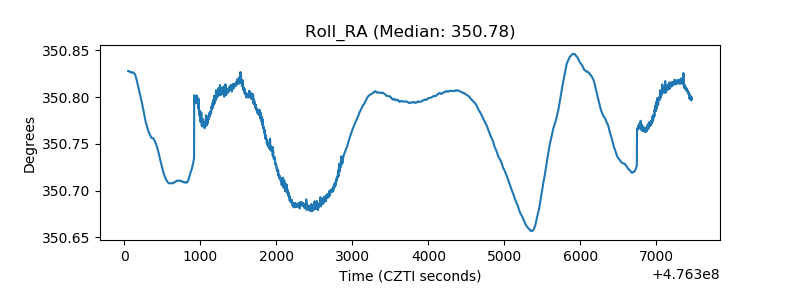 |
| Veto Counter | 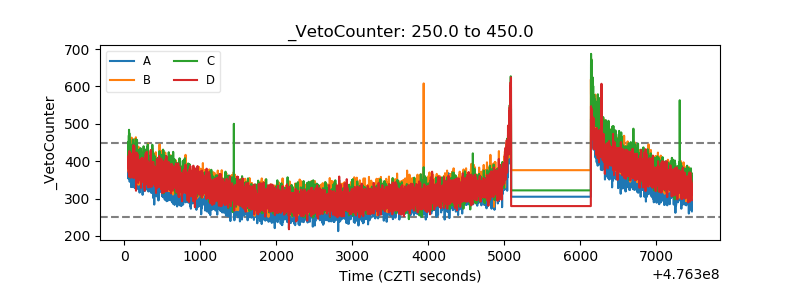 |