| Param | Original file | Final file |
|---|---|---|
| Filename | modeM0/AS1T05_239T01_9000006444_50593cztM0_level2.fits | modeM0/AS1T05_239T01_9000006444_50593cztM0_level2_quad_clean.evt |
| Size (bytes) | 544,878,720 | 89,199,360 |
| Size | 519.6 MB | 85.1 MB |
| Events in quadrant A | 3,596,112 | 602,294 |
| Events in quadrant B | 6,426,505 | 548,957 |
| Events in quadrant C | 4,451,961 | 575,815 |
| Events in quadrant D | 5,204,927 | 532,822 |
| Mode M0 | |||
|---|---|---|---|
| Quadrant | BADHDUFLAG | Total packets | Discarded packets |
| A | 0 | 15101 | 2 |
| B | 0 | 23456 | 2 |
| C | 0 | 17529 | 2 |
| D | 0 | 19891 | 4 |
| Mode M9 | |||
|---|---|---|---|
| Quadrant | BADHDUFLAG | Total packets | Discarded packets |
| A | 0 | 17 | 0 |
| B | 0 | 18 | 0 |
| C | 0 | 18 | 0 |
| D | 0 | 18 | 0 |
| Mode SS | |||
|---|---|---|---|
| Quadrant | BADHDUFLAG | Total packets | Discarded packets |
| A | 0 | 128 | 0 |
| B | 0 | 128 | 0 |
| C | 0 | 128 | 0 |
| D | 0 | 128 | 0 |
| Quadrant | Total seconds | Saturated seconds | Saturation percentage |
|---|---|---|---|
| A | 6316 | 123 | 1.947435% |
| B | 6316 | 1216 | 19.252692% |
| C | 6316 | 250 | 3.958201% |
| D | 6315 | 402 | 6.365796% |
Noise dominated data is calculated using 1-second bins in cleaned event files. If a bin has >2000 counts, and if more than 50% of those come from <1% of pixels, then it is considered to be noise-dominated and hence unusable.
| Quadrant | # 1 sec bins | Bins with >0 counts | Bins with >2000 counts | High rate bins dominated by noise | Noise dominated (total time) | Noise dominated (detector-on time) | Marked lightcurve |
|---|---|---|---|---|---|---|---|
| A | 7471 | 6317 | 91 | 91 | 1.22% | 1.44% | 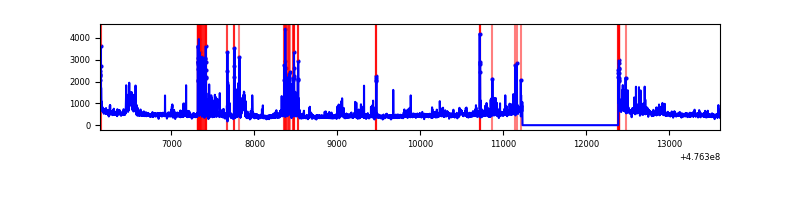 |
| B | 7471 | 6317 | 711 | 711 | 9.52% | 11.26% | 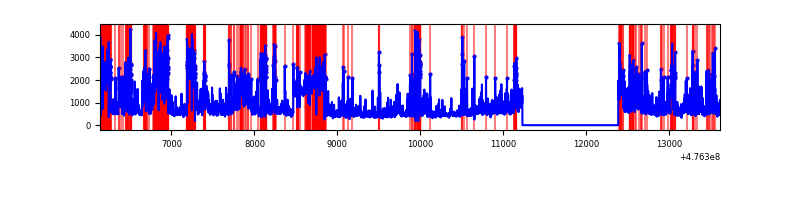 |
| C | 7471 | 6317 | 165 | 165 | 2.21% | 2.61% | 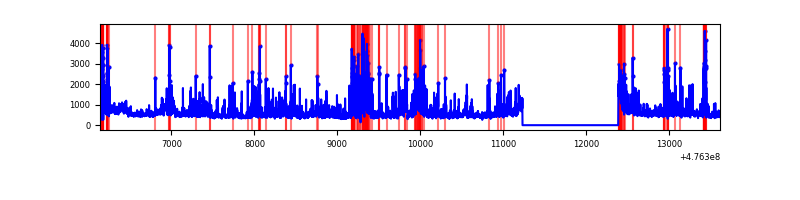 |
| D | 7470 | 6316 | 331 | 331 | 4.43% | 5.24% | 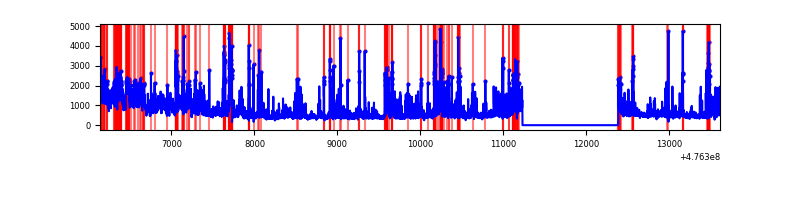 |
Top three noisy pixels from each quadrant. If the there are fewer than three noisy pixels in the level2.evt file, extra rows are filled as -1
| Pixel properties | Quadrant properties | ||||||
|---|---|---|---|---|---|---|---|
| Quadrant | DetID | PixID | Counts | Sigma | Mean | Median | Sigma |
| A | 8 | 38 | 156783 | 946.98 | 664 | 646 | 164.9 |
| A | 4 | 3 | 137421 | 829.55 | 664 | 646 | 164.9 |
| A | 3 | 130 | 99179 | 597.61 | 664 | 646 | 164.9 |
| B | 5 | 172 | 1636278 | 12805.81 | 600 | 582 | 127.7 |
| B | 4 | 170 | 534872 | 4182.94 | 600 | 582 | 127.7 |
| B | 7 | 0 | 423664 | 3312.3 | 600 | 582 | 127.7 |
| C | 13 | 3 | 285842 | 1561.97 | 655 | 650 | 182.6 |
| C | 15 | 232 | 213552 | 1166.05 | 655 | 650 | 182.6 |
| C | 15 | 158 | 195166 | 1065.35 | 655 | 650 | 182.6 |
| D | 10 | 98 | 1034737 | 5845.4 | 636 | 613 | 176.9 |
| D | 7 | 96 | 626460 | 3537.61 | 636 | 613 | 176.9 |
| D | 2 | 249 | 293899 | 1657.8 | 636 | 613 | 176.9 |
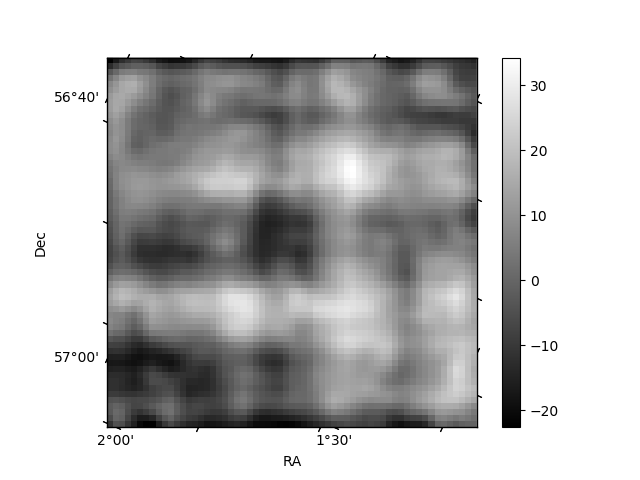
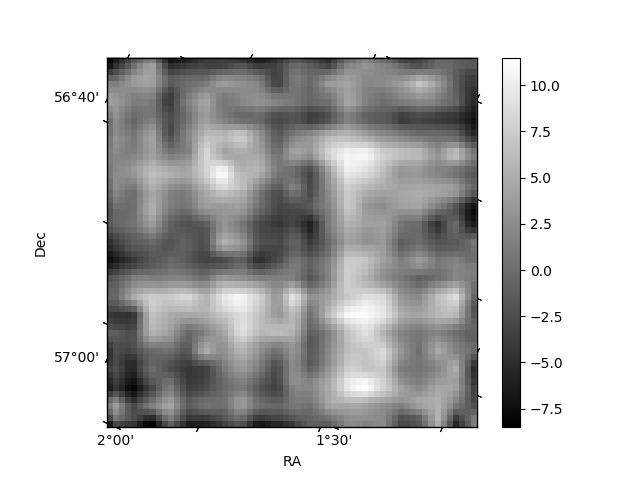
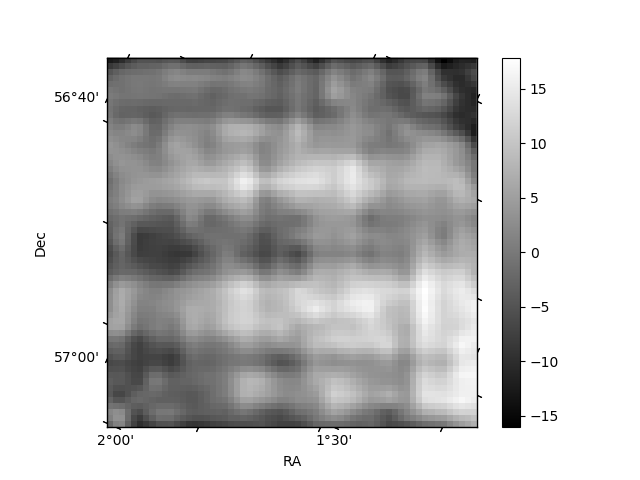
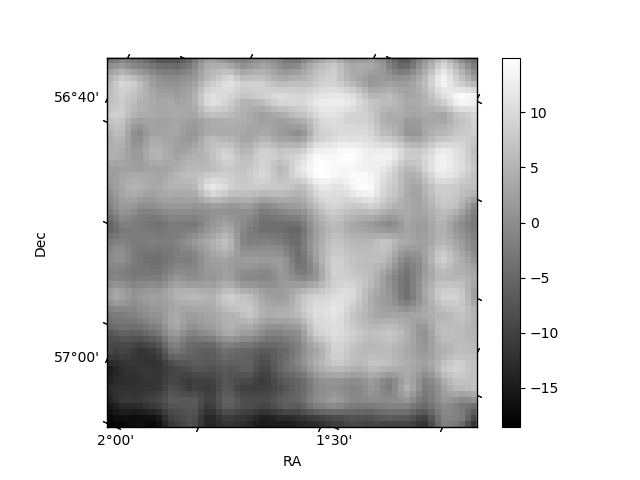
Histogram calculated using DETX and DETY for each event in the final _common_clean file
| Quadrant A | 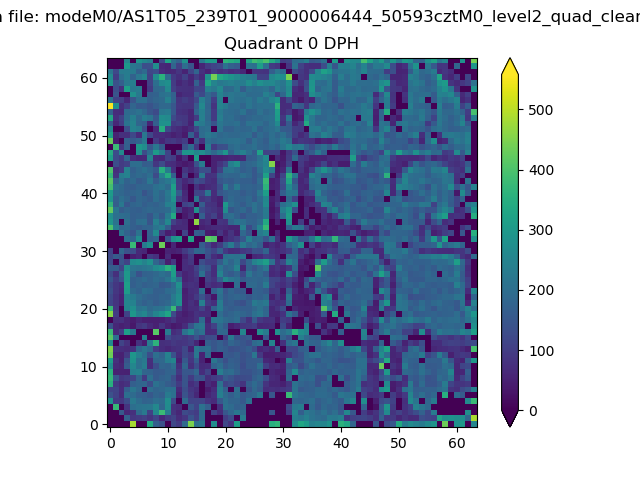 |
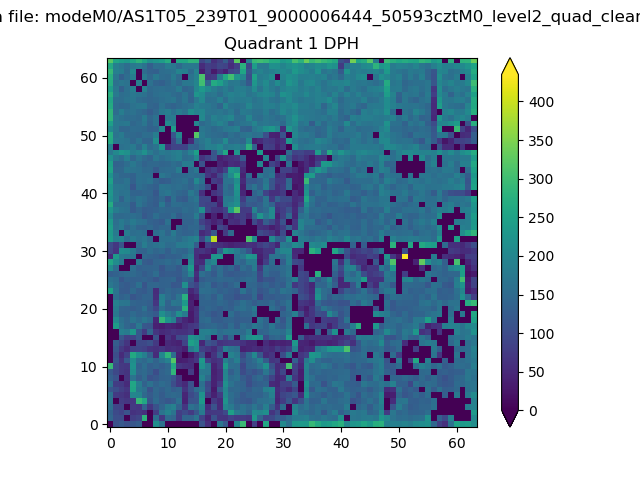 |
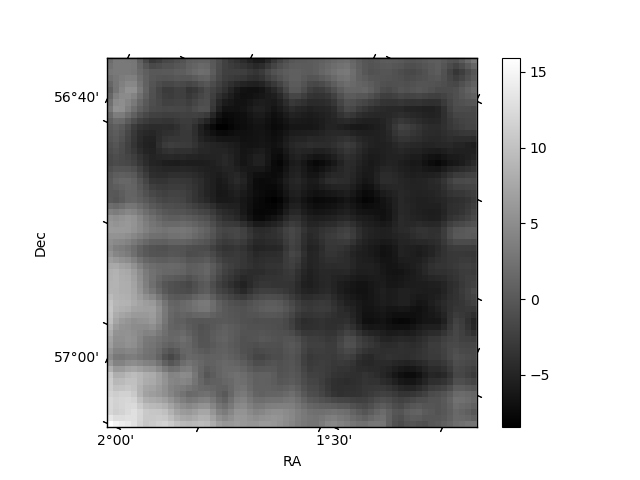
Quadrant B |
|---|---|---|---|
| Quadrant D | 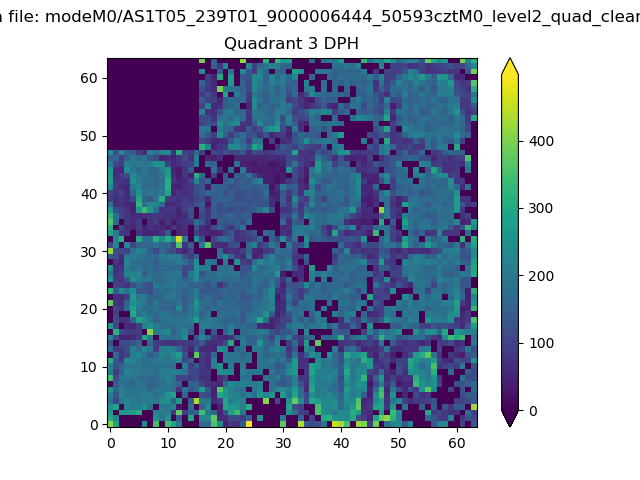 |
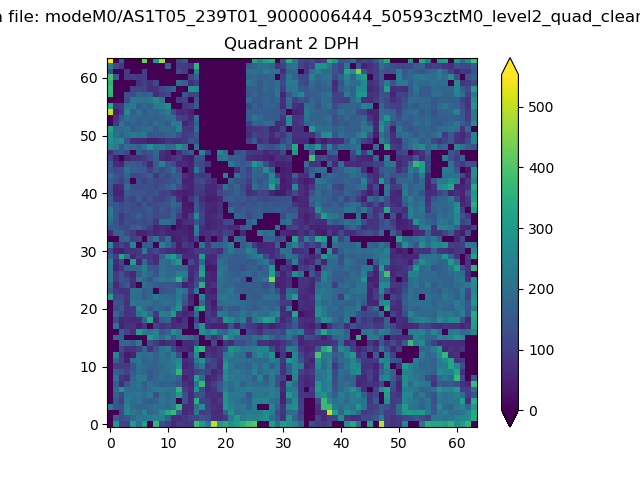 |
Quadrant C |
| Plot type | Count rate plots | Images |
|---|---|---|
| Comparison with Poisson distribution Blue bars denote a histogram of data divided into 1 sec bins. Red curve is a Poisson curve with rate = median count rate of data. |
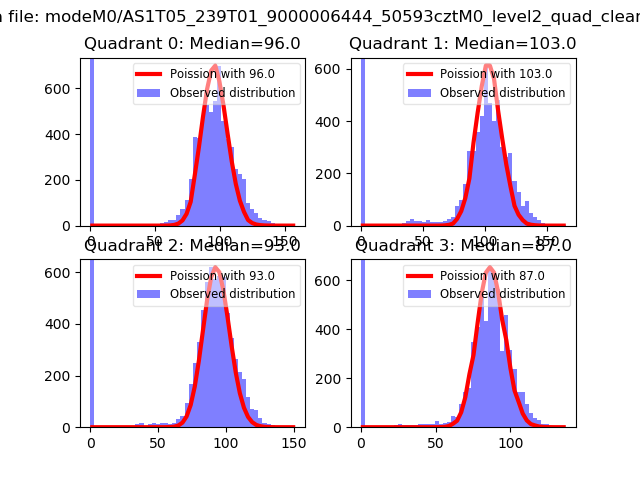 |
 |
| Quadrant-wise count rates Data is divided into 100 sec bins |
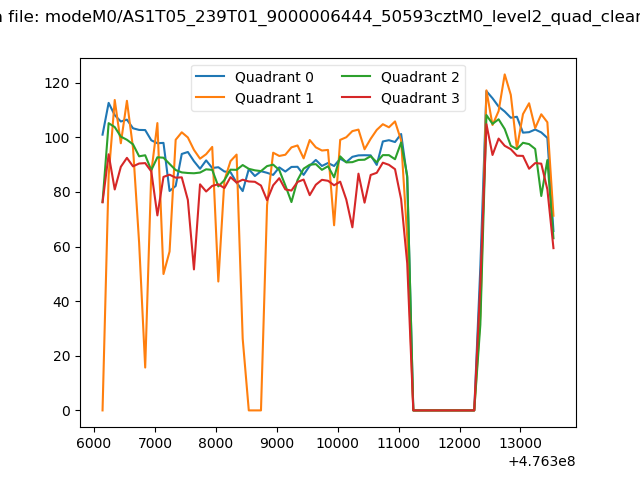 |
|
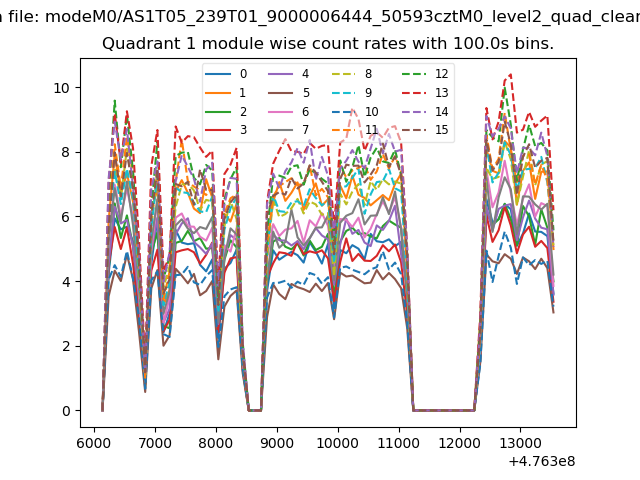
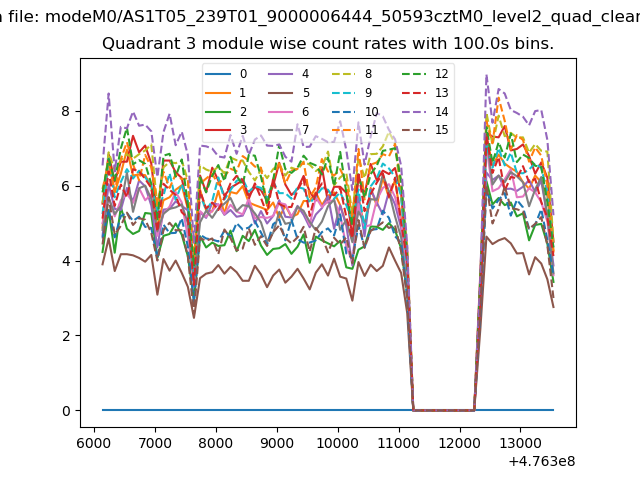
| Module-wise count rates for Quadrant A Data is divided into 100 sec bins |
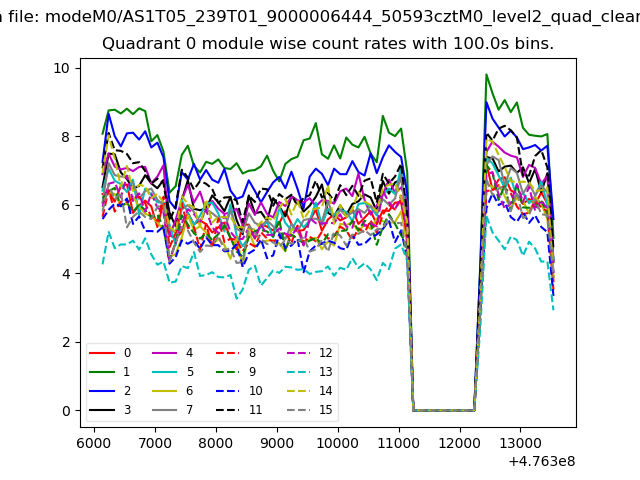 |
 |
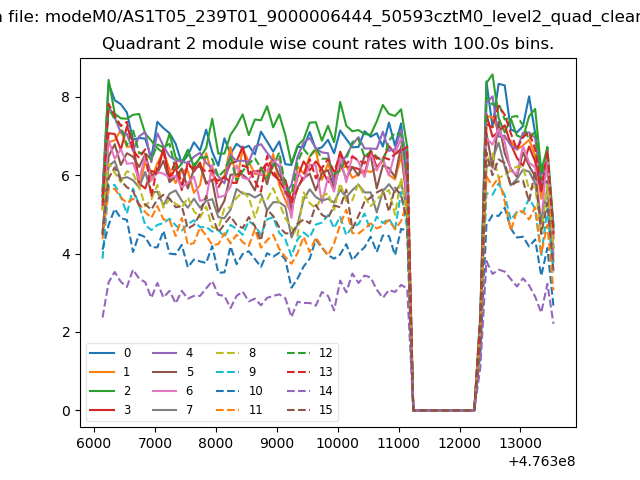
| Module-wise count rates for Quadrant B Data is divided into 100 sec bins |
 |
 |
| Module-wise count rates for Quadrant C Data is divided into 100 sec bins |
 |
 |
| Module-wise count rates for Quadrant D Data is divided into 100 sec bins |
 |
 |
| Parameter | Plot |
|---|---|
| CZT HV Monitor | 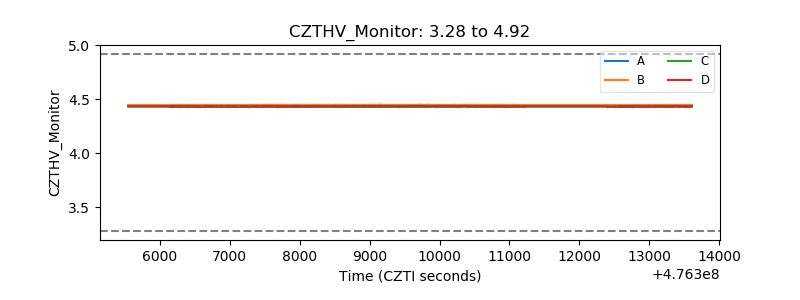 |
| D_VDD | 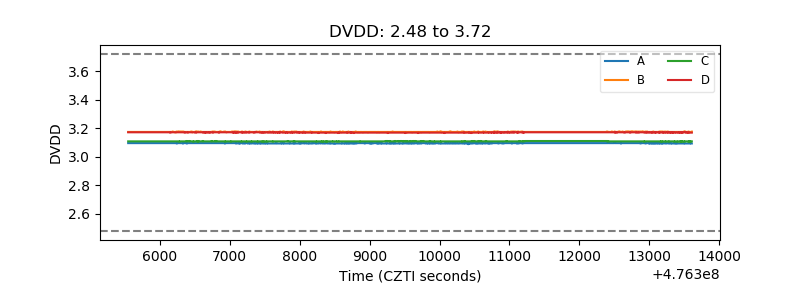 |
| Temperature 1 | 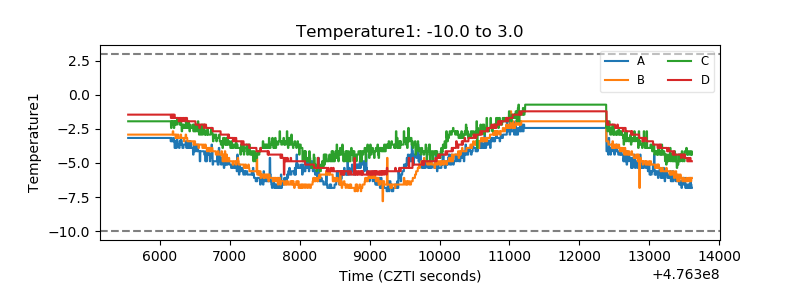 |
| Veto HV Monitor | 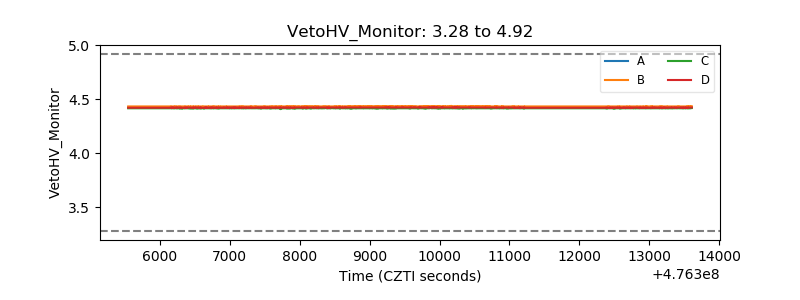 |
| Veto LLD | 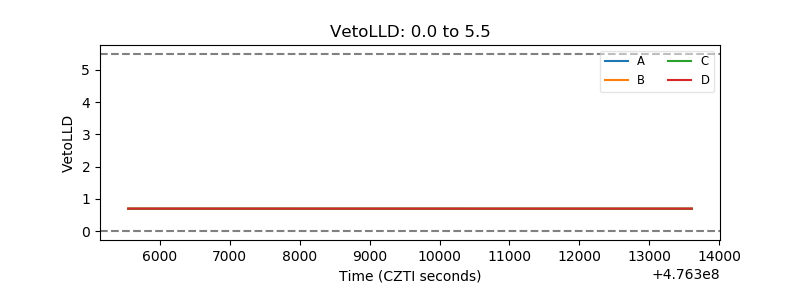 |
| Alpha Counter | 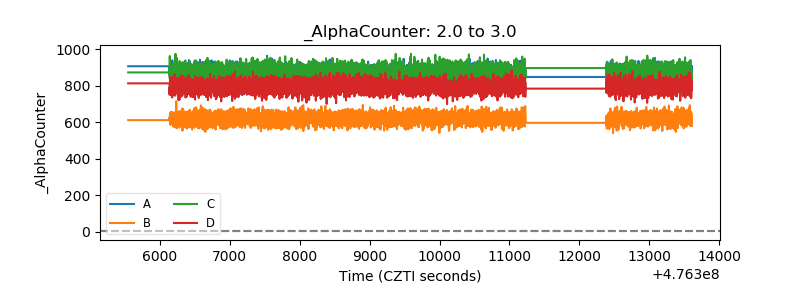 |
| _CPM_Rate | 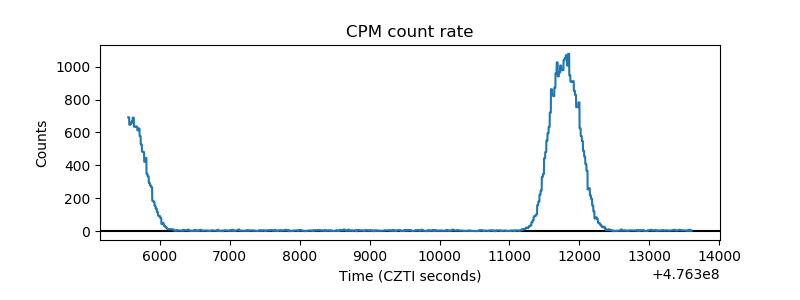 |
| CZT Counter | 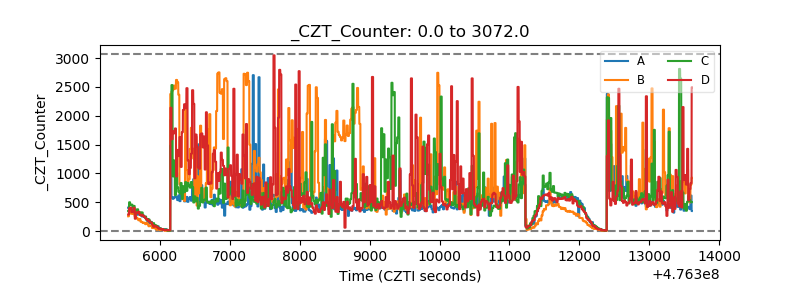 |
| +2.5 Volts monitor | 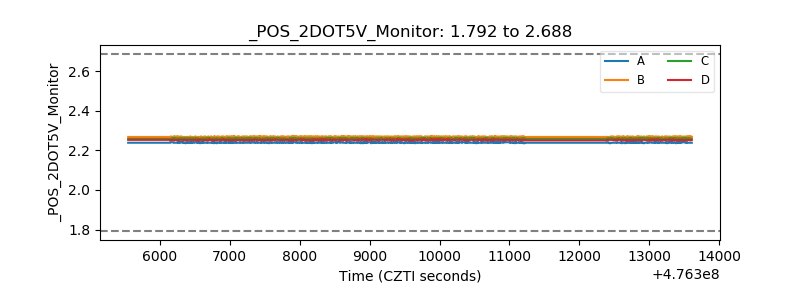 |
| +5 Volts monitor |  |
| _ROLL_ROT | 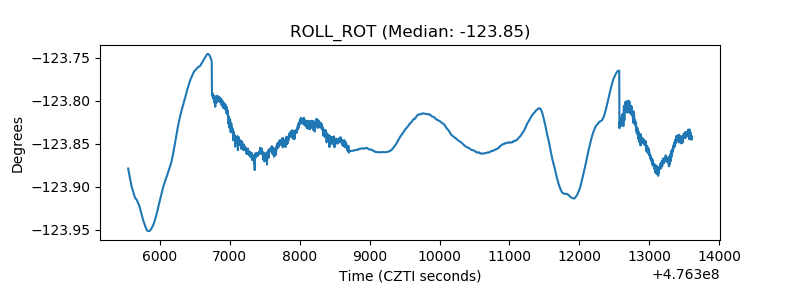 |
| _Roll_DEC | 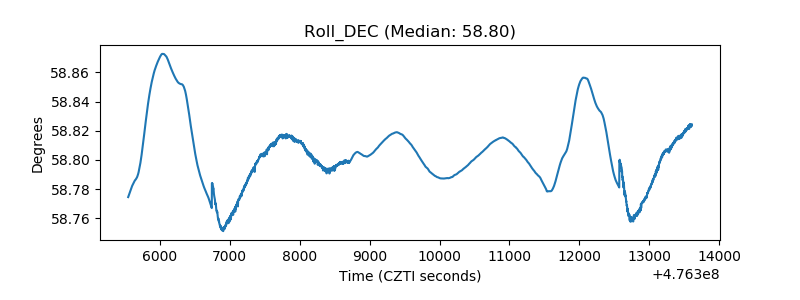 |
| _Roll_RA | 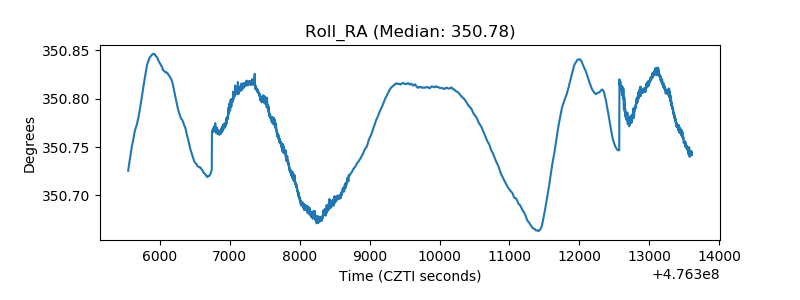 |
| Veto Counter | 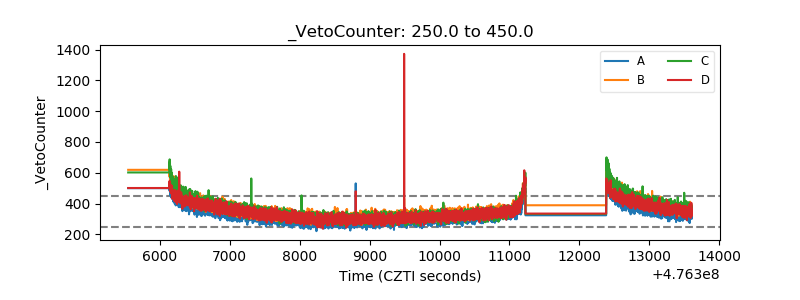 |