| Param | Original file | Final file |
|---|---|---|
| Filename | modeM0/AS1T05_239T01_9000006444_50594cztM0_level2.fits | modeM0/AS1T05_239T01_9000006444_50594cztM0_level2_quad_clean.evt |
| Size (bytes) | 608,172,480 | 93,539,520 |
| Size | 580.0 MB | 89.2 MB |
| Events in quadrant A | 4,026,644 | 616,006 |
| Events in quadrant B | 7,115,906 | 606,329 |
| Events in quadrant C | 4,690,941 | 602,938 |
| Events in quadrant D | 6,169,555 | 548,329 |
| Mode M0 | |||
|---|---|---|---|
| Quadrant | BADHDUFLAG | Total packets | Discarded packets |
| A | 0 | 16664 | 2 |
| B | 0 | 25731 | 2 |
| C | 0 | 18545 | 2 |
| D | 0 | 23002 | 2 |
| Mode M9 | |||
|---|---|---|---|
| Quadrant | BADHDUFLAG | Total packets | Discarded packets |
| A | 0 | 22 | 0 |
| B | 0 | 23 | 0 |
| C | 0 | 23 | 0 |
| D | 0 | 23 | 0 |
| Mode SS | |||
|---|---|---|---|
| Quadrant | BADHDUFLAG | Total packets | Discarded packets |
| A | 0 | 134 | 0 |
| B | 0 | 134 | 0 |
| C | 0 | 134 | 0 |
| D | 0 | 134 | 0 |
| Quadrant | Total seconds | Saturated seconds | Saturation percentage |
|---|---|---|---|
| A | 6576 | 366 | 5.565693% |
| B | 6576 | 1090 | 16.575426% |
| C | 6575 | 342 | 5.201521% |
| D | 6575 | 569 | 8.653992% |
Noise dominated data is calculated using 1-second bins in cleaned event files. If a bin has >2000 counts, and if more than 50% of those come from <1% of pixels, then it is considered to be noise-dominated and hence unusable.
| Quadrant | # 1 sec bins | Bins with >0 counts | Bins with >2000 counts | High rate bins dominated by noise | Noise dominated (total time) | Noise dominated (detector-on time) | Marked lightcurve |
|---|---|---|---|---|---|---|---|
| A | 7821 | 6577 | 309 | 309 | 3.95% | 4.70% | 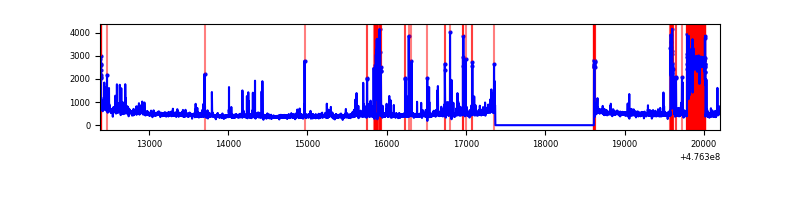 |
| B | 7821 | 6577 | 861 | 861 | 11.01% | 13.09% | 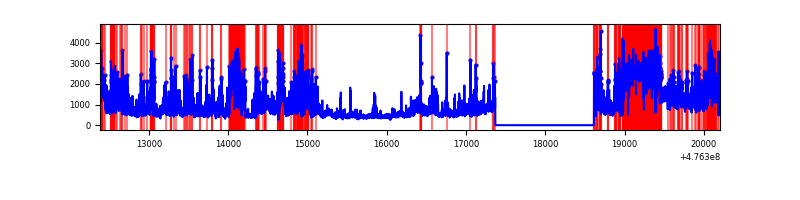 |
| C | 7820 | 6576 | 260 | 260 | 3.32% | 3.95% | 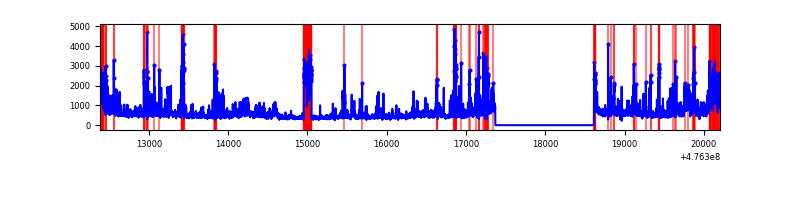 |
| D | 7820 | 6576 | 494 | 494 | 6.32% | 7.51% | 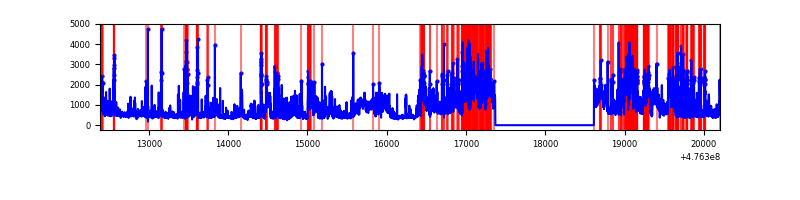 |
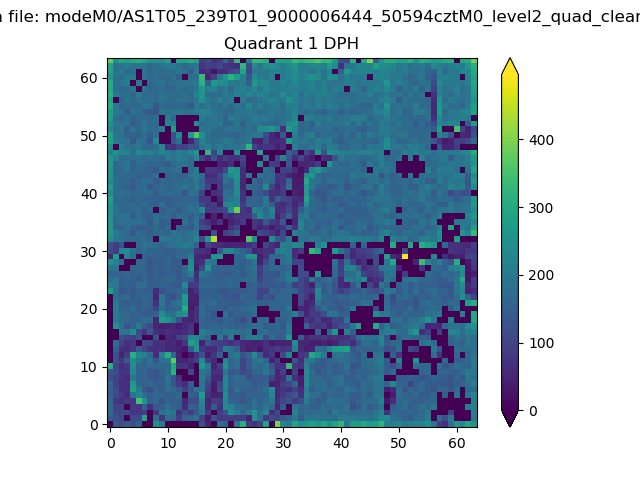
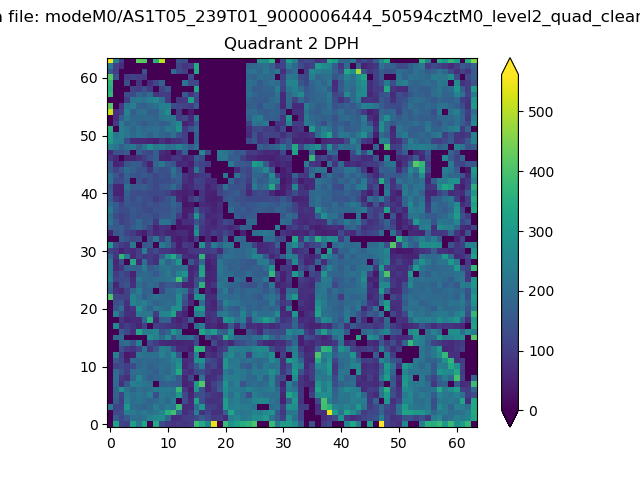
Top three noisy pixels from each quadrant. If the there are fewer than three noisy pixels in the level2.evt file, extra rows are filled as -1
| Pixel properties | Quadrant properties | ||||||
|---|---|---|---|---|---|---|---|
| Quadrant | DetID | PixID | Counts | Sigma | Mean | Median | Sigma |
| A | 10 | 251 | 612369 | 3621.22 | 678 | 664 | 168.9 |
| A | 5 | 240 | 185004 | 1091.27 | 678 | 664 | 168.9 |
| A | 4 | 3 | 111596 | 656.7 | 678 | 664 | 168.9 |
| B | 5 | 172 | 1814418 | 13244.47 | 650 | 631 | 136.9 |
| B | 4 | 170 | 1218123 | 8890.26 | 650 | 631 | 136.9 |
| B | 10 | 251 | 264732 | 1928.49 | 650 | 631 | 136.9 |
| C | 15 | 232 | 665277 | 3430.6 | 684 | 677 | 193.7 |
| C | 10 | 69 | 224790 | 1156.85 | 684 | 677 | 193.7 |
| C | 4 | 5 | 178829 | 919.6 | 684 | 677 | 193.7 |
| D | 8 | 246 | 2379868 | 12713.7 | 665 | 640 | 187.1 |
| D | 7 | 96 | 261432 | 1393.57 | 665 | 640 | 187.1 |
| D | 7 | 126 | 235169 | 1253.24 | 665 | 640 | 187.1 |
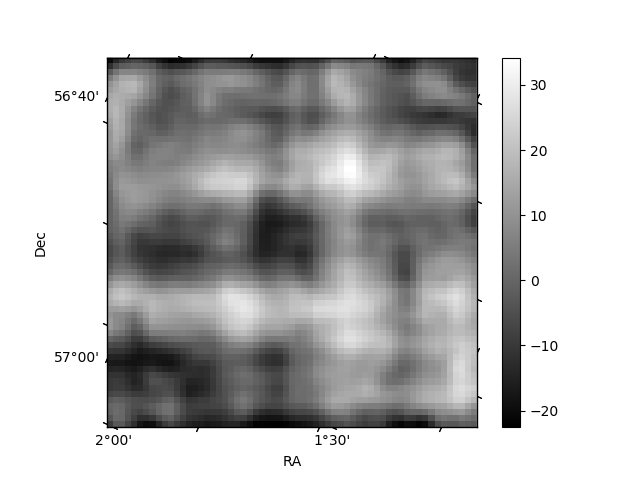
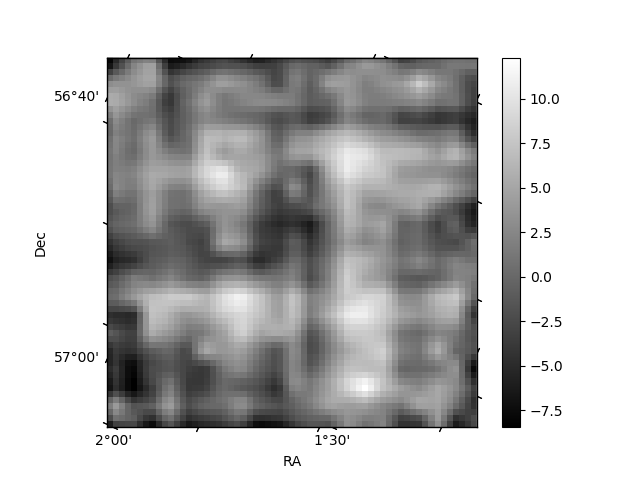
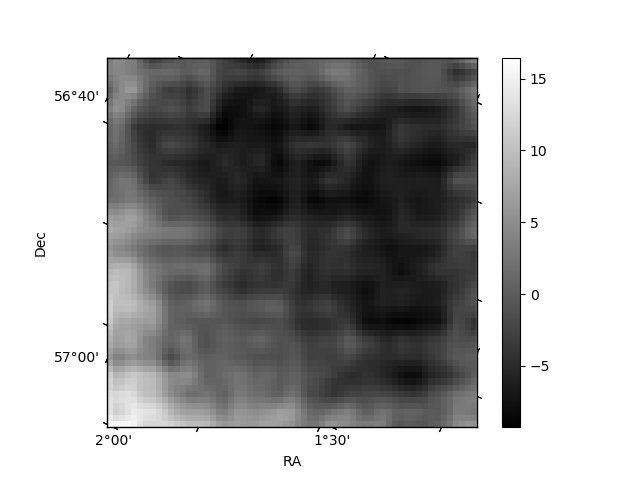
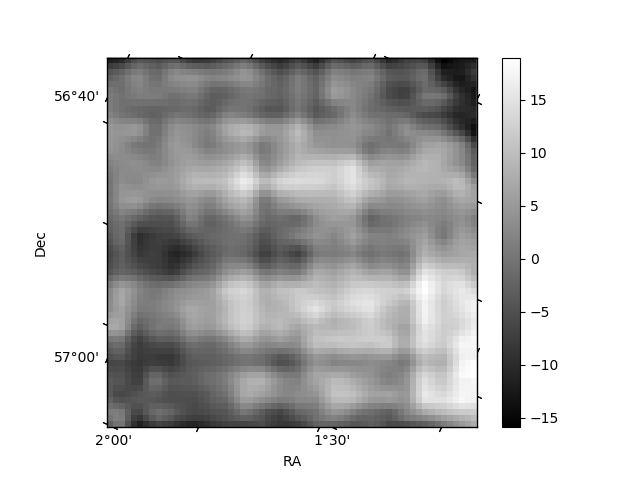
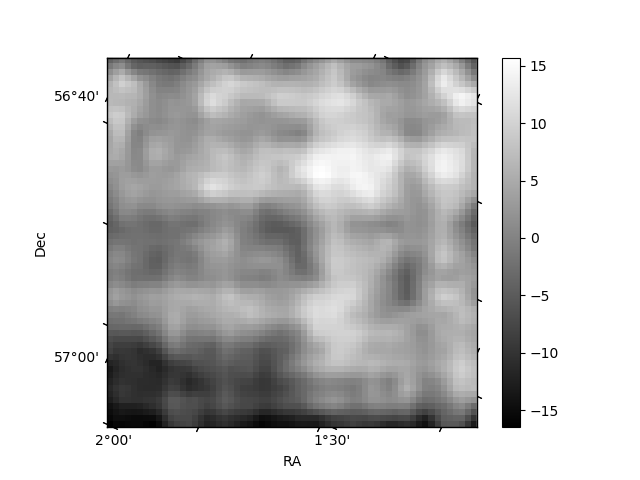
Histogram calculated using DETX and DETY for each event in the final _common_clean file
| Quadrant A | 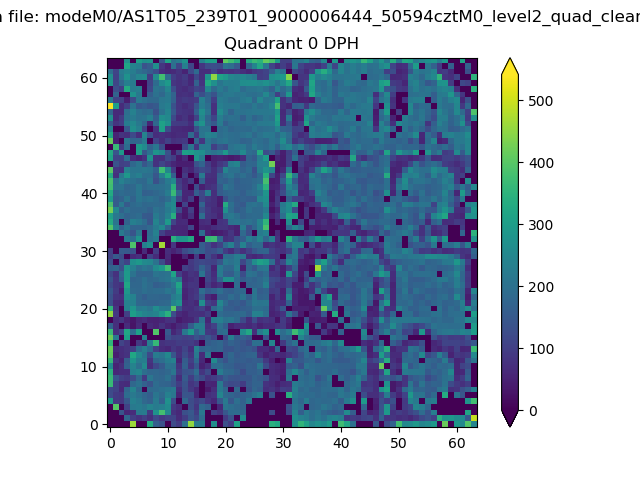 |
 |
Quadrant B |
|---|---|---|---|
| Quadrant D | 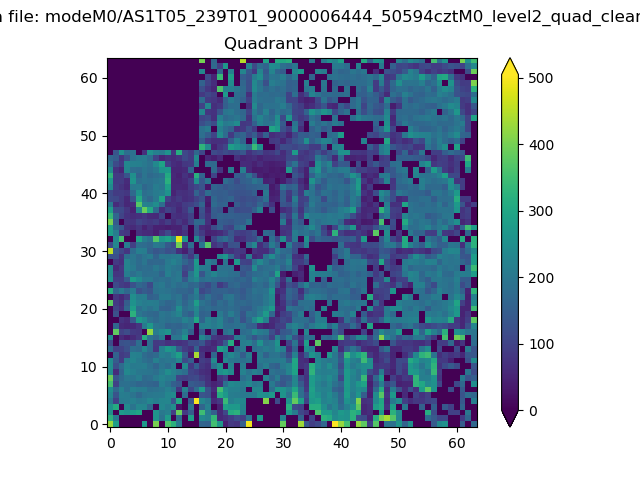 |
 |
Quadrant C |
| Plot type | Count rate plots | Images |
|---|---|---|
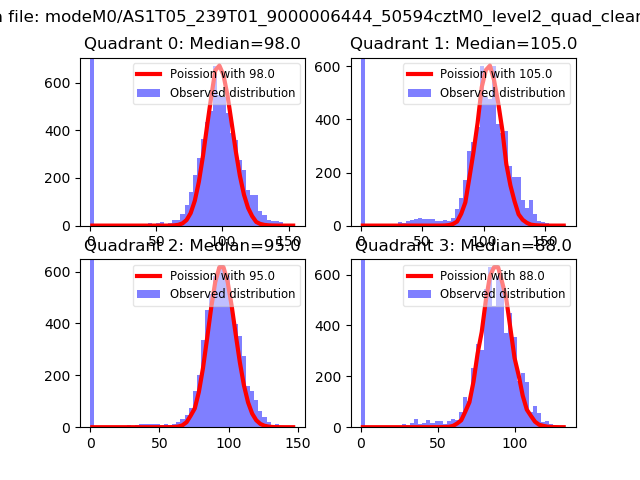
| Comparison with Poisson distribution Blue bars denote a histogram of data divided into 1 sec bins. Red curve is a Poisson curve with rate = median count rate of data. |
 |
 |
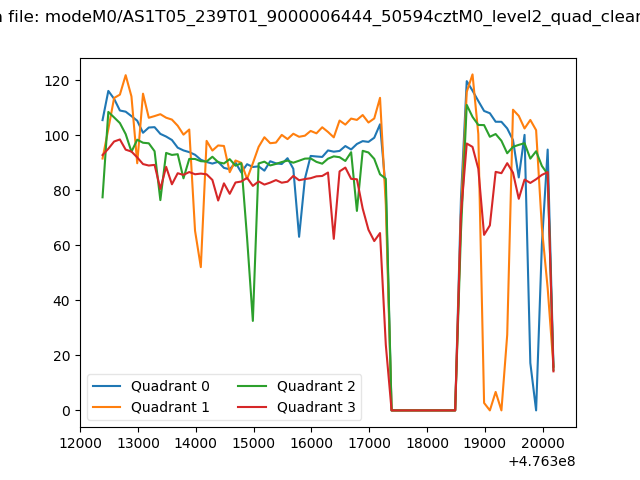
| Quadrant-wise count rates Data is divided into 100 sec bins |
 |
|
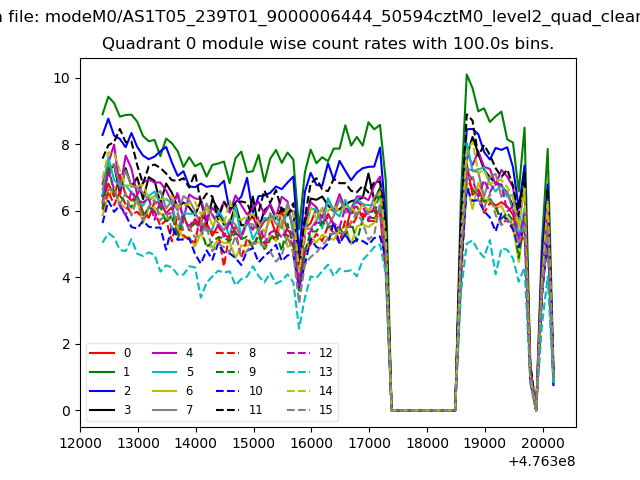
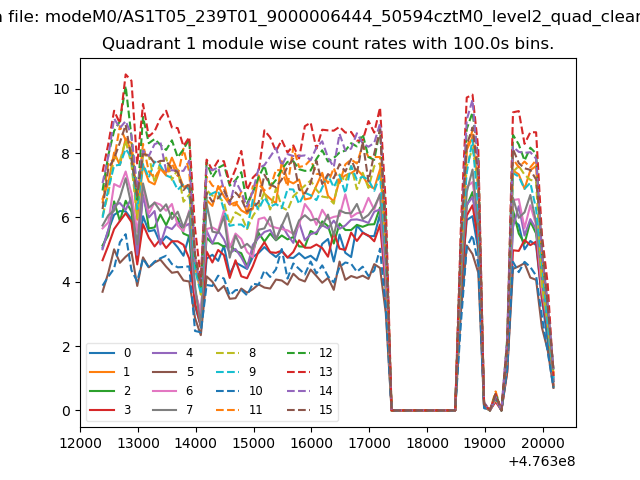
| Module-wise count rates for Quadrant A Data is divided into 100 sec bins |
 |
 |
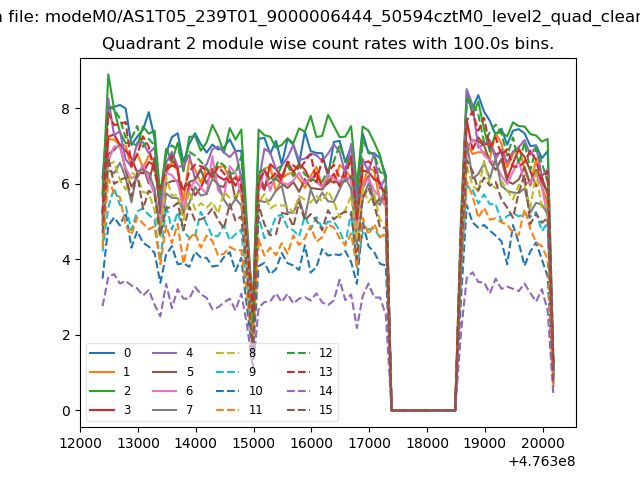
| Module-wise count rates for Quadrant B Data is divided into 100 sec bins |
 |
 |
| Module-wise count rates for Quadrant C Data is divided into 100 sec bins |
 |
 |
| Module-wise count rates for Quadrant D Data is divided into 100 sec bins |
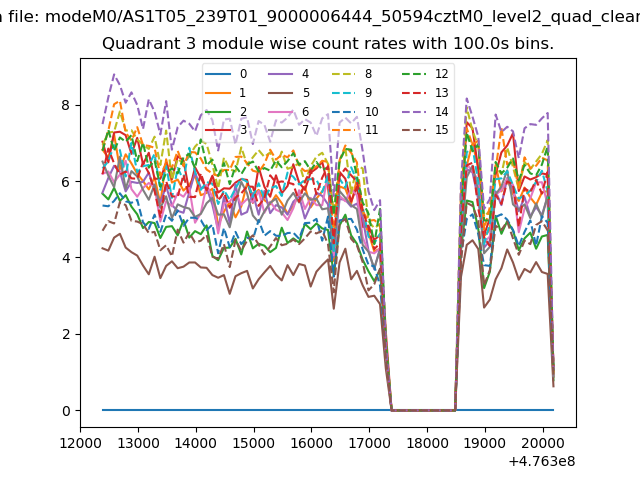 |
 |
| Parameter | Plot |
|---|---|
| CZT HV Monitor | 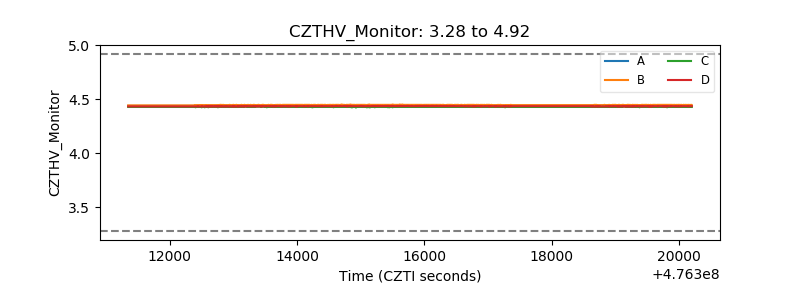 |
| D_VDD | 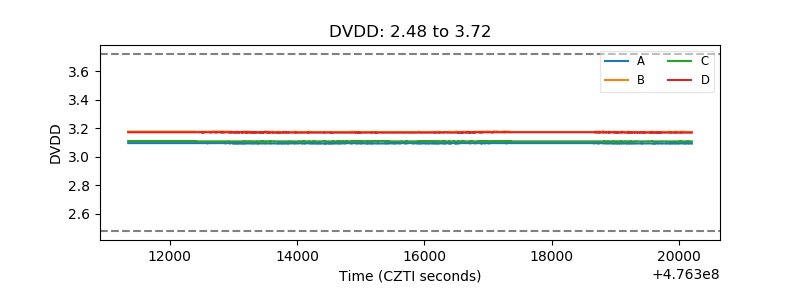 |
| Temperature 1 | 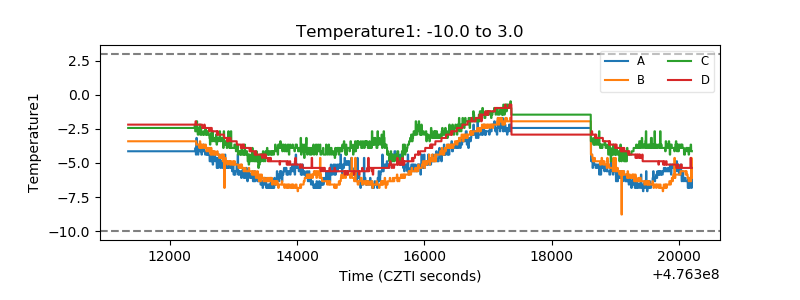 |
| Veto HV Monitor | 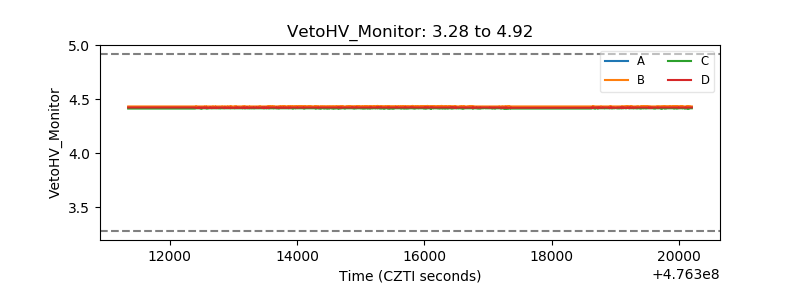 |
| Veto LLD | 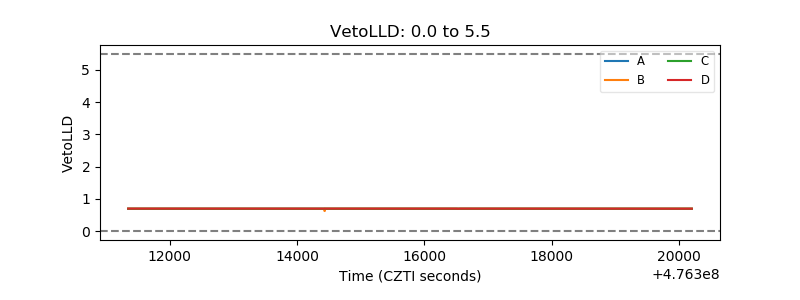 |
| Alpha Counter | 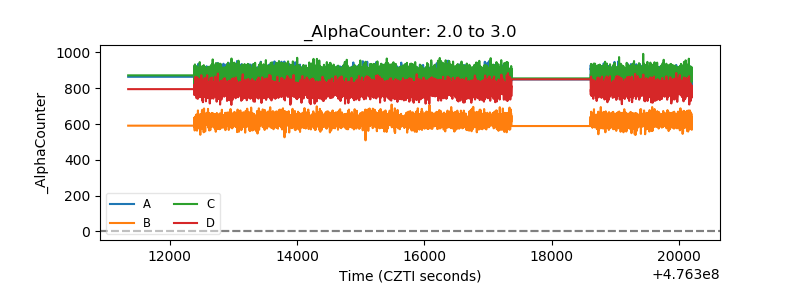 |
| _CPM_Rate | 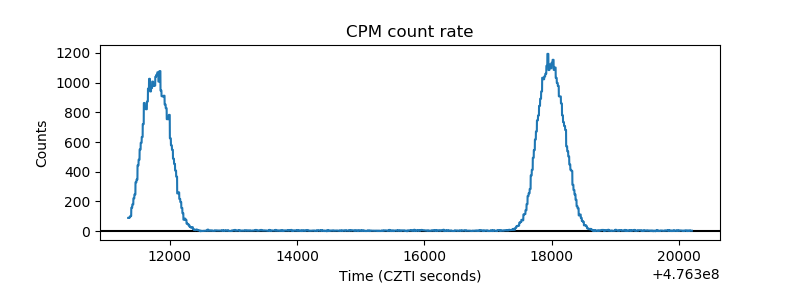 |
| CZT Counter | 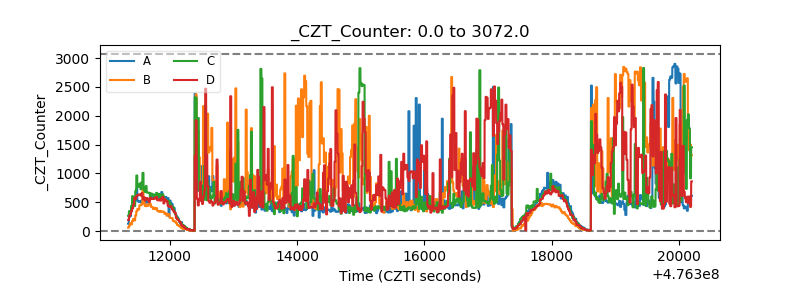 |
| +2.5 Volts monitor |  |
| +5 Volts monitor |  |
| _ROLL_ROT | 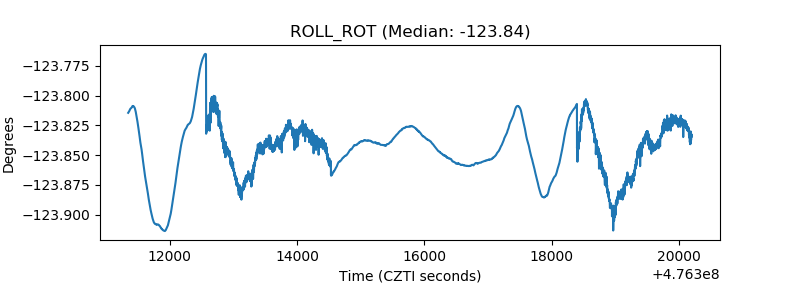 |
| _Roll_DEC | 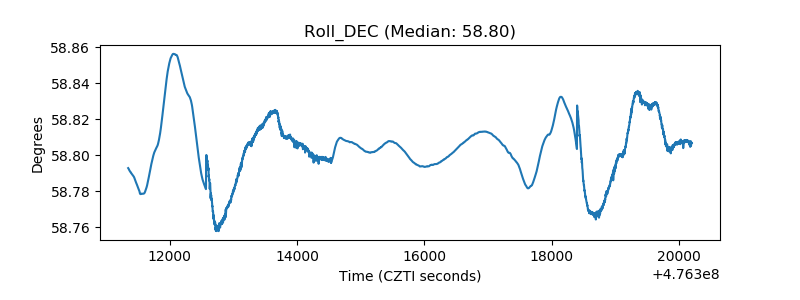 |
| _Roll_RA |  |
| Veto Counter | 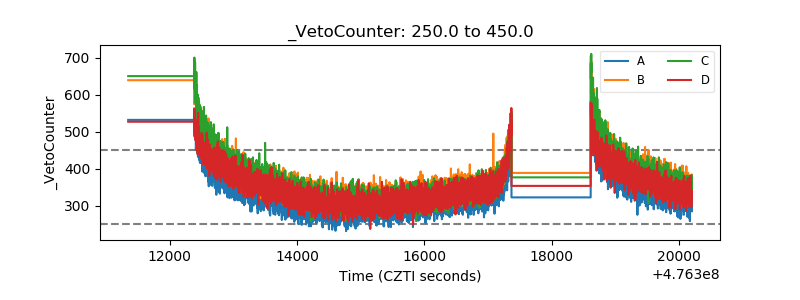 |