| Param | Original file | Final file |
|---|---|---|
| Filename | modeM0/AS1T05_239T01_9000006444_50595cztM0_level2.fits | modeM0/AS1T05_239T01_9000006444_50595cztM0_level2_quad_clean.evt |
| Size (bytes) | 726,050,880 | 87,750,720 |
| Size | 692.4 MB | 83.7 MB |
| Events in quadrant A | 4,278,852 | 610,611 |
| Events in quadrant B | 10,680,943 | 441,134 |
| Events in quadrant C | 4,668,821 | 616,851 |
| Events in quadrant D | 6,742,399 | 532,753 |
| Mode M0 | |||
|---|---|---|---|
| Quadrant | BADHDUFLAG | Total packets | Discarded packets |
| A | 0 | 17136 | 1 |
| B | 0 | 36269 | 1 |
| C | 0 | 18471 | 1 |
| D | 0 | 24663 | 1 |
| Mode M9 | |||
|---|---|---|---|
| Quadrant | BADHDUFLAG | Total packets | Discarded packets |
| A | 0 | 12 | 0 |
| B | 0 | 12 | 0 |
| C | 0 | 12 | 0 |
| D | 0 | 12 | 0 |
| Mode SS | |||
|---|---|---|---|
| Quadrant | BADHDUFLAG | Total packets | Discarded packets |
| A | 0 | 134 | 0 |
| B | 0 | 134 | 0 |
| C | 0 | 134 | 0 |
| D | 0 | 134 | 0 |
| Quadrant | Total seconds | Saturated seconds | Saturation percentage |
|---|---|---|---|
| A | 6525 | 408 | 6.252874% |
| B | 6526 | 2711 | 41.541526% |
| C | 6526 | 214 | 3.279191% |
| D | 6526 | 761 | 11.661048% |
Noise dominated data is calculated using 1-second bins in cleaned event files. If a bin has >2000 counts, and if more than 50% of those come from <1% of pixels, then it is considered to be noise-dominated and hence unusable.
| Quadrant | # 1 sec bins | Bins with >0 counts | Bins with >2000 counts | High rate bins dominated by noise | Noise dominated (total time) | Noise dominated (detector-on time) | Marked lightcurve |
|---|---|---|---|---|---|---|---|
| A | 7740 | 6526 | 331 | 331 | 4.28% | 5.07% | 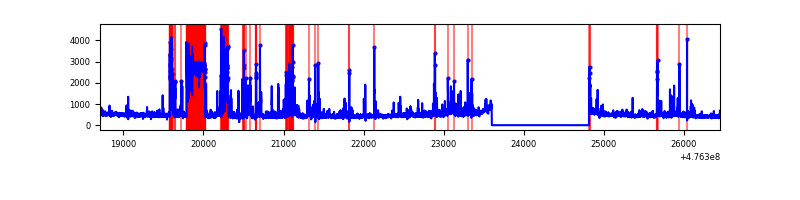 |
| B | 7741 | 6526 | 2181 | 2181 | 28.17% | 33.42% | 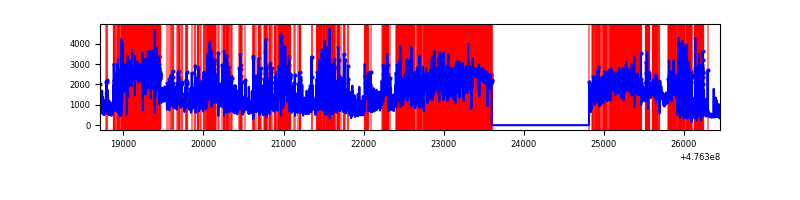 |
| C | 7741 | 6527 | 202 | 202 | 2.61% | 3.09% | 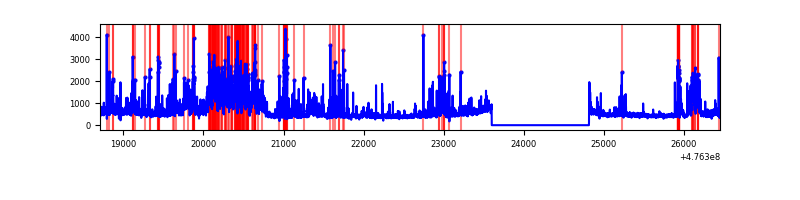 |
| D | 7741 | 6527 | 752 | 752 | 9.71% | 11.52% | 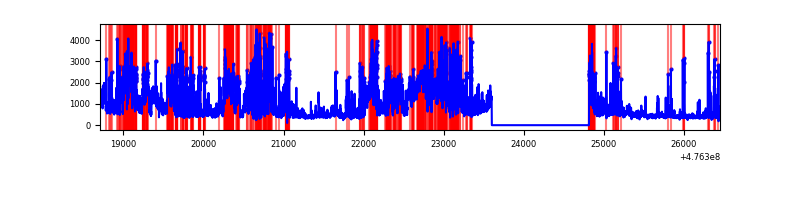 |
Top three noisy pixels from each quadrant. If the there are fewer than three noisy pixels in the level2.evt file, extra rows are filled as -1
| Pixel properties | Quadrant properties | ||||||
|---|---|---|---|---|---|---|---|
| Quadrant | DetID | PixID | Counts | Sigma | Mean | Median | Sigma |
| A | 10 | 251 | 868038 | 5181.56 | 676 | 661 | 167.4 |
| A | 8 | 38 | 116634 | 692.8 | 676 | 661 | 167.4 |
| A | 5 | 240 | 115866 | 688.22 | 676 | 661 | 167.4 |
| B | 5 | 172 | 4710692 | 39400.14 | 567 | 547 | 119.5 |
| B | 4 | 170 | 2052274 | 17162.6 | 567 | 547 | 119.5 |
| B | 5 | 32 | 799594 | 6683.99 | 567 | 547 | 119.5 |
| C | 15 | 232 | 997774 | 5211.96 | 682 | 676 | 191.3 |
| C | 15 | 147 | 219140 | 1141.94 | 682 | 676 | 191.3 |
| C | 14 | 247 | 198550 | 1034.31 | 682 | 676 | 191.3 |
| D | 8 | 246 | 2543749 | 14098.29 | 648 | 624 | 180.4 |
| D | 7 | 126 | 256234 | 1417.02 | 648 | 624 | 180.4 |
| D | 2 | 249 | 240741 | 1331.13 | 648 | 624 | 180.4 |
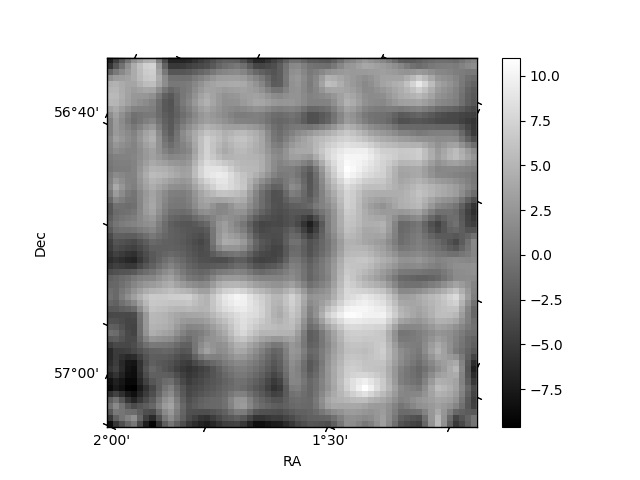
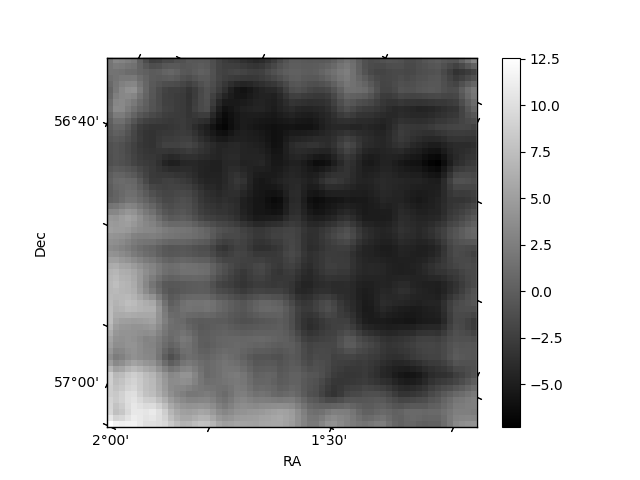
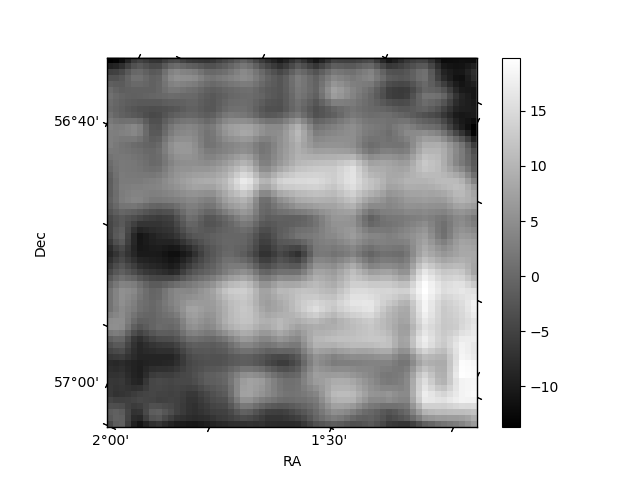
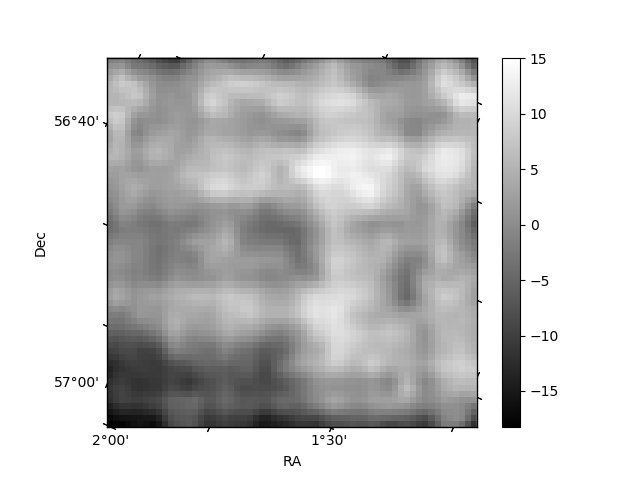
Histogram calculated using DETX and DETY for each event in the final _common_clean file
| Quadrant A | 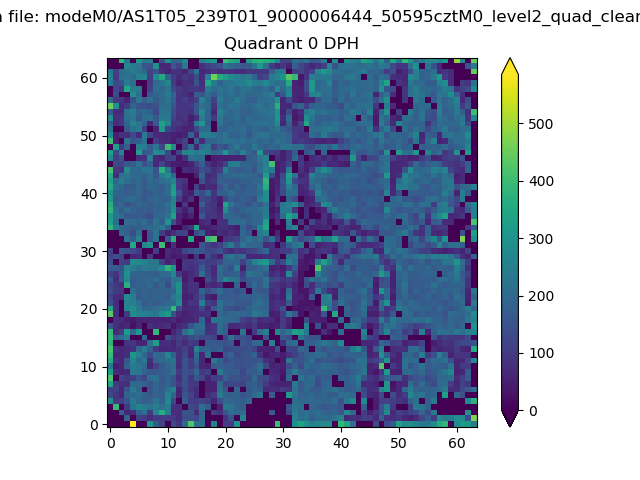 |
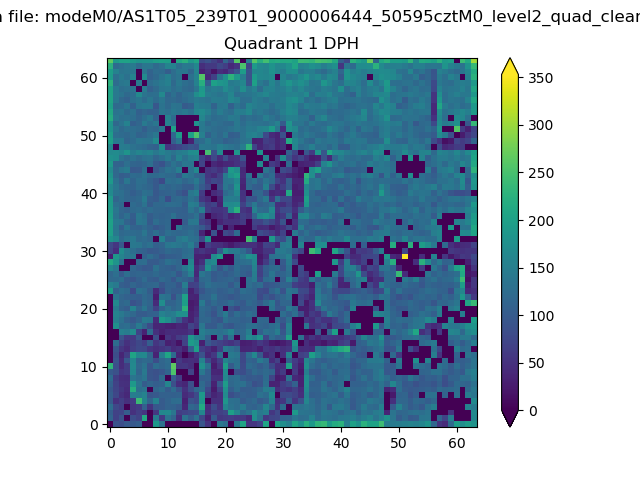 |
Quadrant B |
|---|---|---|---|
| Quadrant D | 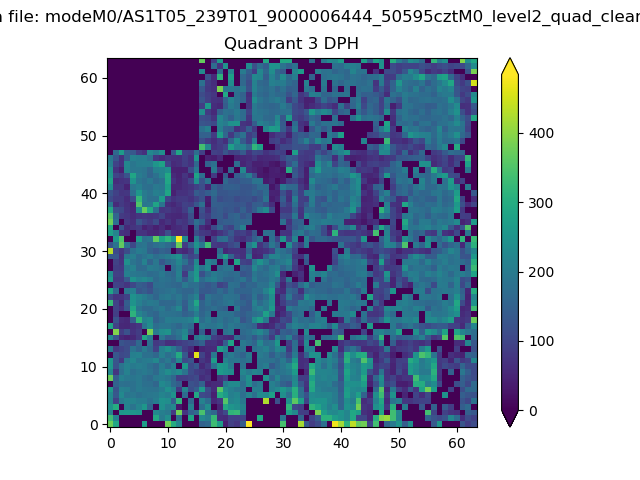 |
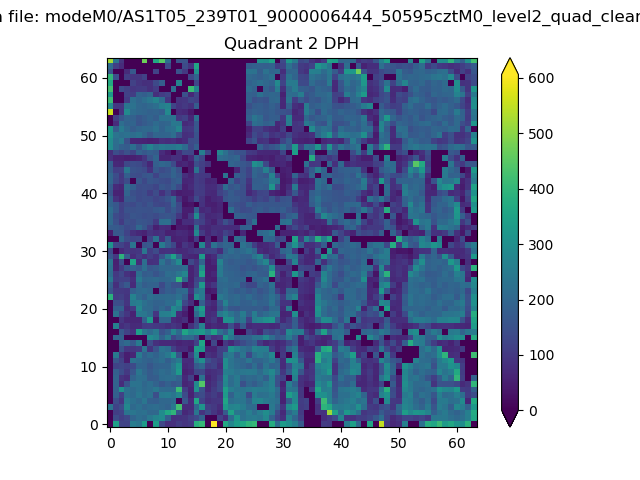 |
Quadrant C |
| Plot type | Count rate plots | Images |
|---|---|---|
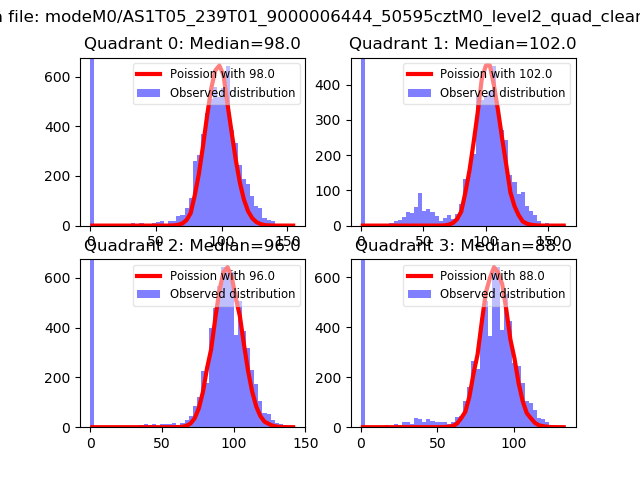
| Comparison with Poisson distribution Blue bars denote a histogram of data divided into 1 sec bins. Red curve is a Poisson curve with rate = median count rate of data. |
 |
 |
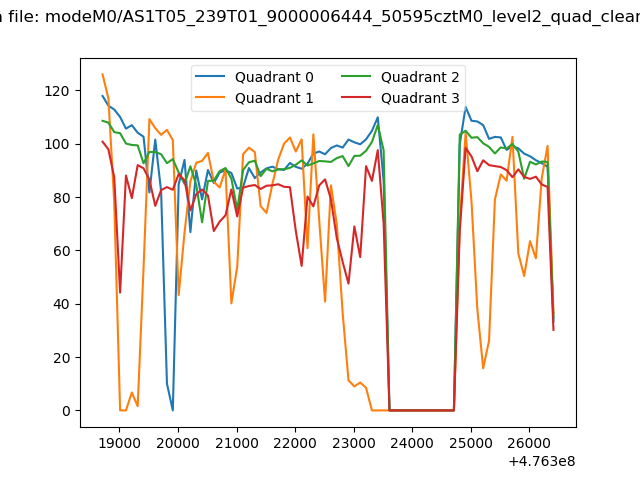
| Quadrant-wise count rates Data is divided into 100 sec bins |
 |
|
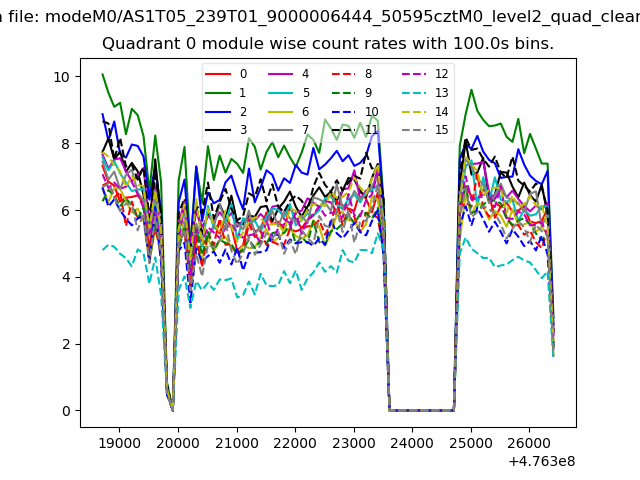
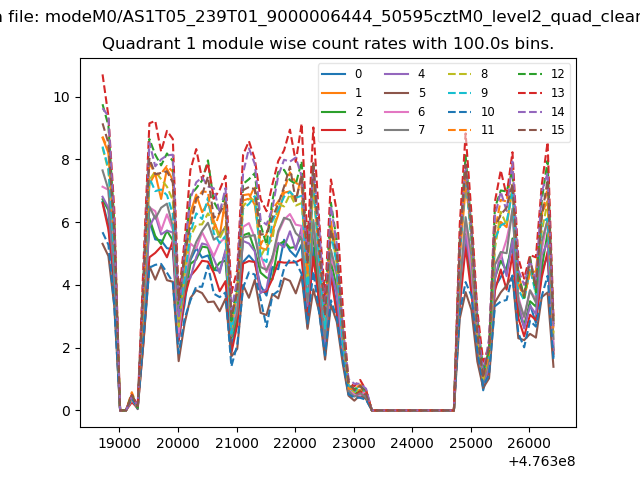
| Module-wise count rates for Quadrant A Data is divided into 100 sec bins |
 |
 |
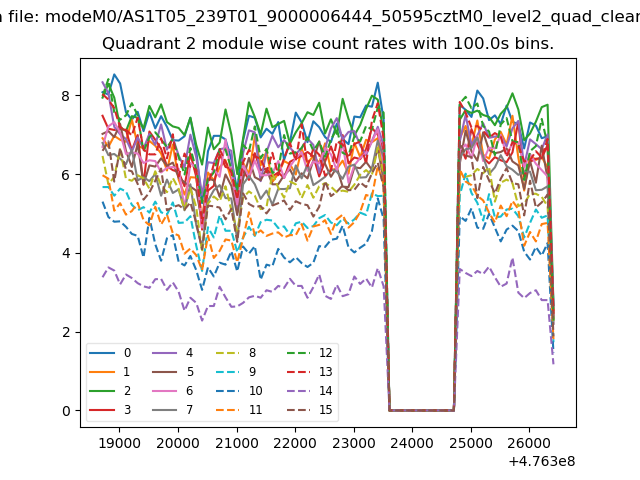
| Module-wise count rates for Quadrant B Data is divided into 100 sec bins |
 |
 |
| Module-wise count rates for Quadrant C Data is divided into 100 sec bins |
 |
 |
| Module-wise count rates for Quadrant D Data is divided into 100 sec bins |
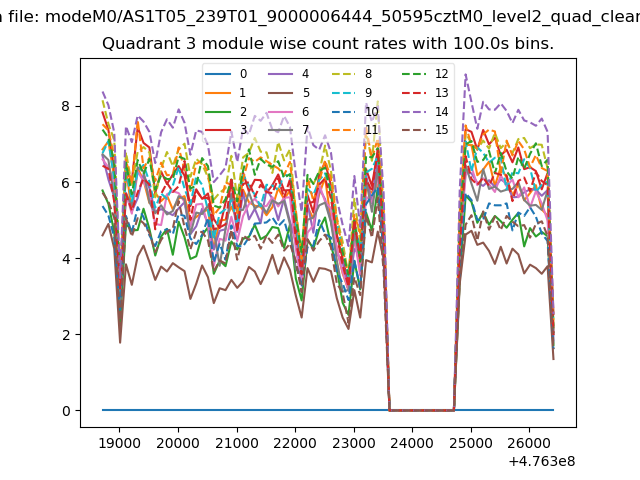 |
 |
| Parameter | Plot |
|---|---|
| CZT HV Monitor | 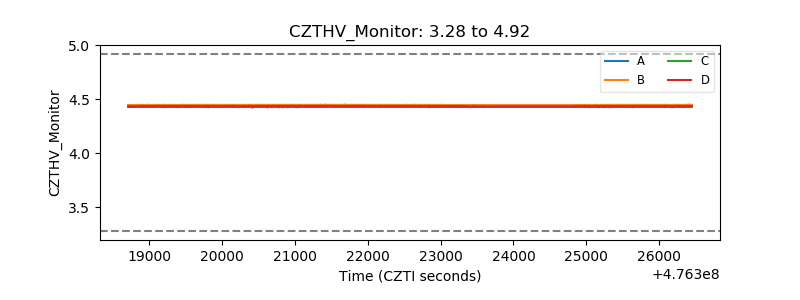 |
| D_VDD | 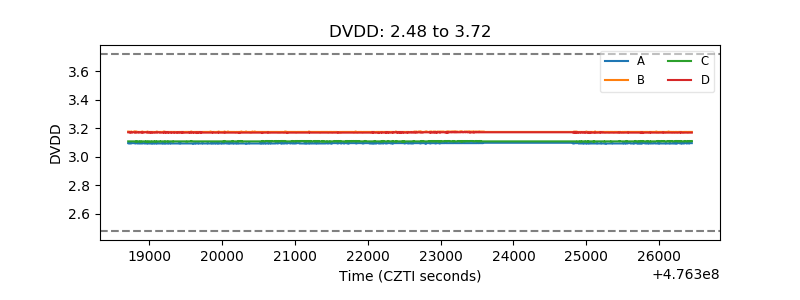 |
| Temperature 1 | 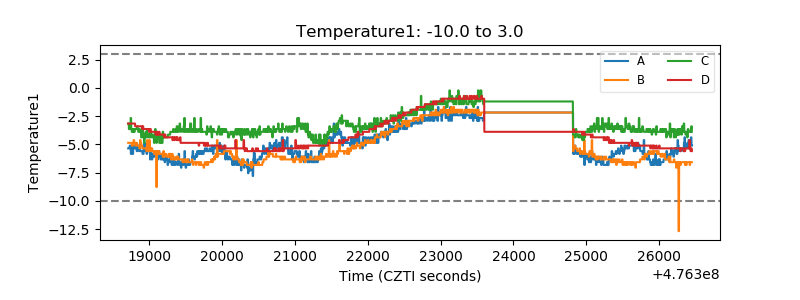 |
| Veto HV Monitor | 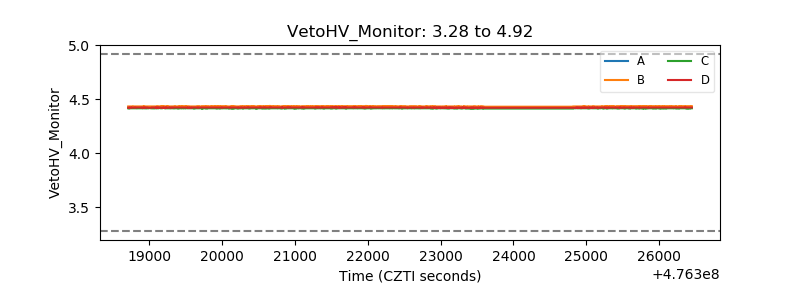 |
| Veto LLD | 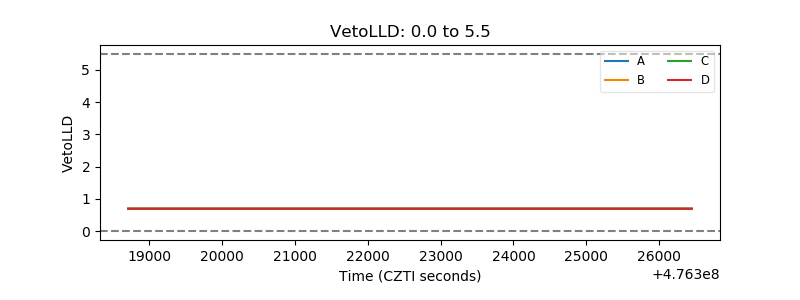 |
| Alpha Counter | 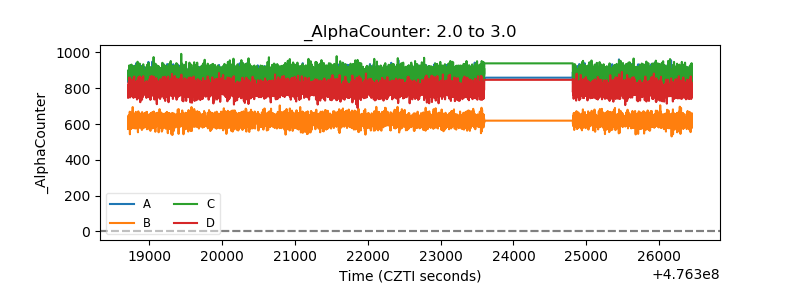 |
| _CPM_Rate | 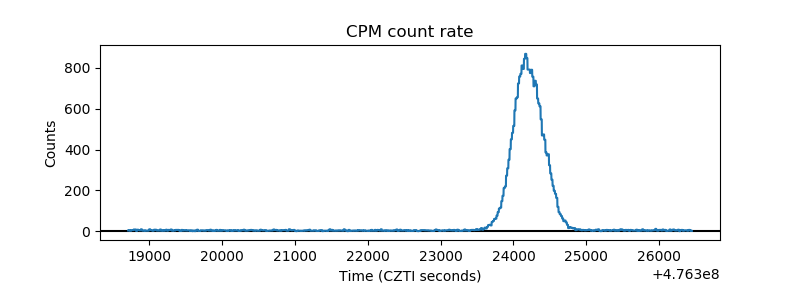 |
| CZT Counter | 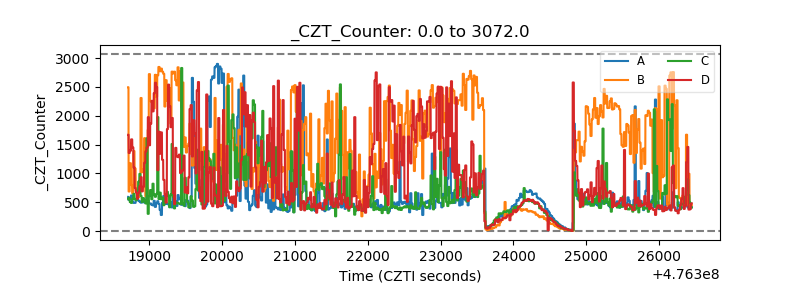 |
| +2.5 Volts monitor |  |
| +5 Volts monitor | 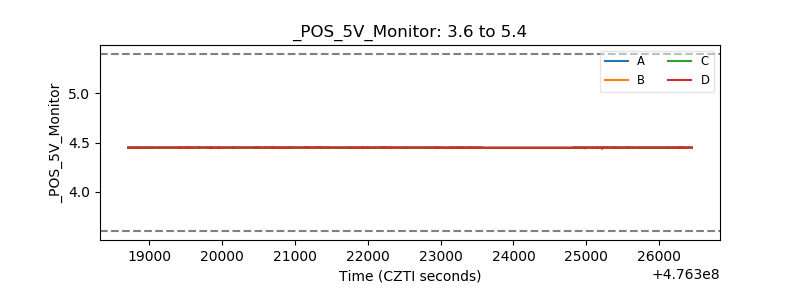 |
| _ROLL_ROT | 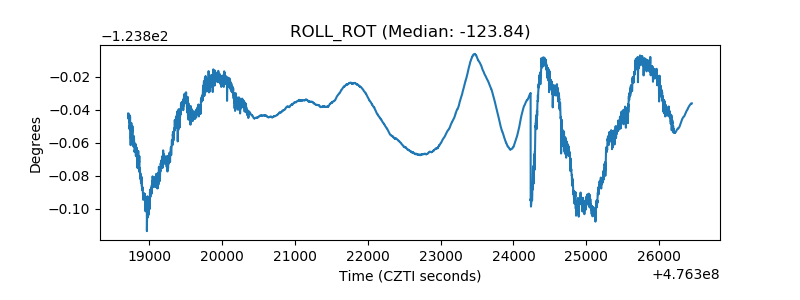 |
| _Roll_DEC | 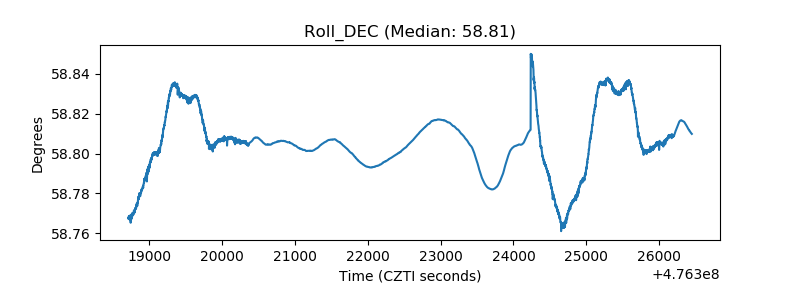 |
| _Roll_RA | 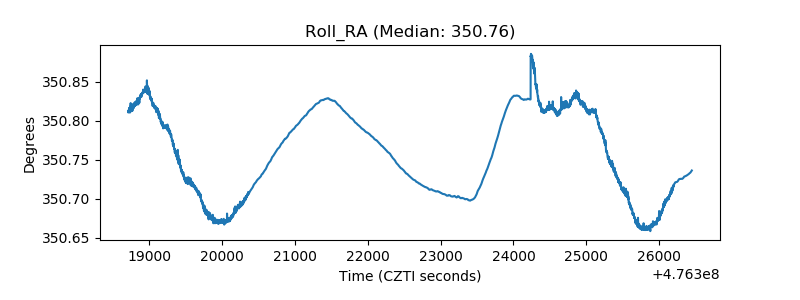 |
| Veto Counter | 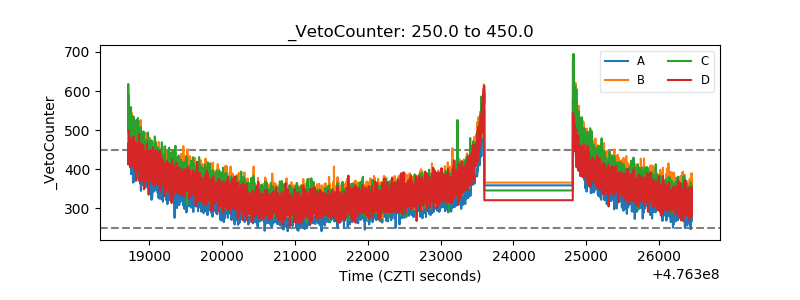 |