| Param | Original file | Final file |
|---|---|---|
| Filename | modeM0/AS1T05_239T01_9000006444_50596cztM0_level2.fits | modeM0/AS1T05_239T01_9000006444_50596cztM0_level2_quad_clean.evt |
| Size (bytes) | 462,191,040 | 79,447,680 |
| Size | 440.8 MB | 75.8 MB |
| Events in quadrant A | 3,000,194 | 533,425 |
| Events in quadrant B | 6,560,596 | 499,556 |
| Events in quadrant C | 3,650,870 | 507,685 |
| Events in quadrant D | 3,460,541 | 471,875 |
| Mode M0 | |||
|---|---|---|---|
| Quadrant | BADHDUFLAG | Total packets | Discarded packets |
| A | 0 | 12971 | 126 |
| B | 0 | 23651 | 243 |
| C | 0 | 15152 | 217 |
| D | 0 | 14558 | 146 |
| Mode M9 | |||
|---|---|---|---|
| Quadrant | BADHDUFLAG | Total packets | Discarded packets |
| A | 0 | 11 | 0 |
| B | 0 | 11 | 0 |
| C | 0 | 11 | 0 |
| D | 0 | 11 | 0 |
| Mode SS | |||
|---|---|---|---|
| Quadrant | BADHDUFLAG | Total packets | Discarded packets |
| A | 0 | 116 | 2 |
| B | 0 | 116 | 0 |
| C | 0 | 116 | 4 |
| D | 0 | 116 | 2 |
| Quadrant | Total seconds | Saturated seconds | Saturation percentage |
|---|---|---|---|
| A | 5627 | 93 | 1.652746% |
| B | 5612 | 1058 | 18.852459% |
| C | 5618 | 269 | 4.788181% |
| D | 5621 | 269 | 4.785625% |
Noise dominated data is calculated using 1-second bins in cleaned event files. If a bin has >2000 counts, and if more than 50% of those come from <1% of pixels, then it is considered to be noise-dominated and hence unusable.
| Quadrant | # 1 sec bins | Bins with >0 counts | Bins with >2000 counts | High rate bins dominated by noise | Noise dominated (total time) | Noise dominated (detector-on time) | Marked lightcurve |
|---|---|---|---|---|---|---|---|
| A | 7384 | 5642 | 52 | 52 | 0.70% | 0.92% | 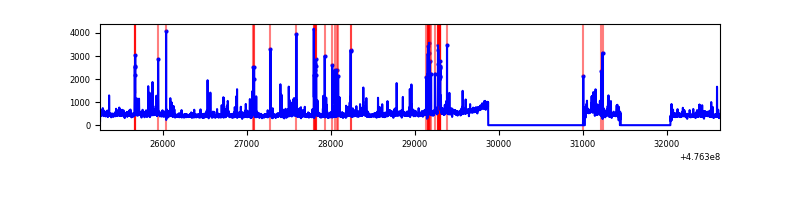 |
| B | 7384 | 5628 | 744 | 744 | 10.08% | 13.22% | 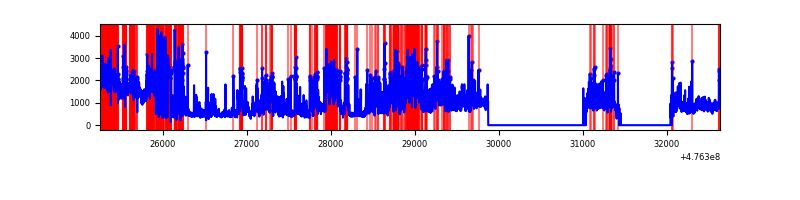 |
| C | 7384 | 5634 | 212 | 212 | 2.87% | 3.76% | 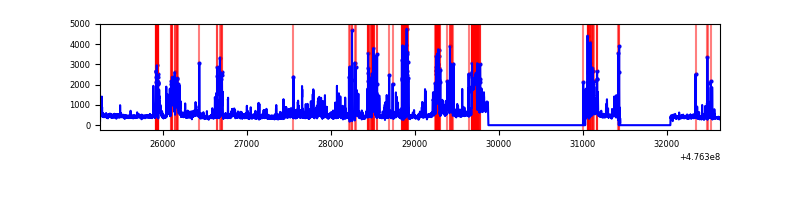 |
| D | 7385 | 5636 | 180 | 180 | 2.44% | 3.19% | 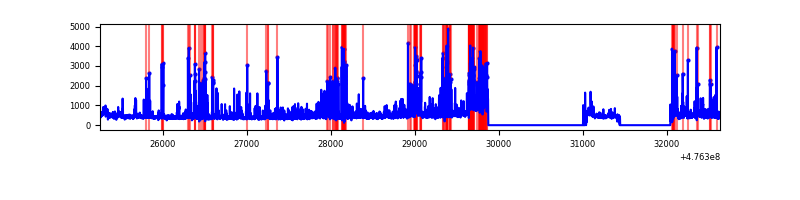 |
Top three noisy pixels from each quadrant. If the there are fewer than three noisy pixels in the level2.evt file, extra rows are filled as -1
| Pixel properties | Quadrant properties | ||||||
|---|---|---|---|---|---|---|---|
| Quadrant | DetID | PixID | Counts | Sigma | Mean | Median | Sigma |
| A | 5 | 240 | 145355 | 983.04 | 591 | 578 | 147.3 |
| A | 4 | 3 | 141653 | 957.9 | 591 | 578 | 147.3 |
| A | 4 | 78 | 64190 | 431.93 | 591 | 578 | 147.3 |
| B | 4 | 170 | 2172343 | 18351.63 | 553 | 533 | 118.3 |
| B | 5 | 172 | 1241467 | 10485.8 | 553 | 533 | 118.3 |
| B | 0 | 229 | 272774 | 2300.42 | 553 | 533 | 118.3 |
| C | 15 | 147 | 477467 | 3079.28 | 559 | 553 | 154.9 |
| C | 13 | 3 | 187279 | 1205.63 | 559 | 553 | 154.9 |
| C | 4 | 5 | 158562 | 1020.21 | 559 | 553 | 154.9 |
| D | 7 | 126 | 328886 | 2117.96 | 555 | 533 | 155.0 |
| D | 7 | 191 | 173199 | 1113.74 | 555 | 533 | 155.0 |
| D | 2 | 249 | 169151 | 1087.63 | 555 | 533 | 155.0 |
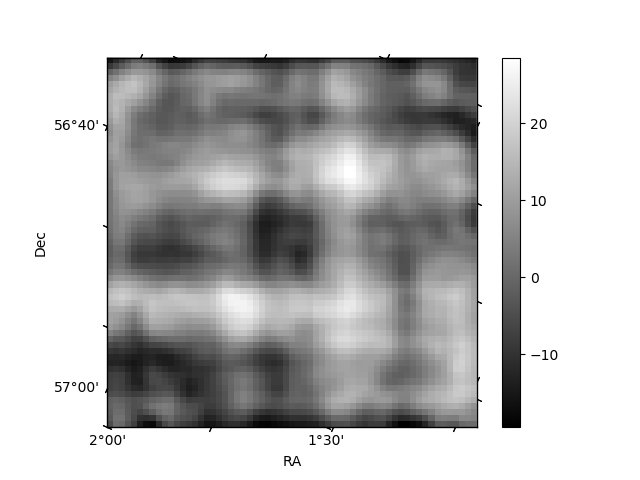
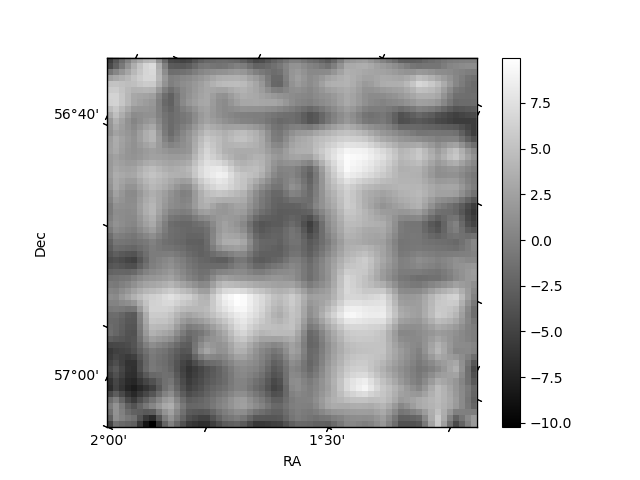
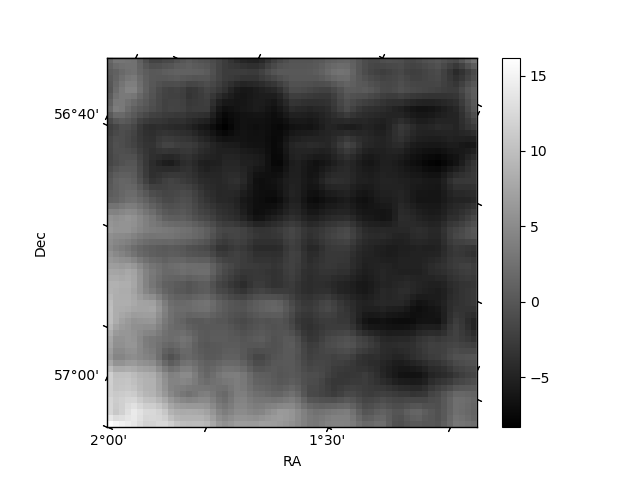
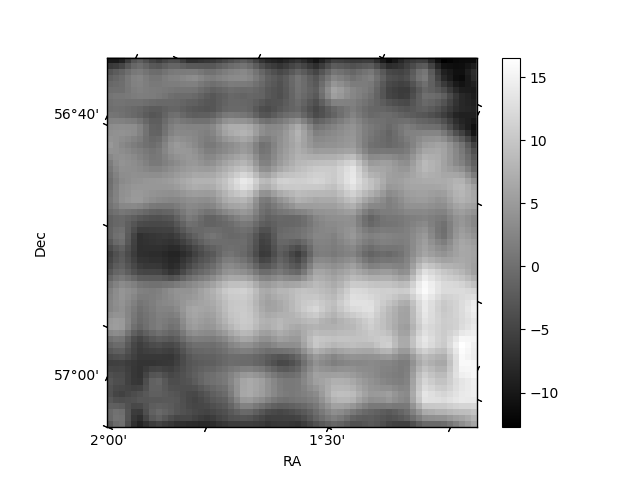
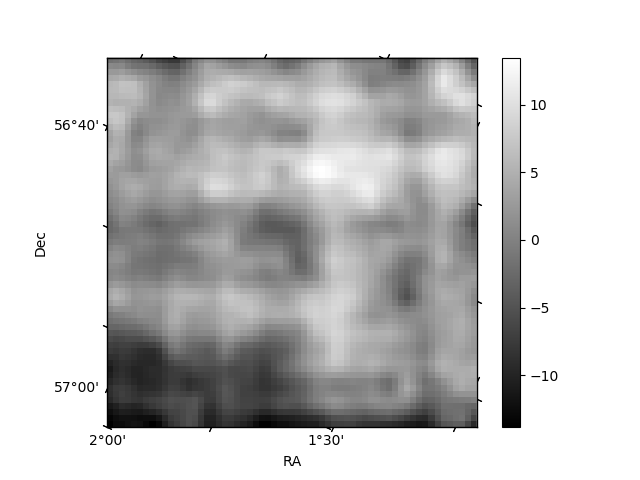
Histogram calculated using DETX and DETY for each event in the final _common_clean file
| Quadrant A | 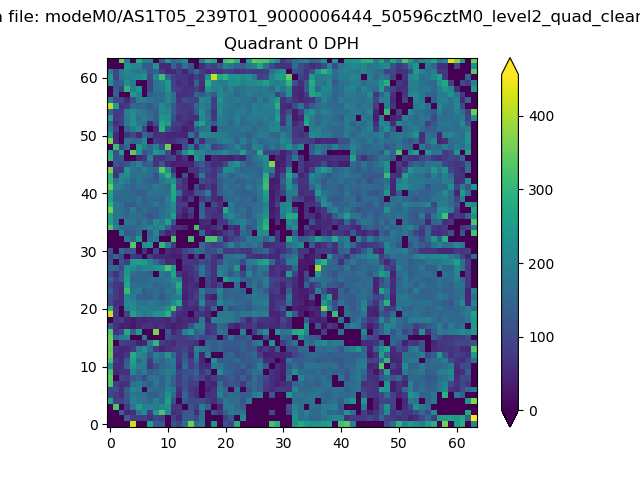 |
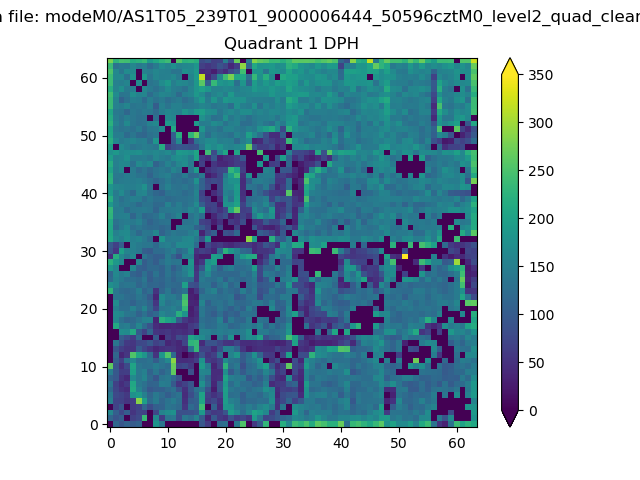 |
Quadrant B |
|---|---|---|---|
| Quadrant D | 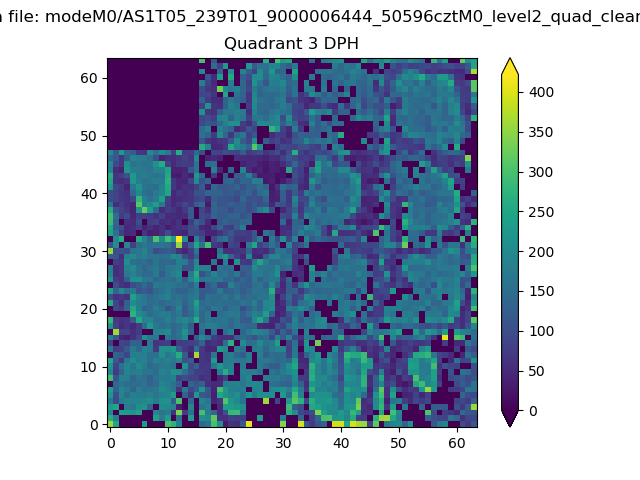 |
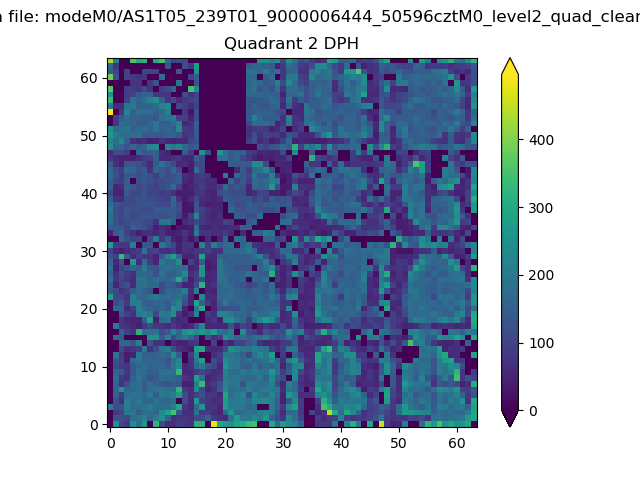 |
Quadrant C |
| Plot type | Count rate plots | Images |
|---|---|---|
| Comparison with Poisson distribution Blue bars denote a histogram of data divided into 1 sec bins. Red curve is a Poisson curve with rate = median count rate of data. |
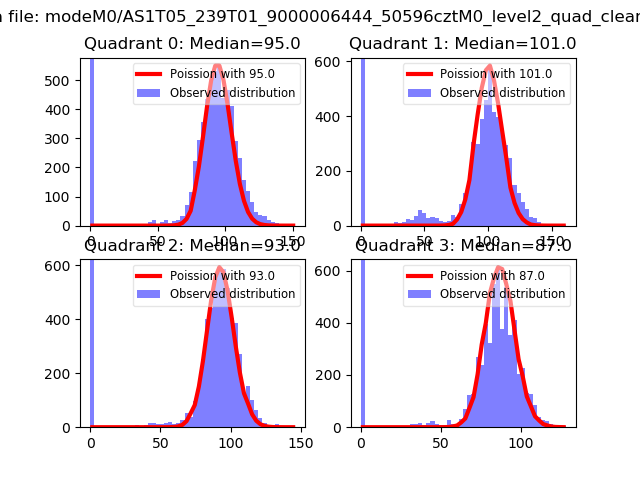 |
 |
| Quadrant-wise count rates Data is divided into 100 sec bins |
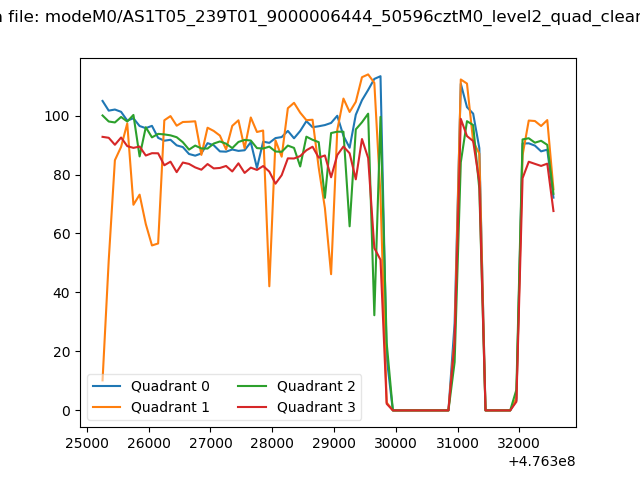 |
|
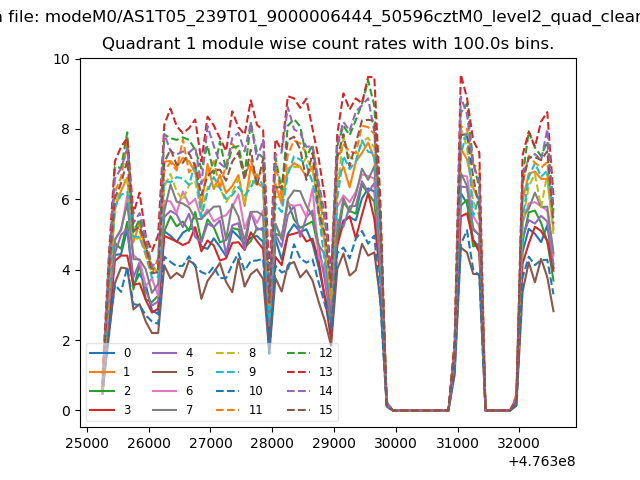
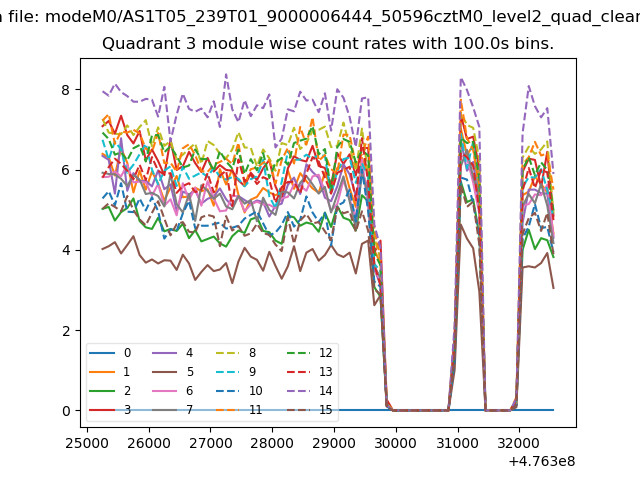
| Module-wise count rates for Quadrant A Data is divided into 100 sec bins |
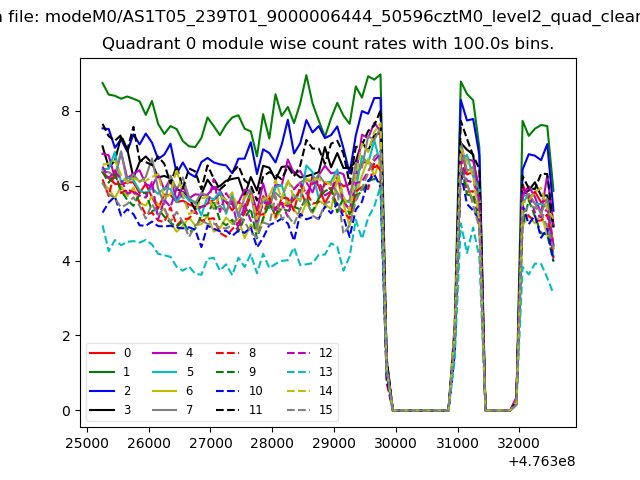 |
 |
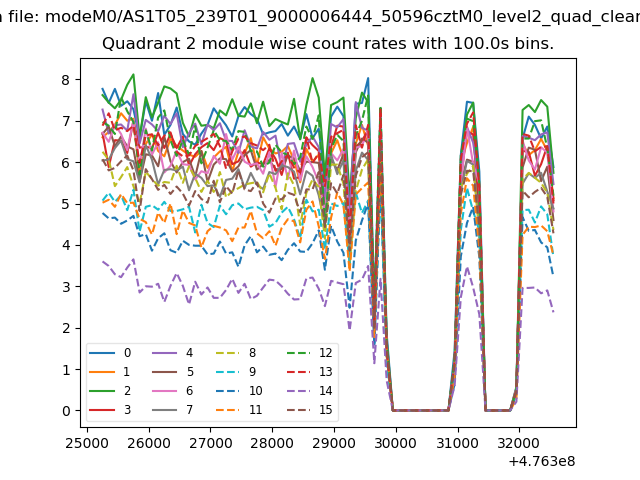
| Module-wise count rates for Quadrant B Data is divided into 100 sec bins |
 |
 |
| Module-wise count rates for Quadrant C Data is divided into 100 sec bins |
 |
 |
| Module-wise count rates for Quadrant D Data is divided into 100 sec bins |
 |
 |
| Parameter | Plot |
|---|---|
| CZT HV Monitor | 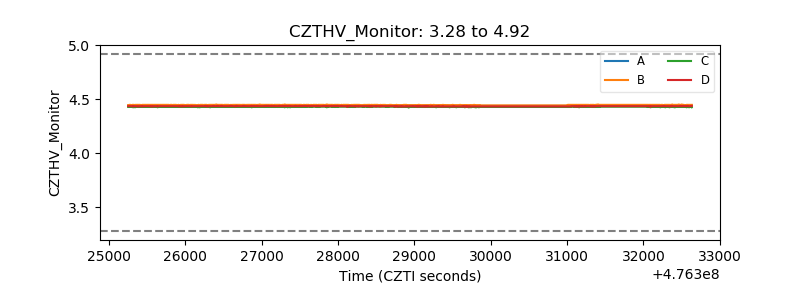 |
| D_VDD | 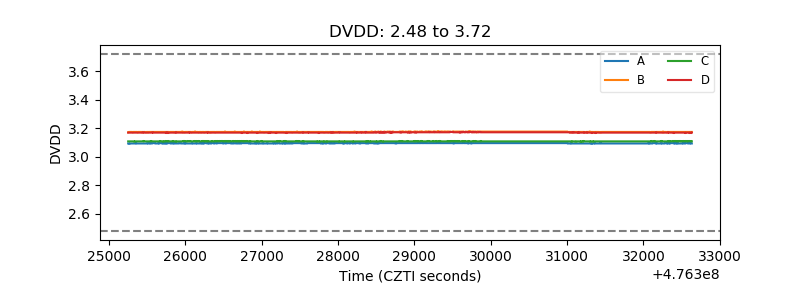 |
| Temperature 1 | 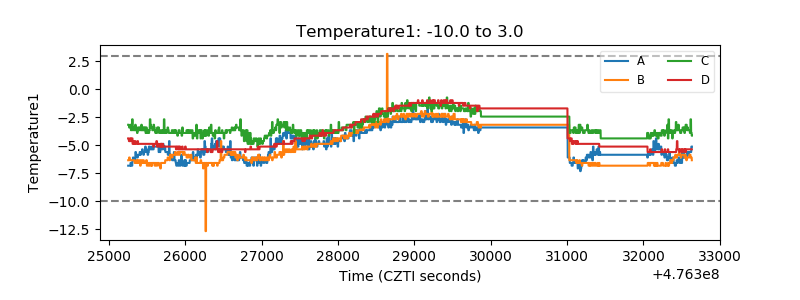 |
| Veto HV Monitor | 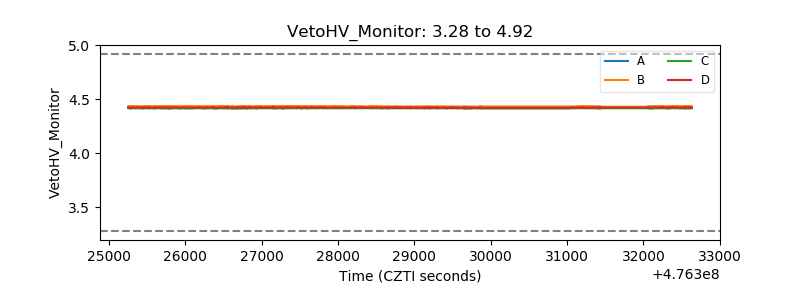 |
| Veto LLD |  |
| Alpha Counter | 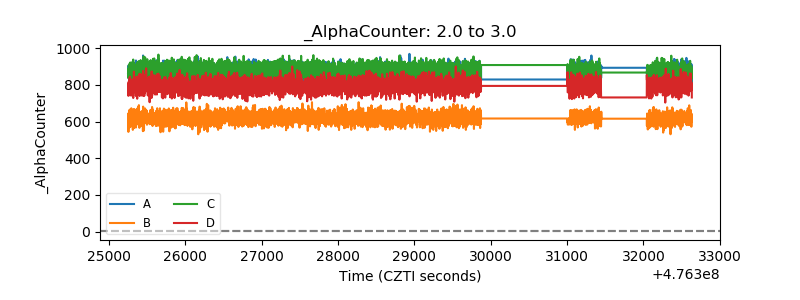 |
| _CPM_Rate | 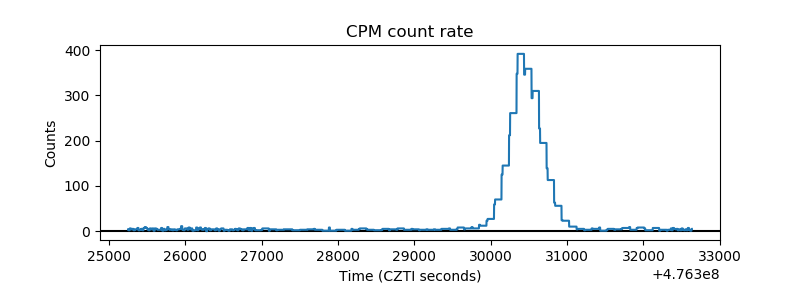 |
| CZT Counter | 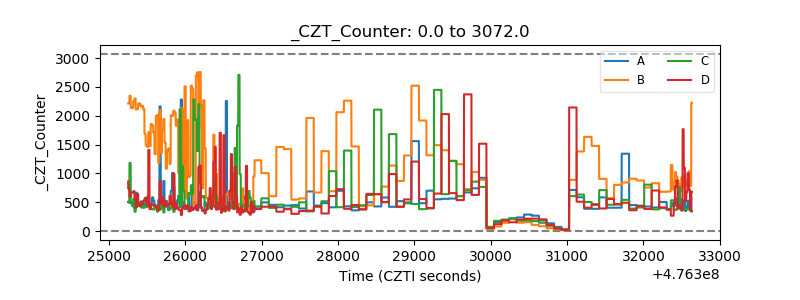 |
| +2.5 Volts monitor | 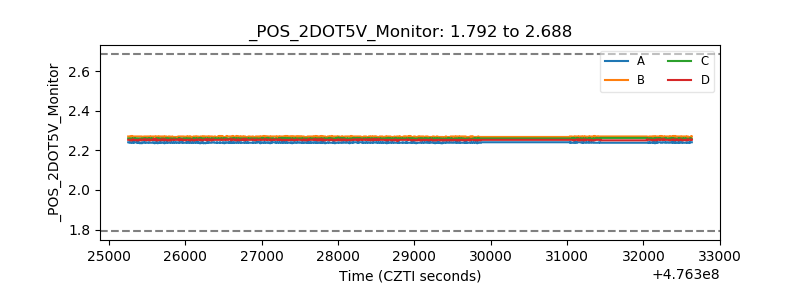 |
| +5 Volts monitor |  |
| _ROLL_ROT | 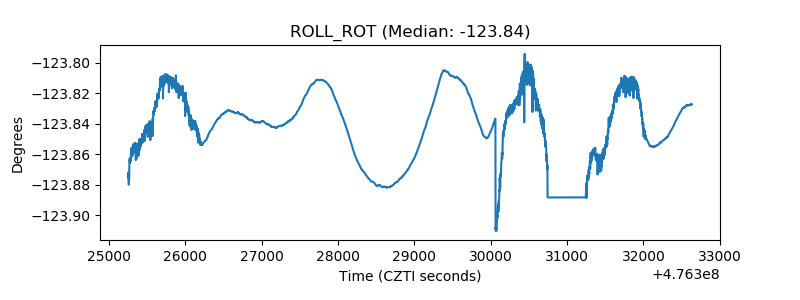 |
| _Roll_DEC | 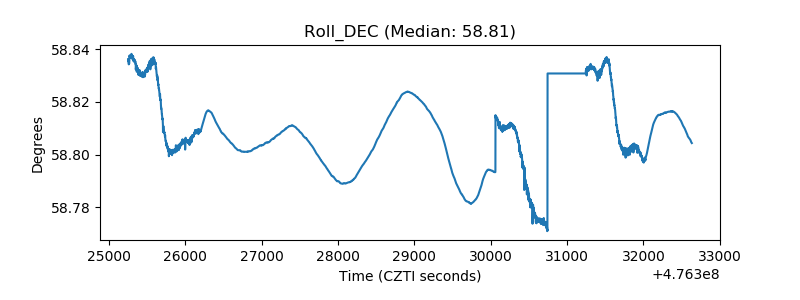 |
| _Roll_RA | 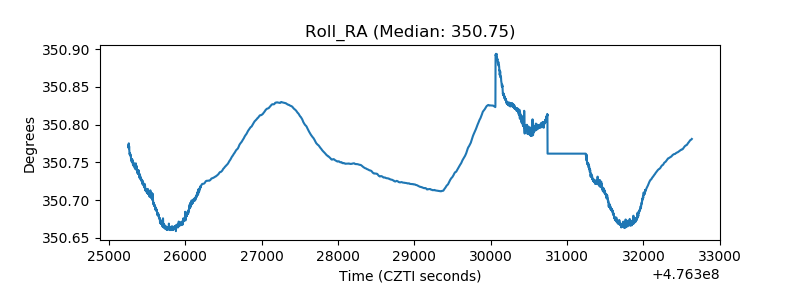 |
| Veto Counter | 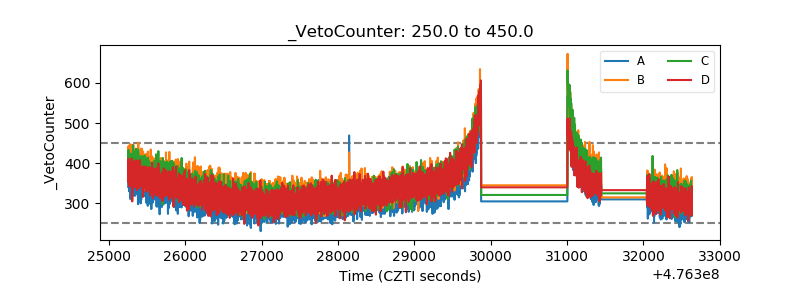 |