| Param | Original file | Final file |
|---|---|---|
| Filename | modeM0/AS1T05_239T01_9000006444_50597cztM0_level2.fits | modeM0/AS1T05_239T01_9000006444_50597cztM0_level2_quad_clean.evt |
| Size (bytes) | 487,059,840 | 93,677,760 |
| Size | 464.5 MB | 89.3 MB |
| Events in quadrant A | 3,657,969 | 599,465 |
| Events in quadrant B | 5,762,657 | 633,991 |
| Events in quadrant C | 3,830,294 | 592,393 |
| Events in quadrant D | 4,265,684 | 549,847 |
| Mode M0 | |||
|---|---|---|---|
| Quadrant | BADHDUFLAG | Total packets | Discarded packets |
| A | 0 | 15548 | 1 |
| B | 0 | 21737 | 5 |
| C | 0 | 16438 | 1 |
| D | 0 | 17567 | 1 |
| Mode M9 | |||
|---|---|---|---|
| Quadrant | BADHDUFLAG | Total packets | Discarded packets |
| A | 0 | 9 | 0 |
| B | 0 | 9 | 0 |
| C | 0 | 9 | 0 |
| D | 0 | 9 | 0 |
| Mode SS | |||
|---|---|---|---|
| Quadrant | BADHDUFLAG | Total packets | Discarded packets |
| A | 0 | 136 | 0 |
| B | 0 | 136 | 0 |
| C | 0 | 136 | 0 |
| D | 0 | 136 | 0 |
| Quadrant | Total seconds | Saturated seconds | Saturation percentage |
|---|---|---|---|
| A | 6601 | 216 | 3.272231% |
| B | 6600 | 527 | 7.984848% |
| C | 6602 | 248 | 3.756437% |
| D | 6602 | 264 | 3.998788% |
Noise dominated data is calculated using 1-second bins in cleaned event files. If a bin has >2000 counts, and if more than 50% of those come from <1% of pixels, then it is considered to be noise-dominated and hence unusable.
| Quadrant | # 1 sec bins | Bins with >0 counts | Bins with >2000 counts | High rate bins dominated by noise | Noise dominated (total time) | Noise dominated (detector-on time) | Marked lightcurve |
|---|---|---|---|---|---|---|---|
| A | 7521 | 6602 | 117 | 117 | 1.56% | 1.77% | 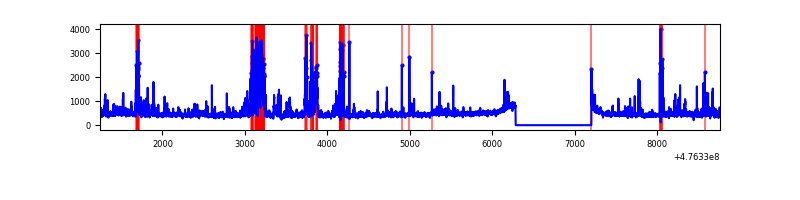 |
| B | 7521 | 6602 | 289 | 289 | 3.84% | 4.38% | 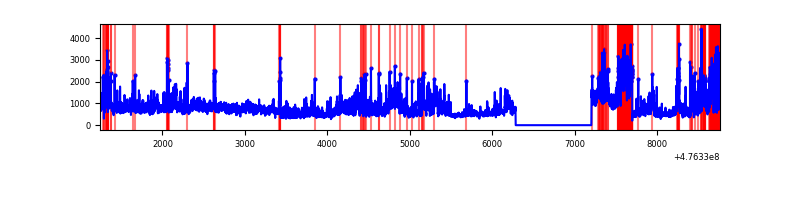 |
| C | 7522 | 6603 | 164 | 164 | 2.18% | 2.48% | 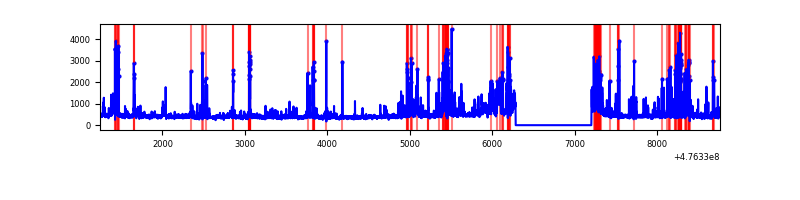 |
| D | 7522 | 6603 | 191 | 191 | 2.54% | 2.89% | 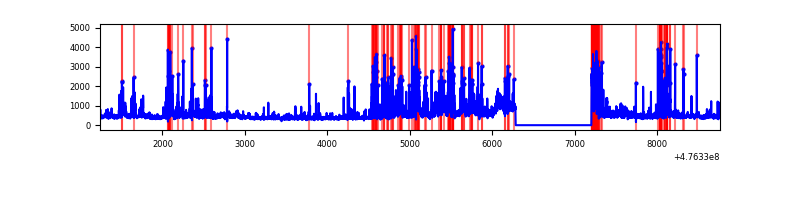 |
Top three noisy pixels from each quadrant. If the there are fewer than three noisy pixels in the level2.evt file, extra rows are filled as -1
| Pixel properties | Quadrant properties | ||||||
|---|---|---|---|---|---|---|---|
| Quadrant | DetID | PixID | Counts | Sigma | Mean | Median | Sigma |
| A | 12 | 250 | 514121 | 3090.16 | 681 | 666 | 166.2 |
| A | 4 | 3 | 84059 | 501.89 | 681 | 666 | 166.2 |
| A | 5 | 240 | 80261 | 479.03 | 681 | 666 | 166.2 |
| B | 5 | 172 | 1223279 | 8588.41 | 668 | 644 | 142.4 |
| B | 4 | 170 | 836143 | 5868.97 | 668 | 644 | 142.4 |
| B | 7 | 0 | 170630 | 1194.07 | 668 | 644 | 142.4 |
| C | 4 | 5 | 462396 | 2516.17 | 666 | 660 | 183.5 |
| C | 15 | 147 | 186551 | 1012.99 | 666 | 660 | 183.5 |
| C | 13 | 3 | 82135 | 443.99 | 666 | 660 | 183.5 |
| D | 7 | 96 | 257106 | 1430.94 | 652 | 630 | 179.2 |
| D | 12 | 191 | 247297 | 1376.21 | 652 | 630 | 179.2 |
| D | 2 | 249 | 246813 | 1373.51 | 652 | 630 | 179.2 |
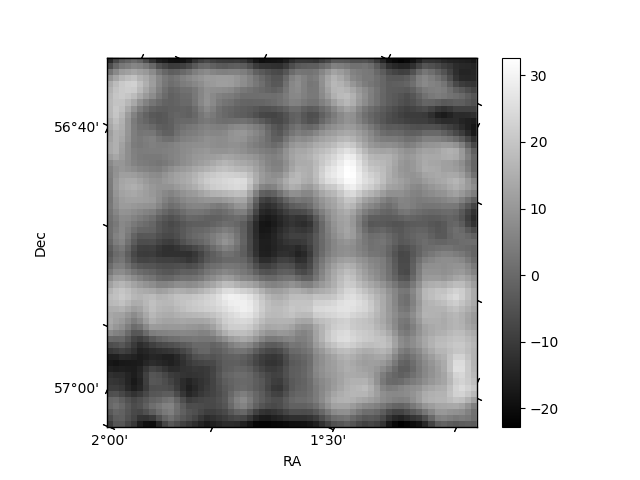
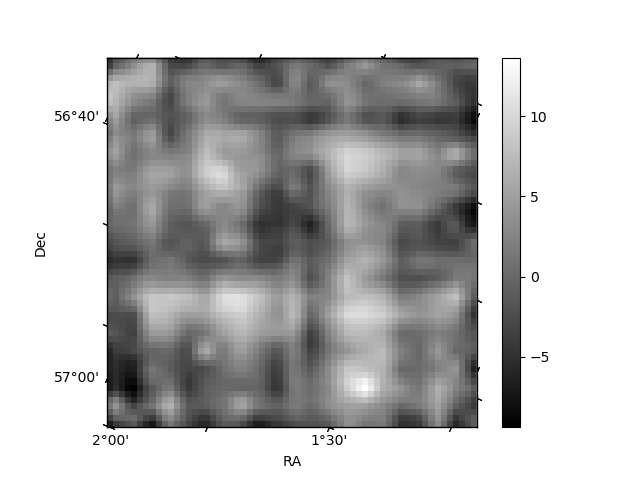
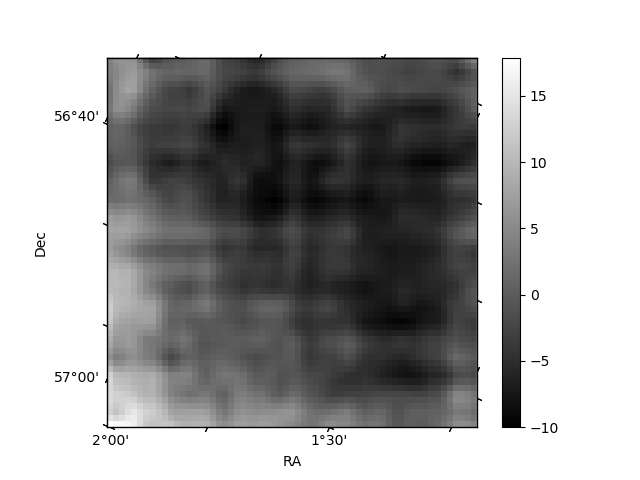
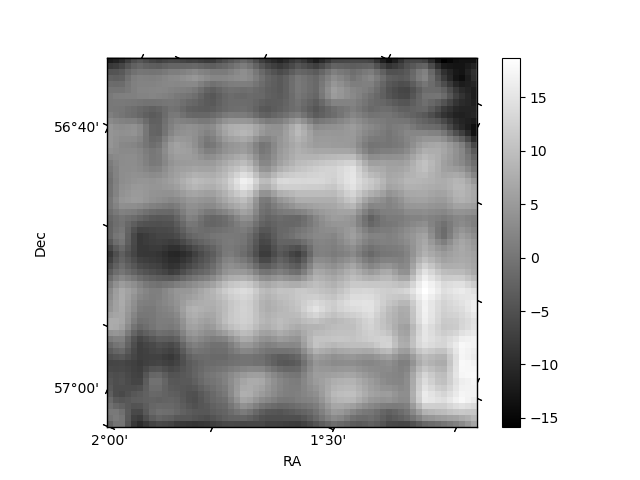
Histogram calculated using DETX and DETY for each event in the final _common_clean file
| Quadrant A | 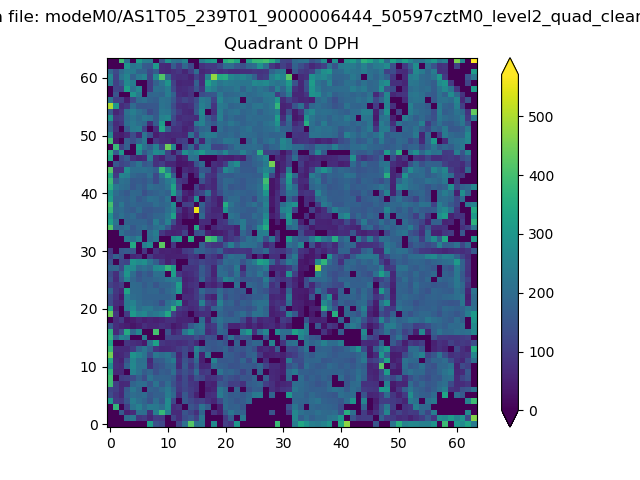 |
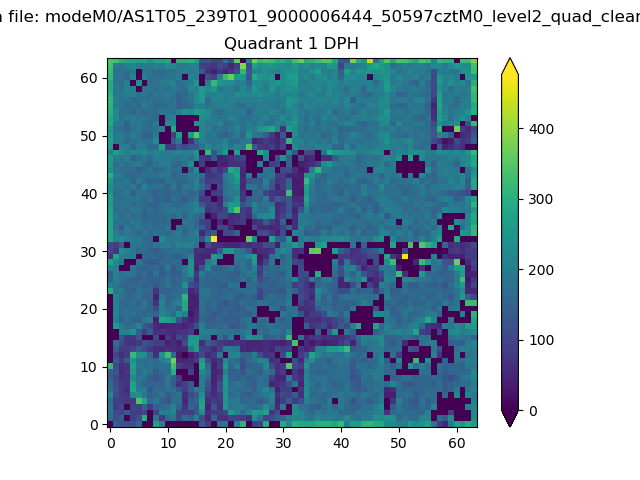 |
Quadrant B |
|---|---|---|---|
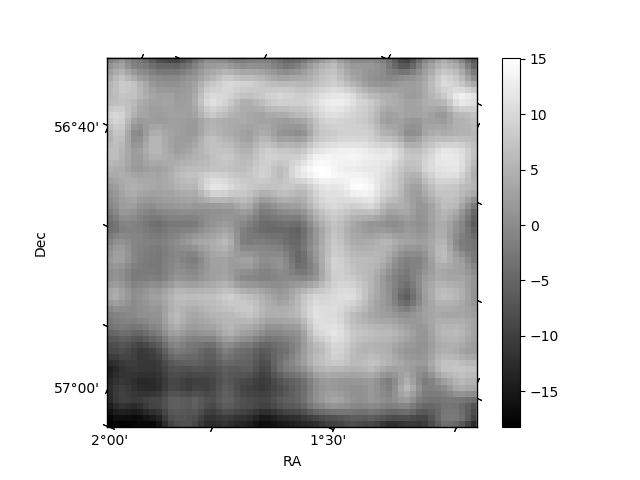
| Quadrant D | 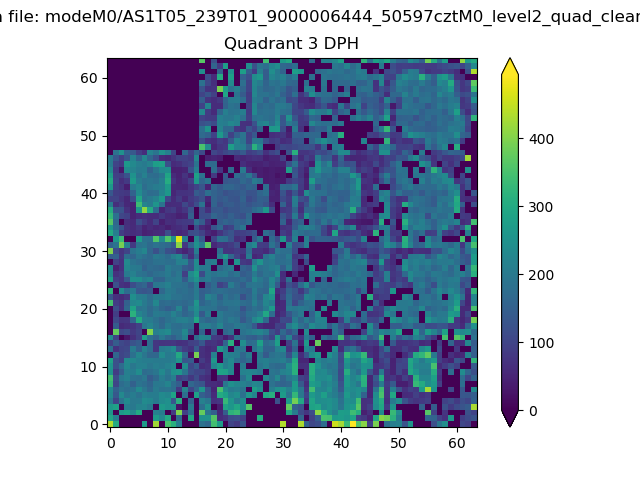 |
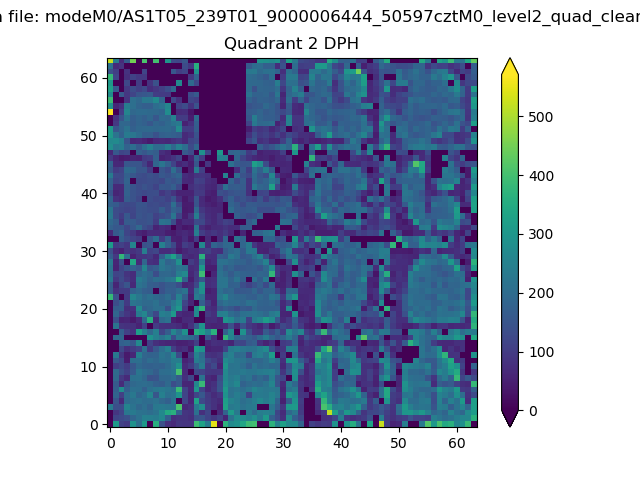 |
Quadrant C |
| Plot type | Count rate plots | Images |
|---|---|---|
| Comparison with Poisson distribution Blue bars denote a histogram of data divided into 1 sec bins. Red curve is a Poisson curve with rate = median count rate of data. |
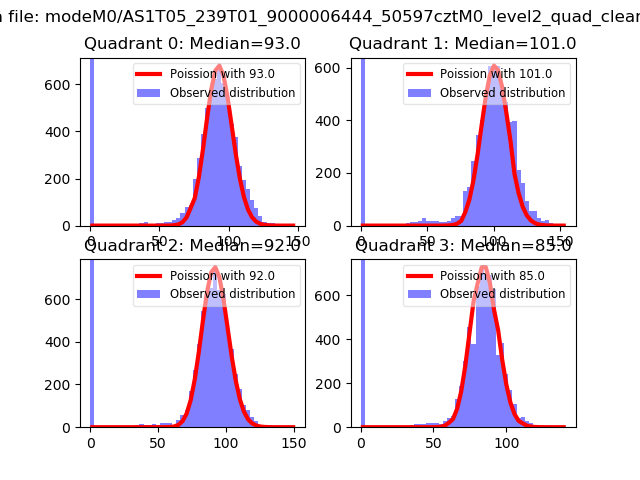 |
 |
| Quadrant-wise count rates Data is divided into 100 sec bins |
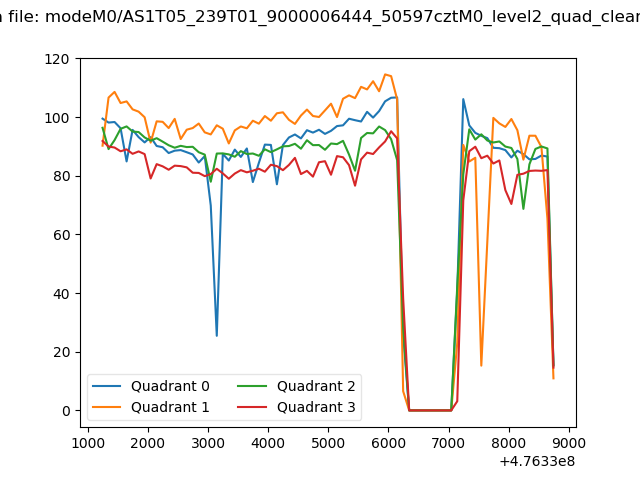 |
|
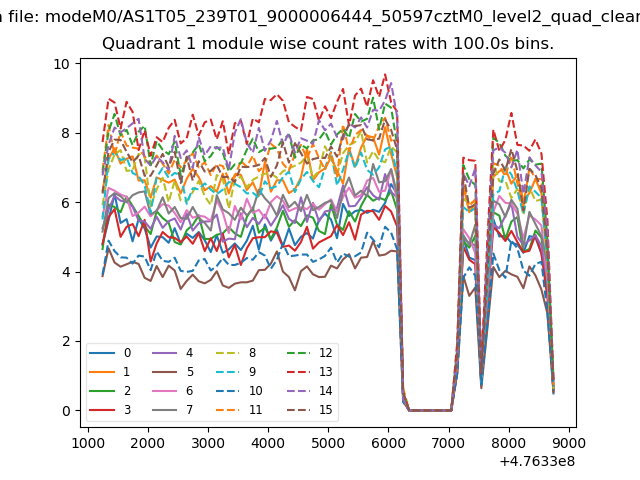
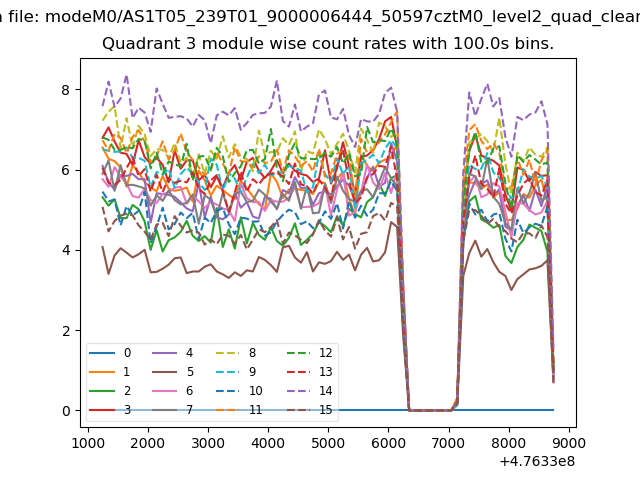
| Module-wise count rates for Quadrant A Data is divided into 100 sec bins |
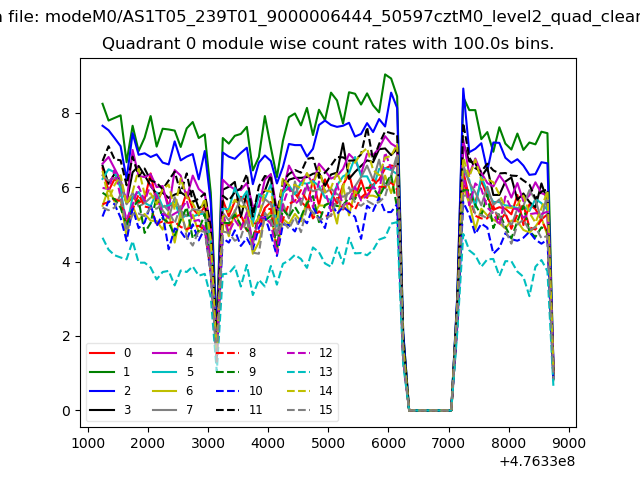 |
 |
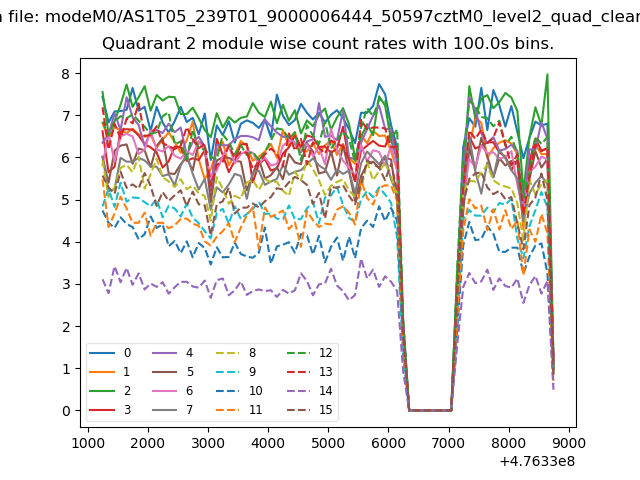
| Module-wise count rates for Quadrant B Data is divided into 100 sec bins |
 |
 |
| Module-wise count rates for Quadrant C Data is divided into 100 sec bins |
 |
 |
| Module-wise count rates for Quadrant D Data is divided into 100 sec bins |
 |
 |
| Parameter | Plot |
|---|---|
| CZT HV Monitor | 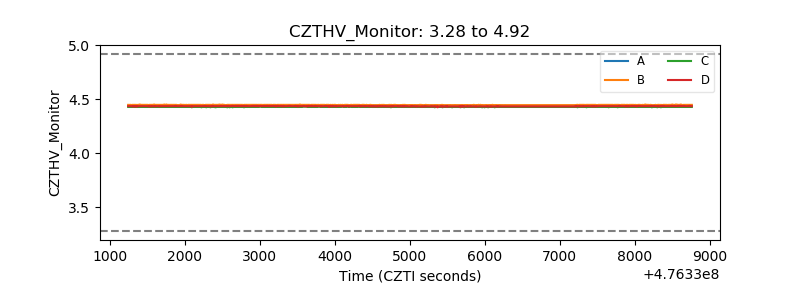 |
| D_VDD | 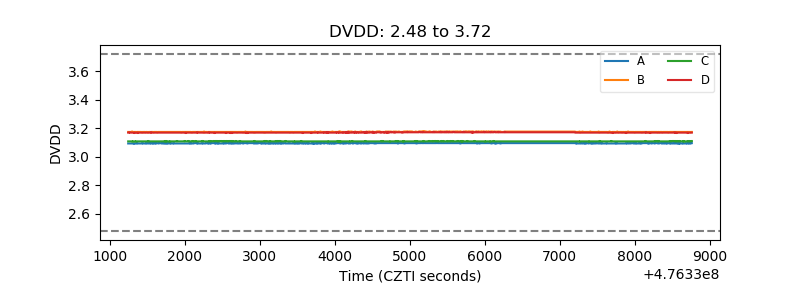 |
| Temperature 1 | 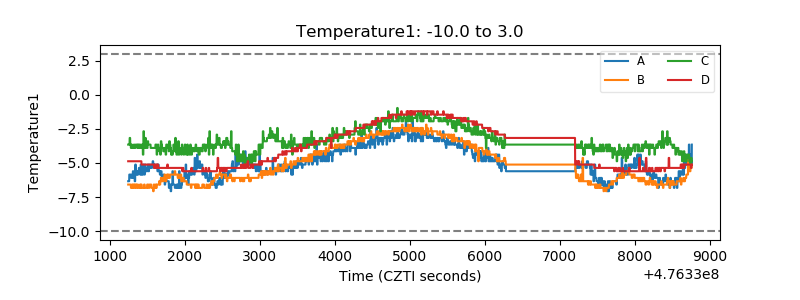 |
| Veto HV Monitor | 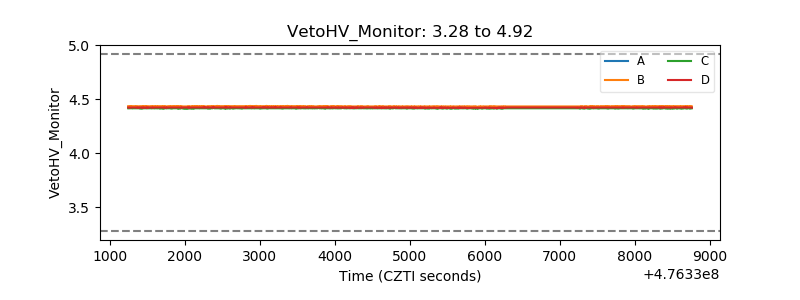 |
| Veto LLD | 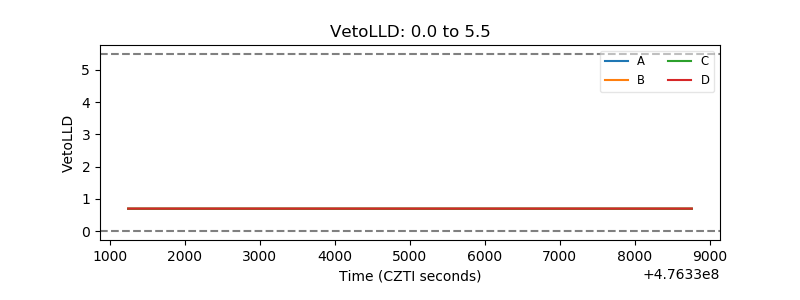 |
| Alpha Counter | 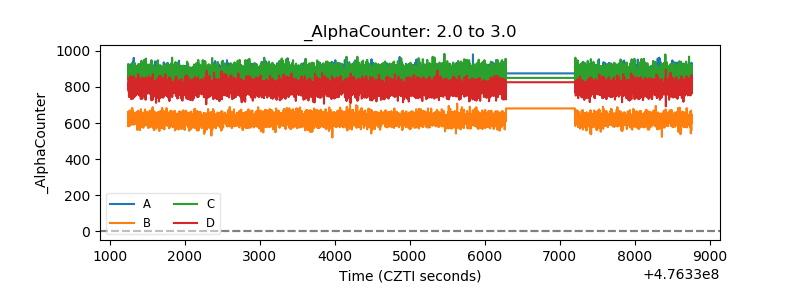 |
| _CPM_Rate | 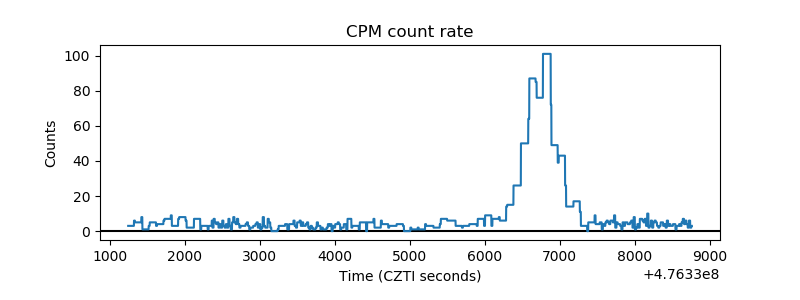 |
| CZT Counter | 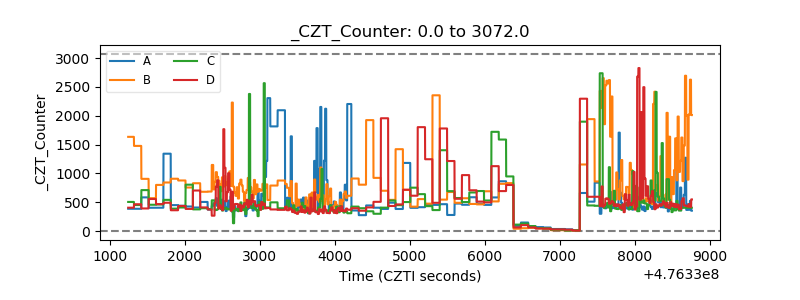 |
| +2.5 Volts monitor | 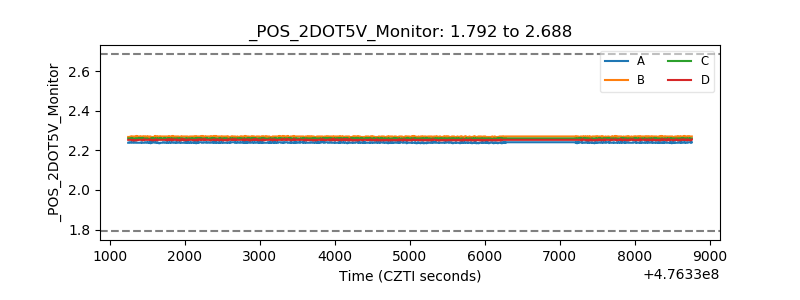 |
| +5 Volts monitor |  |
| _ROLL_ROT | 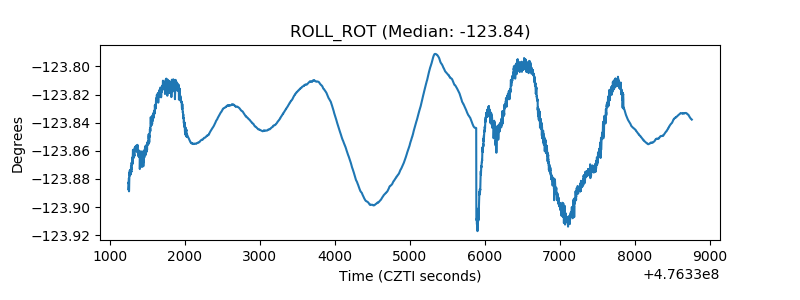 |
| _Roll_DEC | 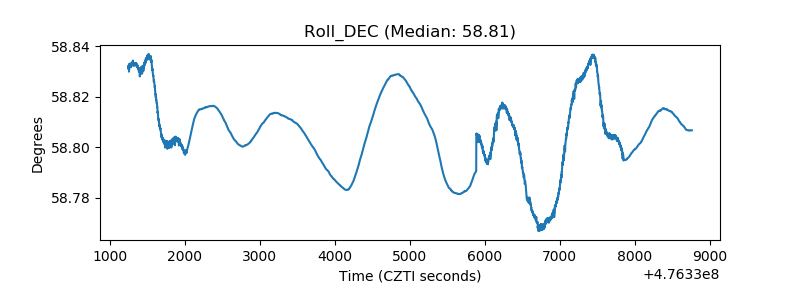 |
| _Roll_RA | 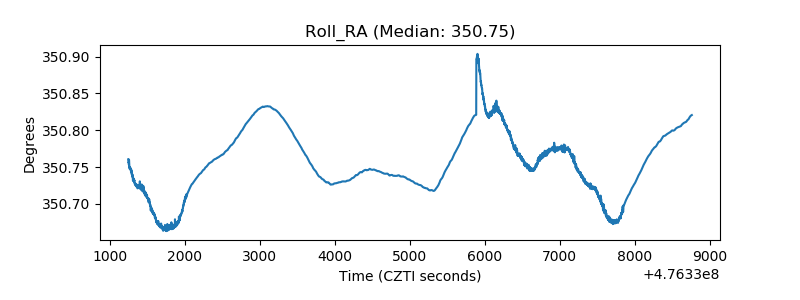 |
| Veto Counter | 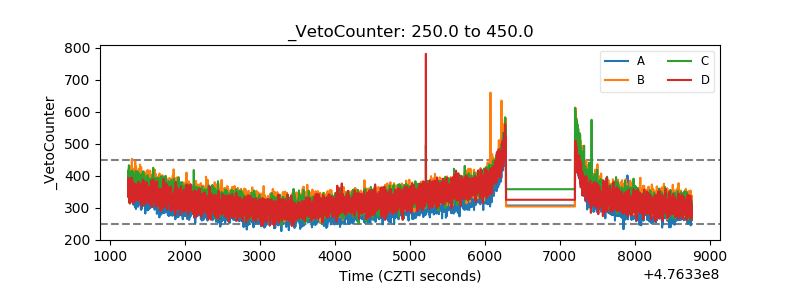 |