| Param | Original file | Final file |
|---|---|---|
| Filename | modeM0/AS1T05_239T01_9000006444_50598cztM0_level2.fits | modeM0/AS1T05_239T01_9000006444_50598cztM0_level2_quad_clean.evt |
| Size (bytes) | 551,905,920 | 100,900,800 |
| Size | 526.3 MB | 96.2 MB |
| Events in quadrant A | 4,045,444 | 651,924 |
| Events in quadrant B | 6,036,935 | 667,519 |
| Events in quadrant C | 4,406,122 | 634,898 |
| Events in quadrant D | 5,378,960 | 596,734 |
| Mode M0 | |||
|---|---|---|---|
| Quadrant | BADHDUFLAG | Total packets | Discarded packets |
| A | 0 | 17032 | 1 |
| B | 0 | 22954 | 3 |
| C | 0 | 18446 | 1 |
| D | 0 | 21106 | 1 |
| Mode M9 | |||
|---|---|---|---|
| Quadrant | BADHDUFLAG | Total packets | Discarded packets |
| A | 0 | 3 | 0 |
| B | 0 | 3 | 0 |
| C | 0 | 3 | 0 |
| D | 0 | 3 | 0 |
| Mode SS | |||
|---|---|---|---|
| Quadrant | BADHDUFLAG | Total packets | Discarded packets |
| A | 0 | 148 | 0 |
| B | 0 | 148 | 0 |
| C | 0 | 148 | 0 |
| D | 0 | 148 | 0 |
| Quadrant | Total seconds | Saturated seconds | Saturation percentage |
|---|---|---|---|
| A | 7244 | 241 | 3.326891% |
| B | 7243 | 788 | 10.879470% |
| C | 7243 | 332 | 4.583736% |
| D | 7244 | 333 | 4.596908% |
Noise dominated data is calculated using 1-second bins in cleaned event files. If a bin has >2000 counts, and if more than 50% of those come from <1% of pixels, then it is considered to be noise-dominated and hence unusable.
| Quadrant | # 1 sec bins | Bins with >0 counts | Bins with >2000 counts | High rate bins dominated by noise | Noise dominated (total time) | Noise dominated (detector-on time) | Marked lightcurve |
|---|---|---|---|---|---|---|---|
| A | 7460 | 7247 | 62 | 62 | 0.83% | 0.86% | 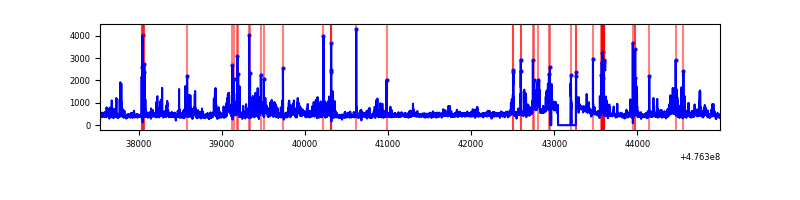 |
| B | 7459 | 7247 | 461 | 461 | 6.18% | 6.36% | 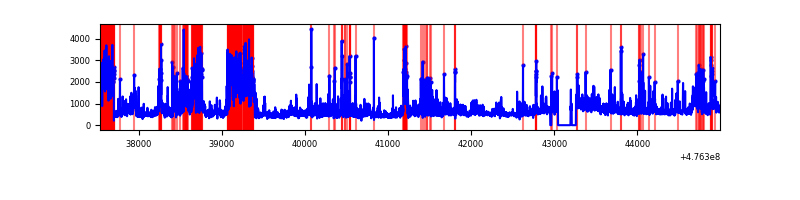 |
| C | 7459 | 7247 | 183 | 183 | 2.45% | 2.53% | 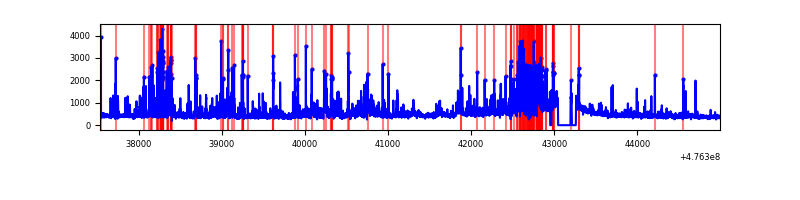 |
| D | 7460 | 7248 | 269 | 269 | 3.61% | 3.71% | 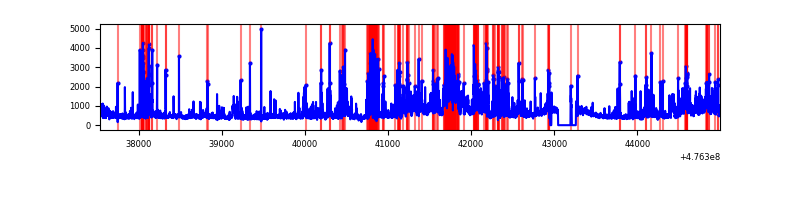 |
Top three noisy pixels from each quadrant. If the there are fewer than three noisy pixels in the level2.evt file, extra rows are filled as -1
| Pixel properties | Quadrant properties | ||||||
|---|---|---|---|---|---|---|---|
| Quadrant | DetID | PixID | Counts | Sigma | Mean | Median | Sigma |
| A | 8 | 247 | 312542 | 1678.03 | 760 | 740 | 185.8 |
| A | 12 | 250 | 147635 | 790.55 | 760 | 740 | 185.8 |
| A | 5 | 240 | 131177 | 701.98 | 760 | 740 | 185.8 |
| B | 5 | 172 | 831759 | 5354.01 | 735 | 709 | 155.2 |
| B | 5 | 32 | 642171 | 4132.6 | 735 | 709 | 155.2 |
| B | 4 | 170 | 480682 | 3092.21 | 735 | 709 | 155.2 |
| C | 4 | 5 | 541262 | 2671.26 | 731 | 725 | 202.4 |
| C | 15 | 147 | 156117 | 767.92 | 731 | 725 | 202.4 |
| C | 13 | 3 | 151263 | 743.94 | 731 | 725 | 202.4 |
| D | 12 | 191 | 546649 | 2692.6 | 728 | 701 | 202.8 |
| D | 8 | 48 | 383174 | 1886.35 | 728 | 701 | 202.8 |
| D | 2 | 249 | 326122 | 1604.97 | 728 | 701 | 202.8 |
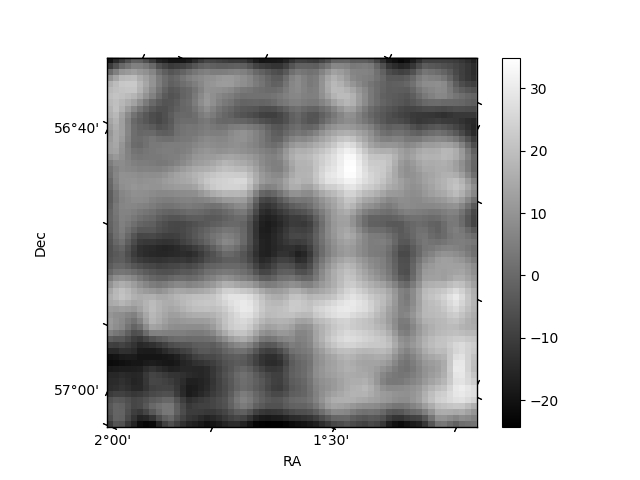
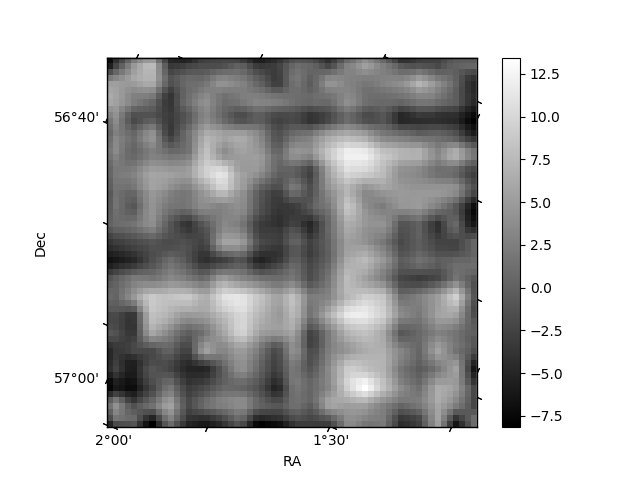
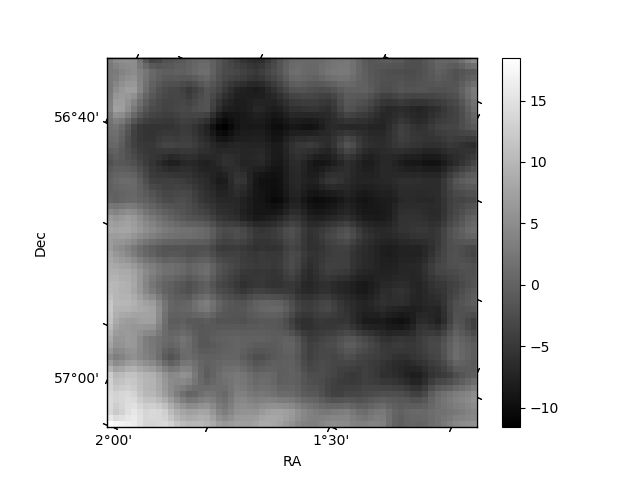
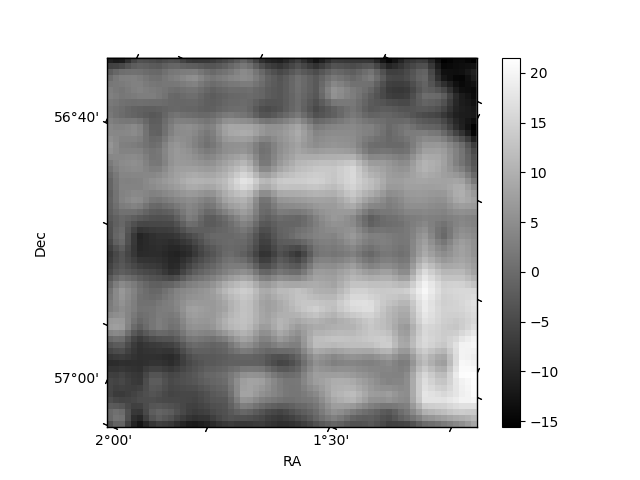
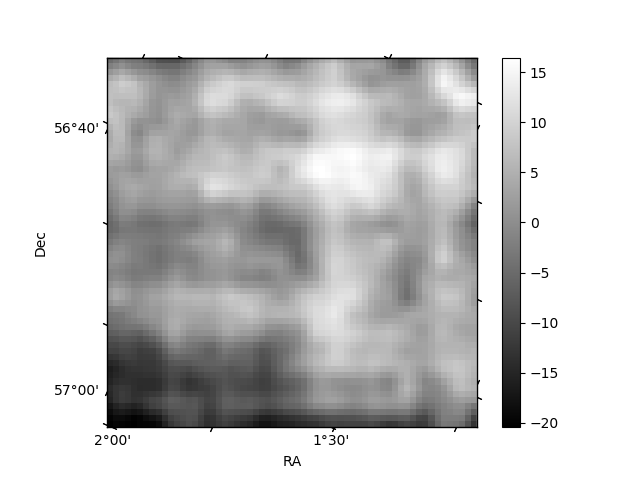
Histogram calculated using DETX and DETY for each event in the final _common_clean file
| Quadrant A | 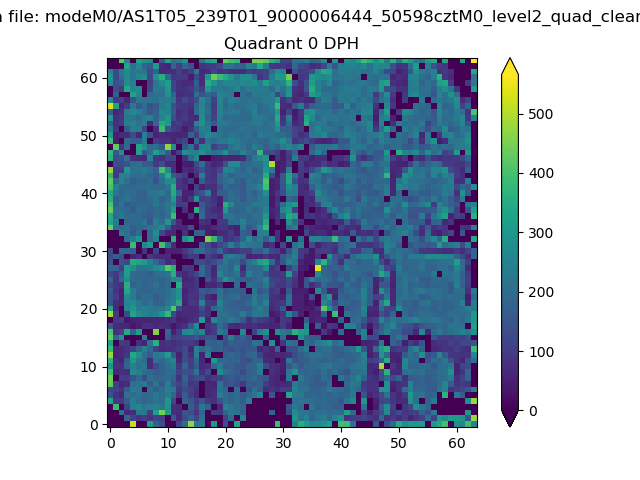 |
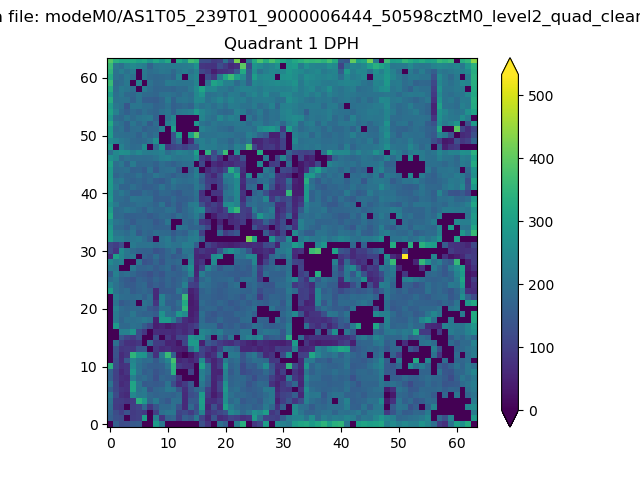 |
Quadrant B |
|---|---|---|---|
| Quadrant D | 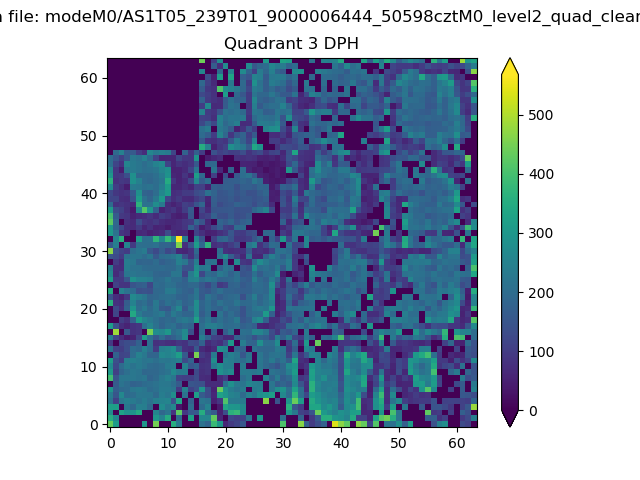 |
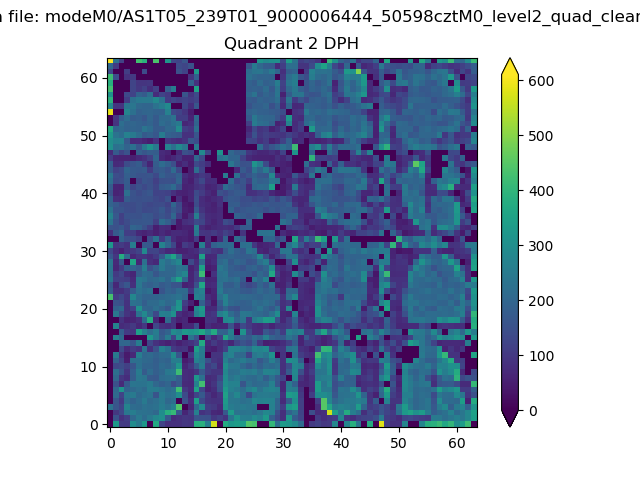 |
Quadrant C |
| Plot type | Count rate plots | Images |
|---|---|---|
| Comparison with Poisson distribution Blue bars denote a histogram of data divided into 1 sec bins. Red curve is a Poisson curve with rate = median count rate of data. |
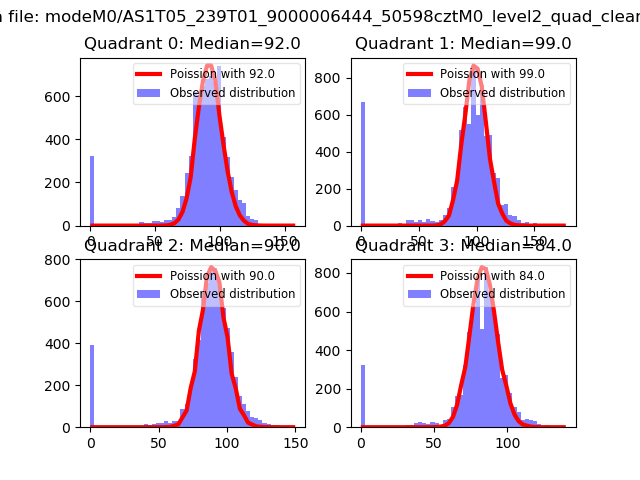 |
 |
| Quadrant-wise count rates Data is divided into 100 sec bins |
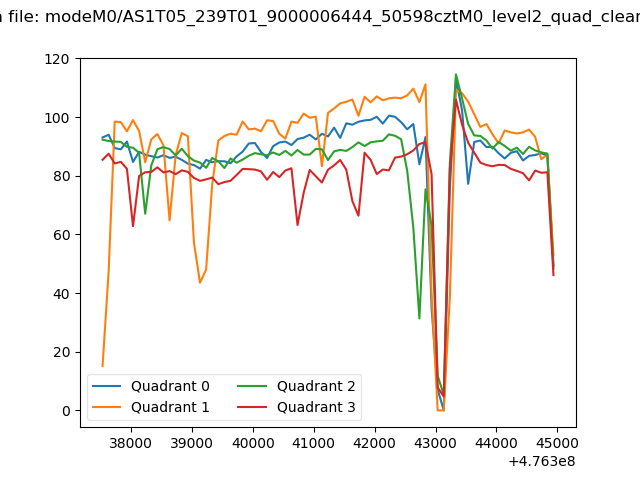 |
|
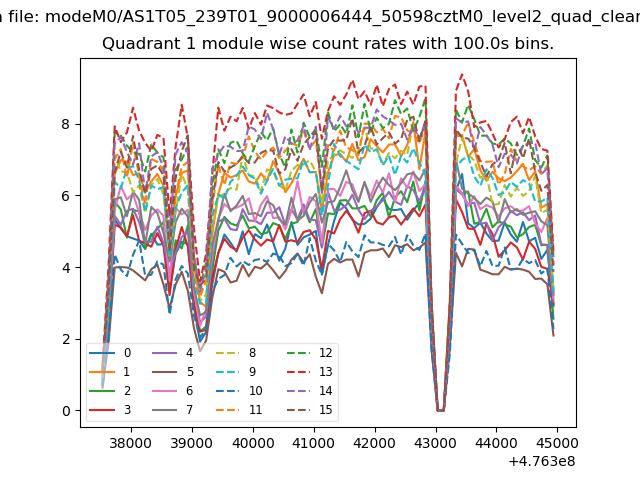
| Module-wise count rates for Quadrant A Data is divided into 100 sec bins |
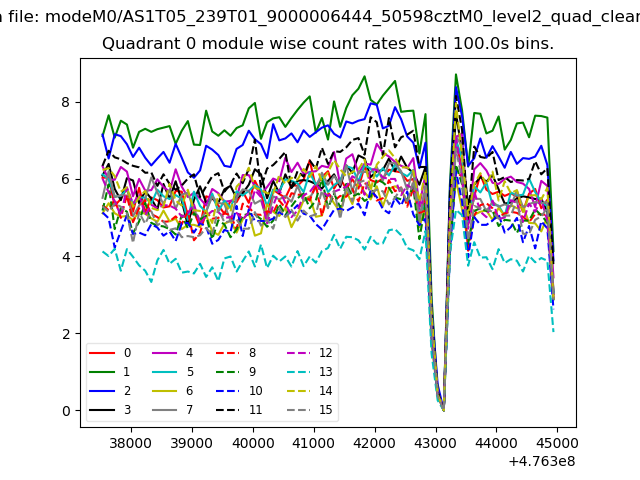 |
 |
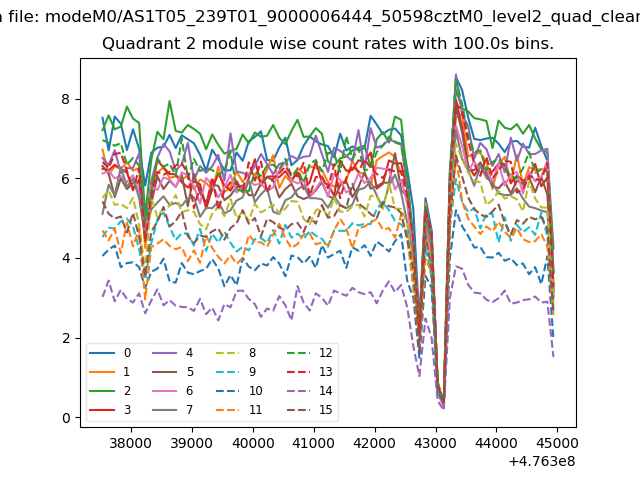
| Module-wise count rates for Quadrant B Data is divided into 100 sec bins |
 |
 |
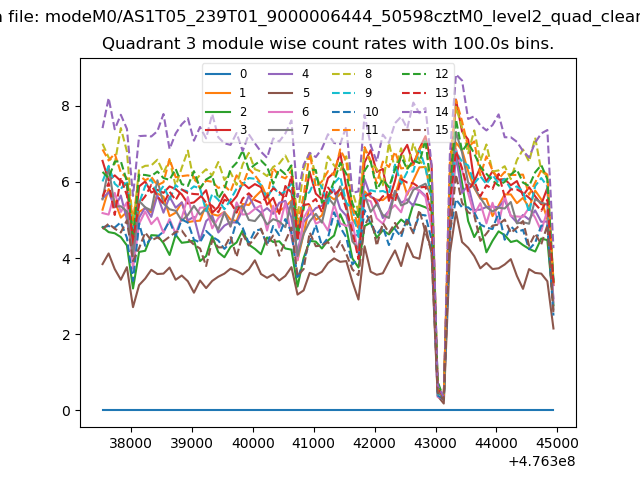
| Module-wise count rates for Quadrant C Data is divided into 100 sec bins |
 |
 |
| Module-wise count rates for Quadrant D Data is divided into 100 sec bins |
 |
 |
| Parameter | Plot |
|---|---|
| CZT HV Monitor | 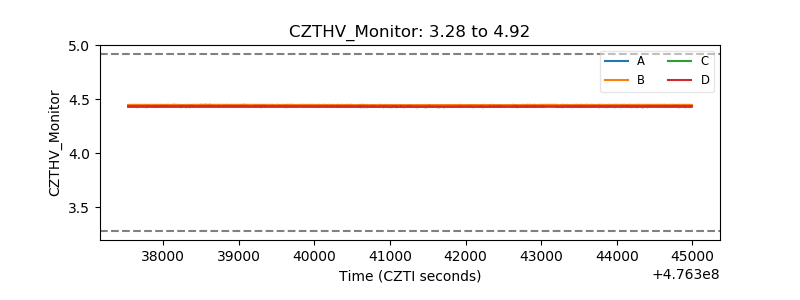 |
| D_VDD | 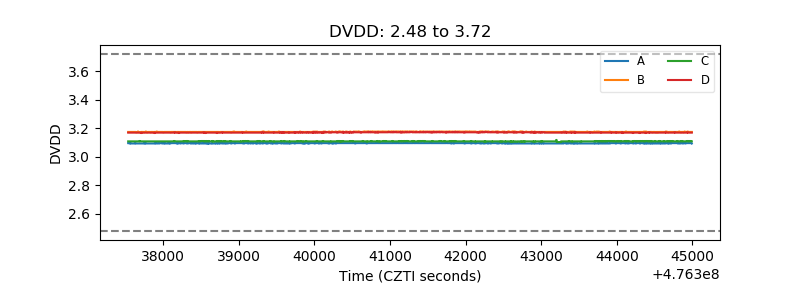 |
| Temperature 1 | 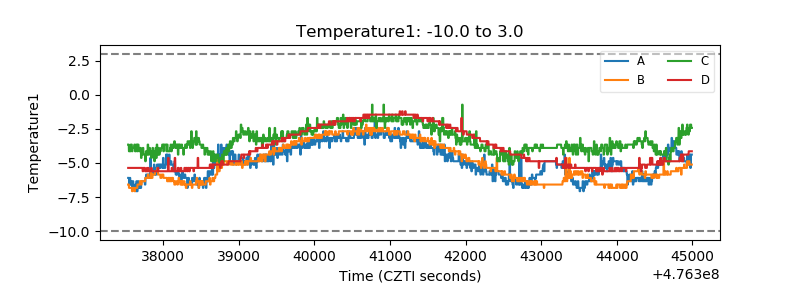 |
| Veto HV Monitor | 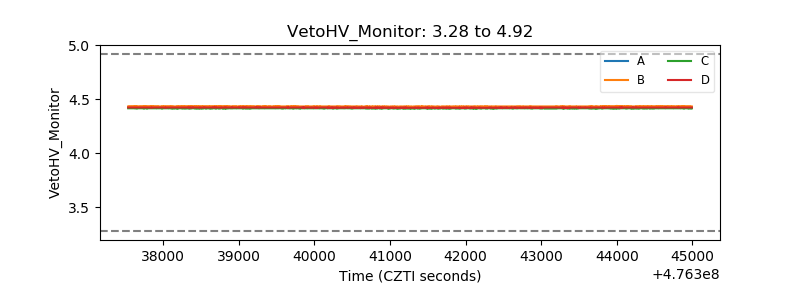 |
| Veto LLD | 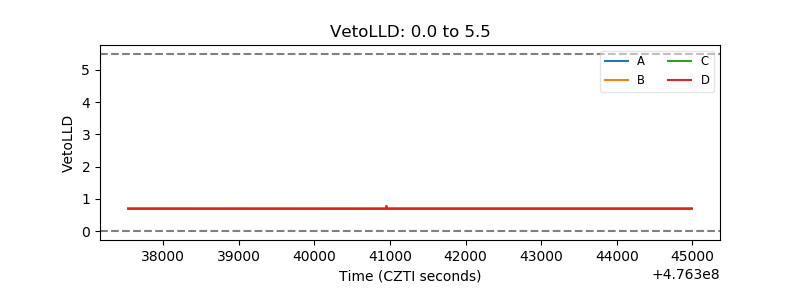 |
| Alpha Counter | 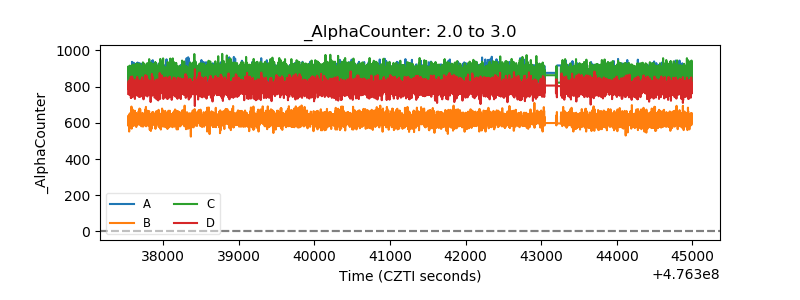 |
| _CPM_Rate | 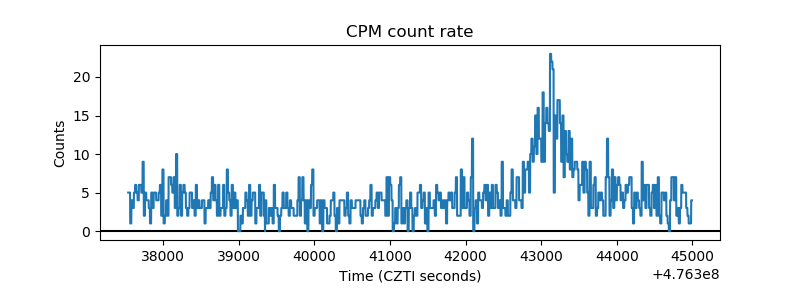 |
| CZT Counter | 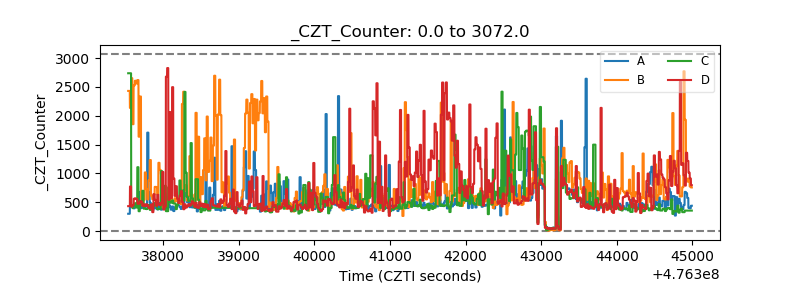 |
| +2.5 Volts monitor | 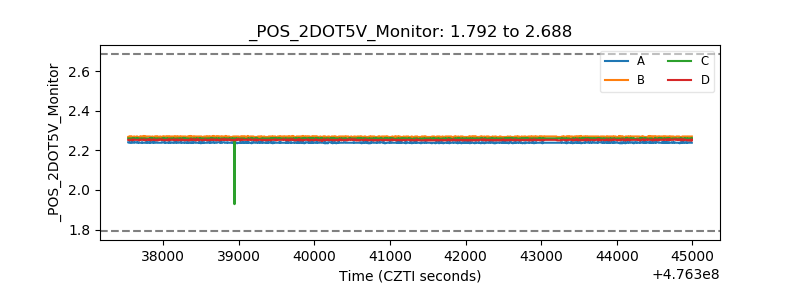 |
| +5 Volts monitor |  |
| _ROLL_ROT | 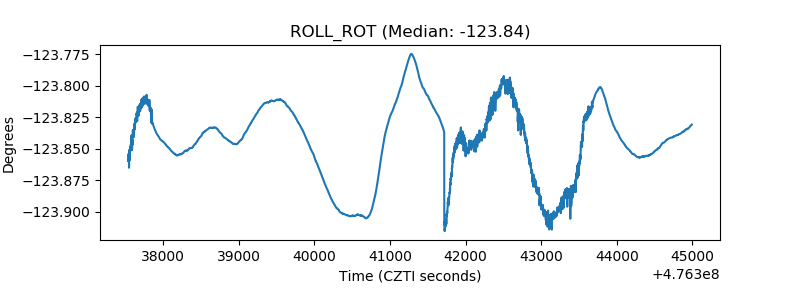 |
| _Roll_DEC | 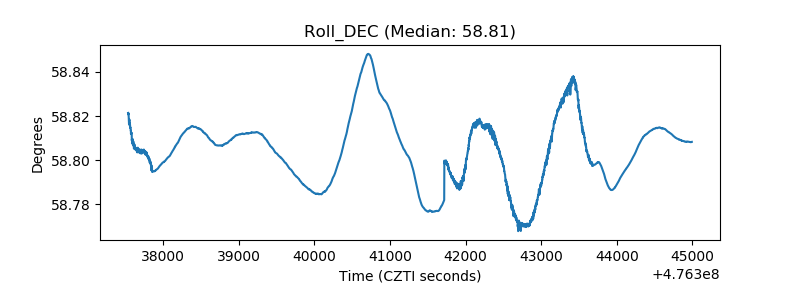 |
| _Roll_RA | 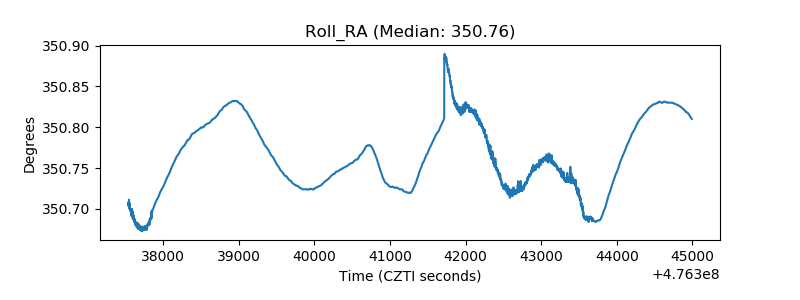 |
| Veto Counter | 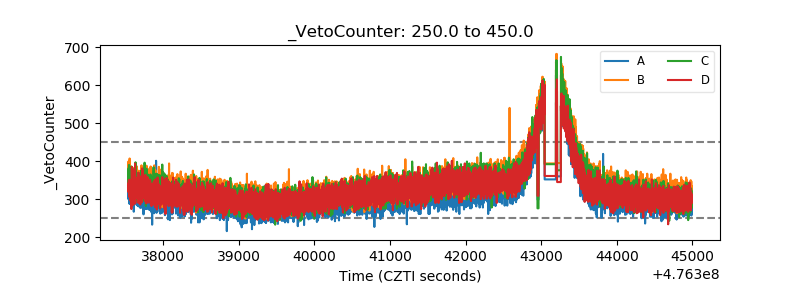 |