| Param | Original file | Final file |
|---|---|---|
| Filename | modeM0/AS1T05_239T01_9000006444_50599cztM0_level2.fits | modeM0/AS1T05_239T01_9000006444_50599cztM0_level2_quad_clean.evt |
| Size (bytes) | 742,999,680 | 105,575,040 |
| Size | 708.6 MB | 100.7 MB |
| Events in quadrant A | 4,643,485 | 716,087 |
| Events in quadrant B | 9,926,654 | 630,315 |
| Events in quadrant C | 4,974,763 | 679,602 |
| Events in quadrant D | 7,348,347 | 621,955 |
| Mode M0 | |||
|---|---|---|---|
| Quadrant | BADHDUFLAG | Total packets | Discarded packets |
| A | 0 | 19175 | 1 |
| B | 0 | 35204 | 1 |
| C | 0 | 20657 | 2 |
| D | 0 | 27391 | 1 |
| Mode SS | |||
|---|---|---|---|
| Quadrant | BADHDUFLAG | Total packets | Discarded packets |
| A | 0 | 158 | 0 |
| B | 0 | 158 | 0 |
| C | 0 | 158 | 0 |
| D | 0 | 158 | 0 |
| Quadrant | Total seconds | Saturated seconds | Saturation percentage |
|---|---|---|---|
| A | 7887 | 148 | 1.876506% |
| B | 7887 | 1890 | 23.963484% |
| C | 7887 | 386 | 4.894130% |
| D | 7887 | 636 | 8.063903% |
Noise dominated data is calculated using 1-second bins in cleaned event files. If a bin has >2000 counts, and if more than 50% of those come from <1% of pixels, then it is considered to be noise-dominated and hence unusable.
| Quadrant | # 1 sec bins | Bins with >0 counts | Bins with >2000 counts | High rate bins dominated by noise | Noise dominated (total time) | Noise dominated (detector-on time) | Marked lightcurve |
|---|---|---|---|---|---|---|---|
| A | 7887 | 7887 | 101 | 101 | 1.28% | 1.28% | 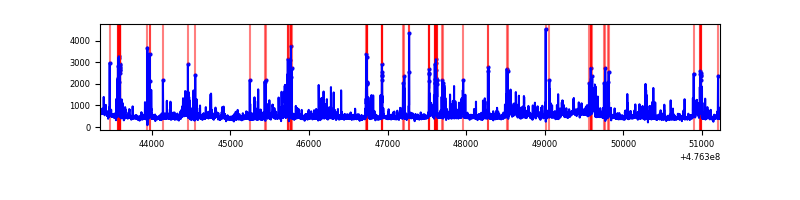 |
| B | 7887 | 7887 | 1403 | 1403 | 17.79% | 17.79% | 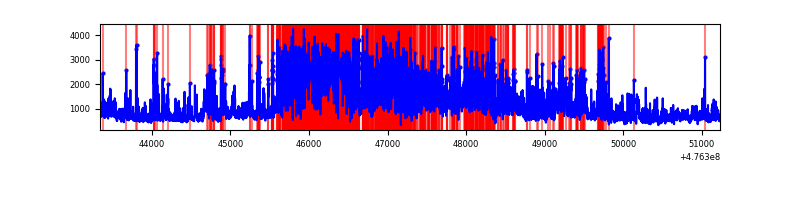 |
| C | 7887 | 7887 | 309 | 309 | 3.92% | 3.92% | 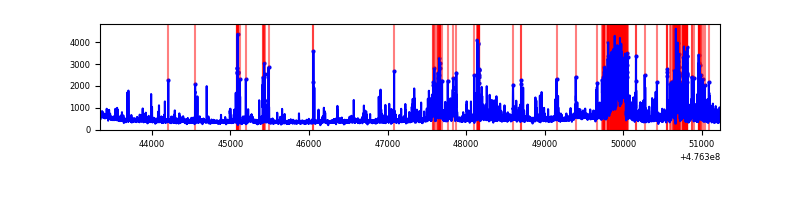 |
| D | 7887 | 7887 | 739 | 739 | 9.37% | 9.37% | 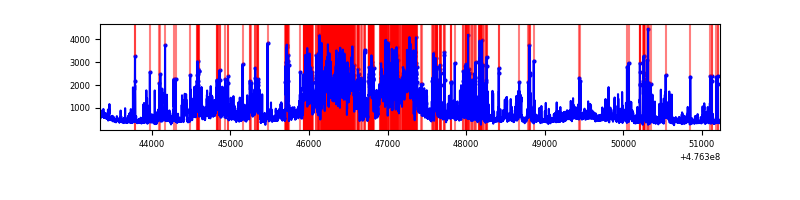 |
Top three noisy pixels from each quadrant. If the there are fewer than three noisy pixels in the level2.evt file, extra rows are filled as -1
| Pixel properties | Quadrant properties | ||||||
|---|---|---|---|---|---|---|---|
| Quadrant | DetID | PixID | Counts | Sigma | Mean | Median | Sigma |
| A | 12 | 250 | 382618 | 1889.65 | 822 | 802 | 202.1 |
| A | 10 | 253 | 144607 | 711.71 | 822 | 802 | 202.1 |
| A | 5 | 240 | 126231 | 620.76 | 822 | 802 | 202.1 |
| B | 5 | 172 | 4066291 | 25145.38 | 752 | 726 | 161.7 |
| B | 4 | 170 | 640164 | 3954.9 | 752 | 726 | 161.7 |
| B | 0 | 229 | 332740 | 2053.49 | 752 | 726 | 161.7 |
| C | 0 | 208 | 472007 | 2145.65 | 791 | 784 | 219.6 |
| C | 15 | 232 | 281695 | 1279.09 | 791 | 784 | 219.6 |
| C | 4 | 5 | 233525 | 1059.75 | 791 | 784 | 219.6 |
| D | 8 | 48 | 1041588 | 4907.6 | 774 | 748 | 212.1 |
| D | 12 | 191 | 827384 | 3897.62 | 774 | 748 | 212.1 |
| D | 10 | 98 | 744571 | 3507.15 | 774 | 748 | 212.1 |
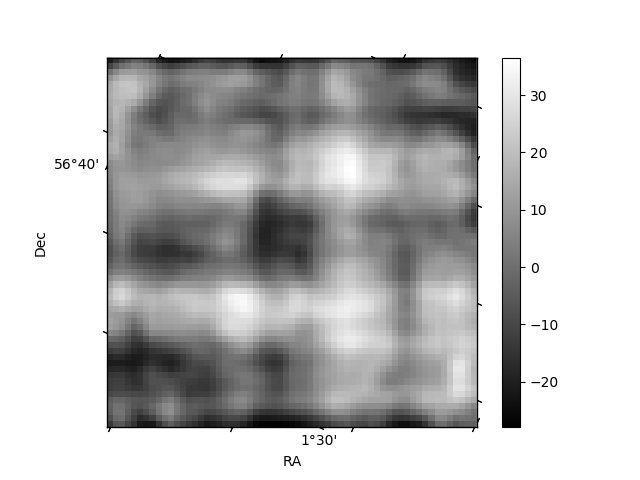
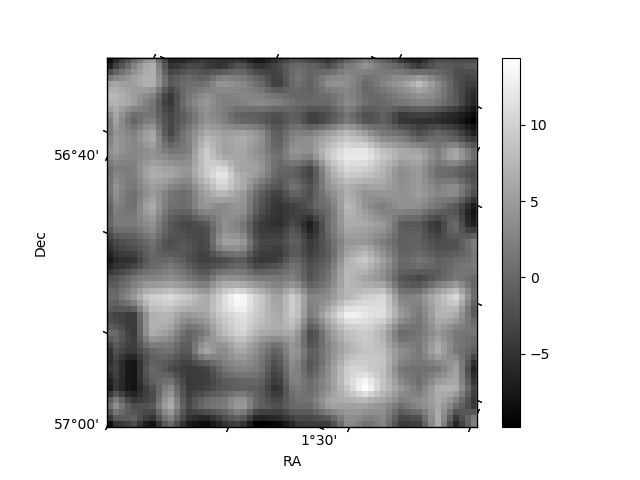
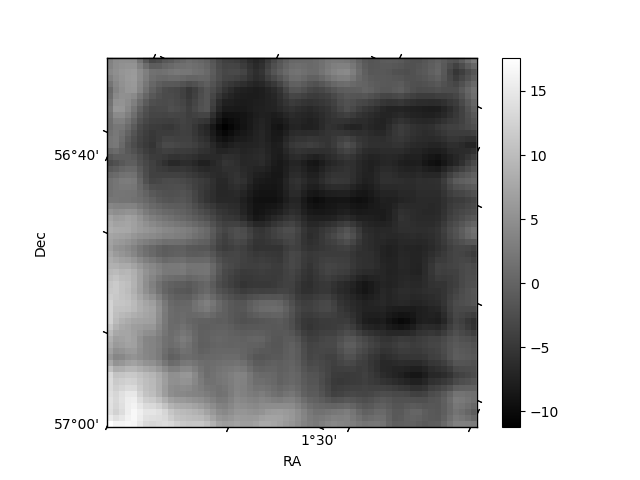
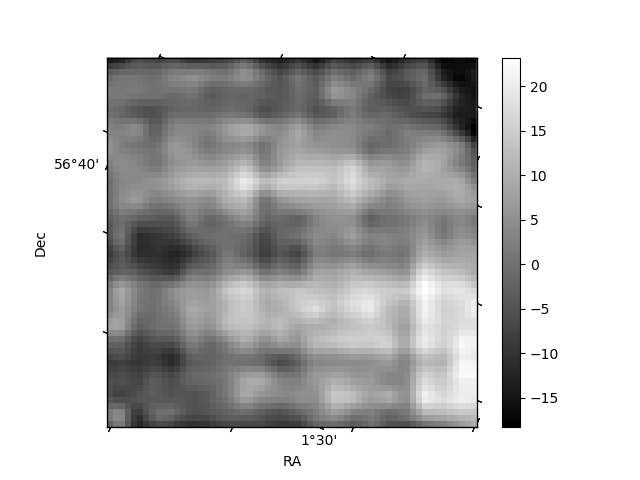
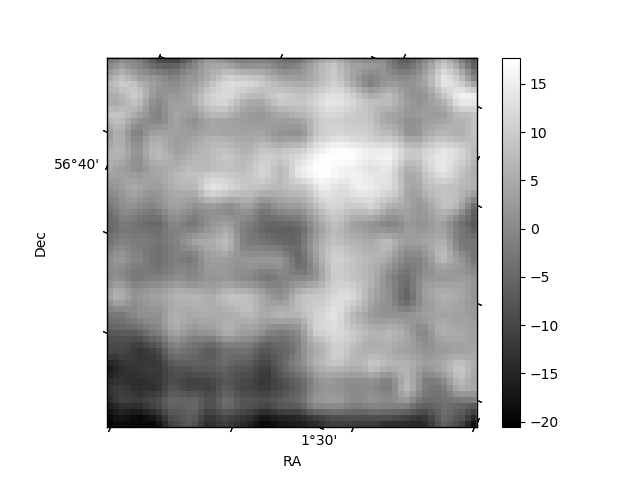
Histogram calculated using DETX and DETY for each event in the final _common_clean file
| Quadrant A | 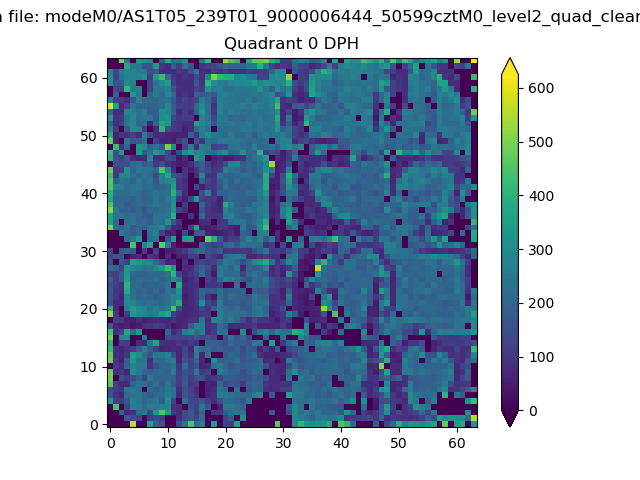 |
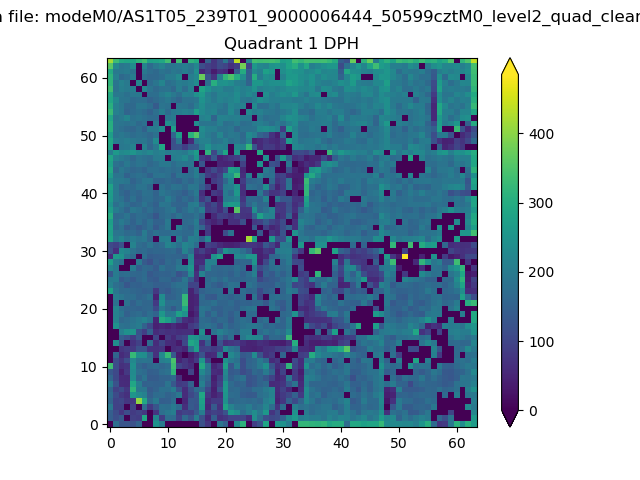 |
Quadrant B |
|---|---|---|---|
| Quadrant D | 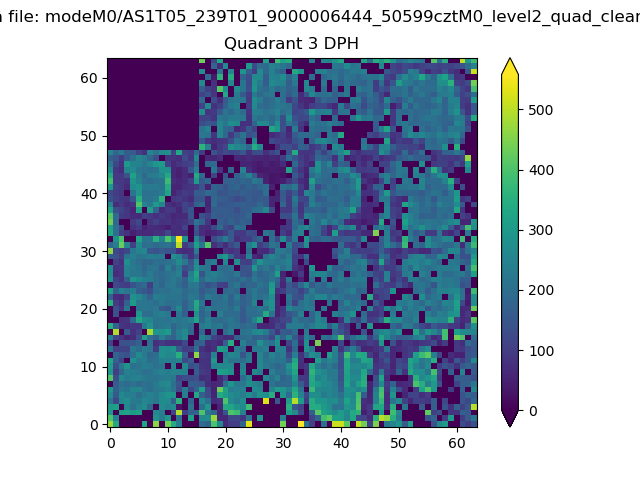 |
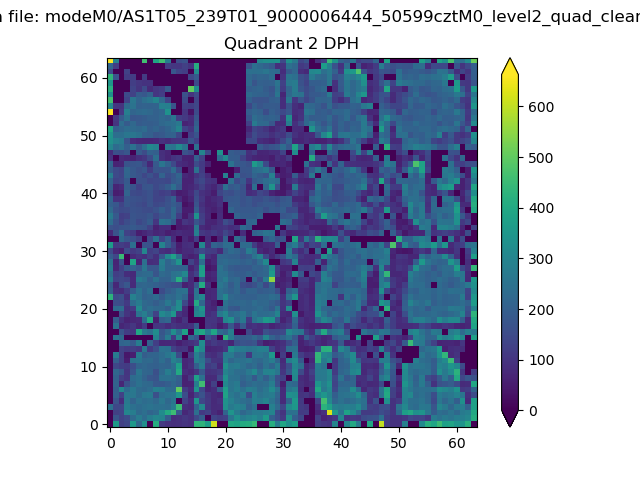 |
Quadrant C |
| Plot type | Count rate plots | Images |
|---|---|---|
| Comparison with Poisson distribution Blue bars denote a histogram of data divided into 1 sec bins. Red curve is a Poisson curve with rate = median count rate of data. |
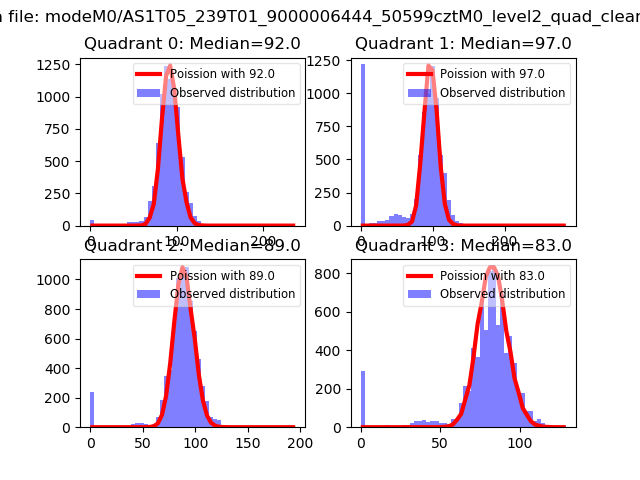 |
 |
| Quadrant-wise count rates Data is divided into 100 sec bins |
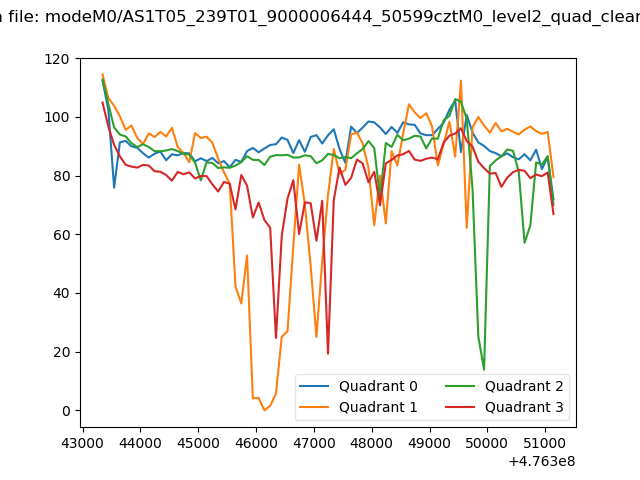 |
|
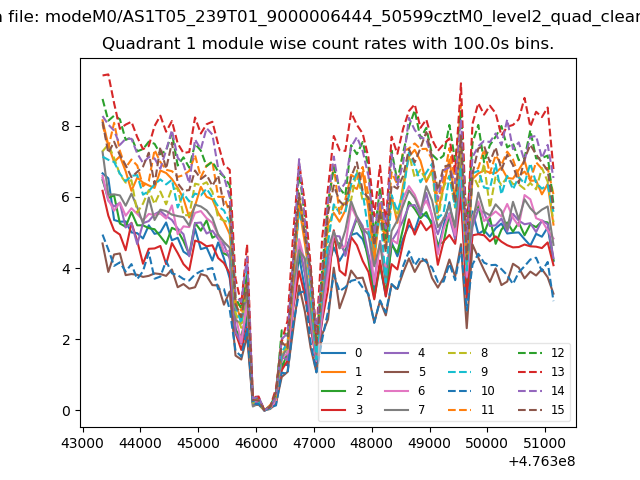
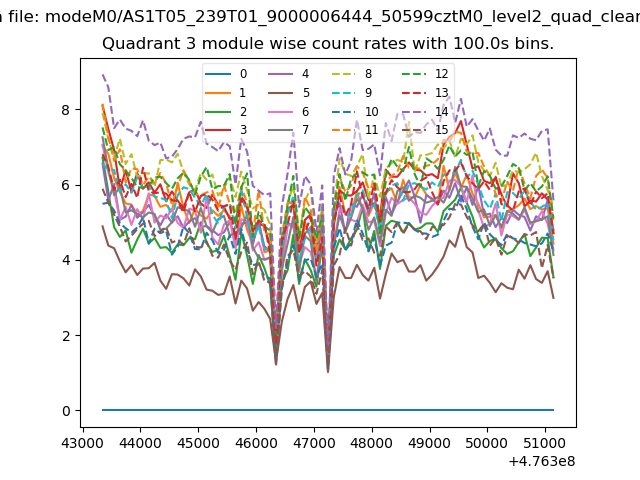
| Module-wise count rates for Quadrant A Data is divided into 100 sec bins |
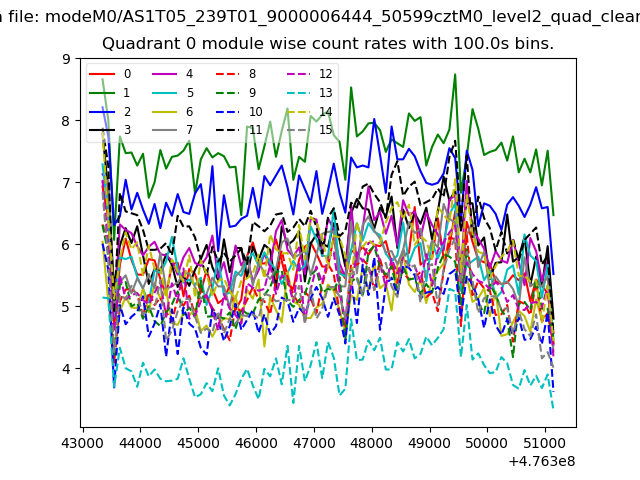 |
 |
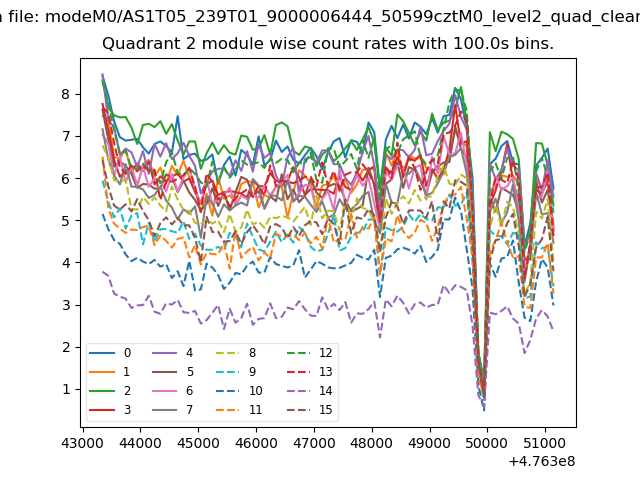
| Module-wise count rates for Quadrant B Data is divided into 100 sec bins |
 |
 |
| Module-wise count rates for Quadrant C Data is divided into 100 sec bins |
 |
 |
| Module-wise count rates for Quadrant D Data is divided into 100 sec bins |
 |
 |
| Parameter | Plot |
|---|---|
| CZT HV Monitor | 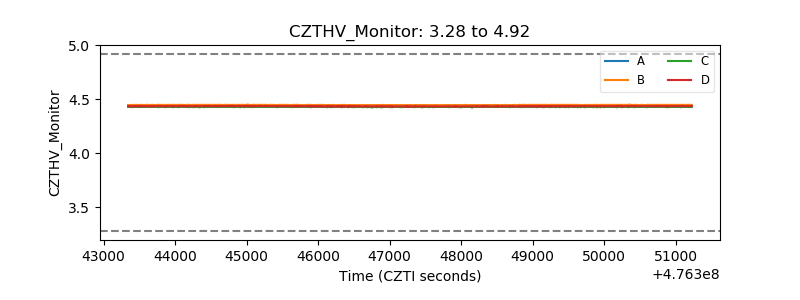 |
| D_VDD | 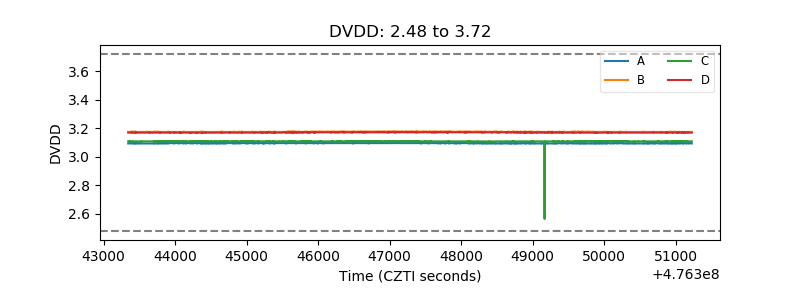 |
| Temperature 1 | 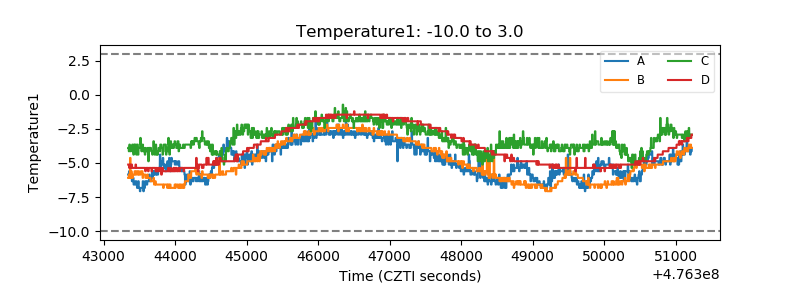 |
| Veto HV Monitor | 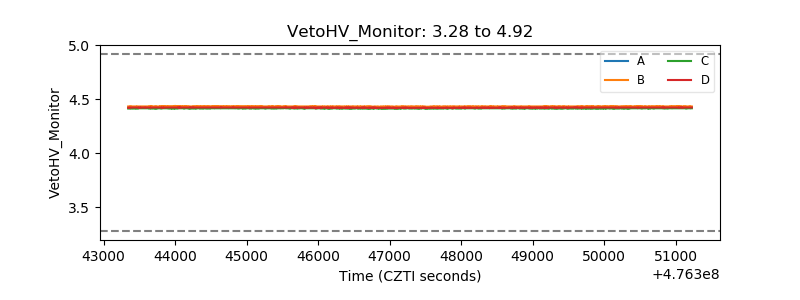 |
| Veto LLD | 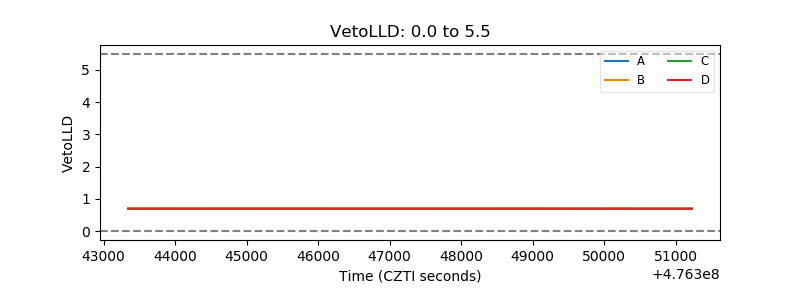 |
| Alpha Counter | 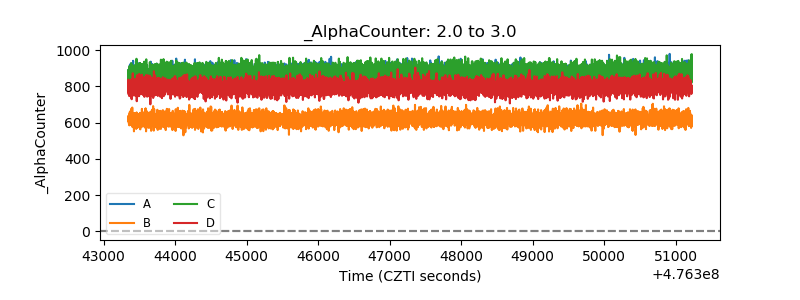 |
| _CPM_Rate | 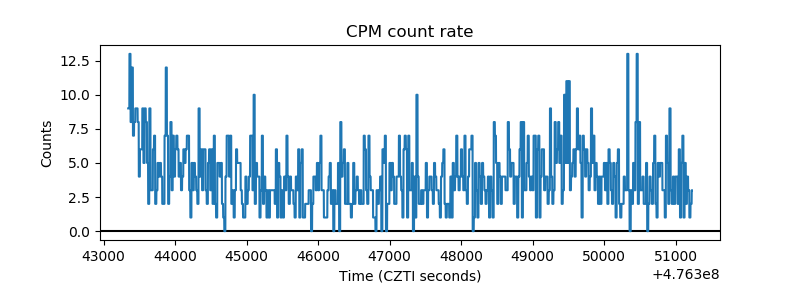 |
| CZT Counter | 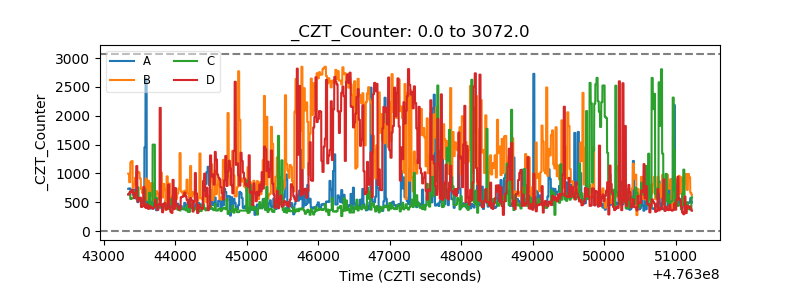 |
| +2.5 Volts monitor |  |
| +5 Volts monitor | 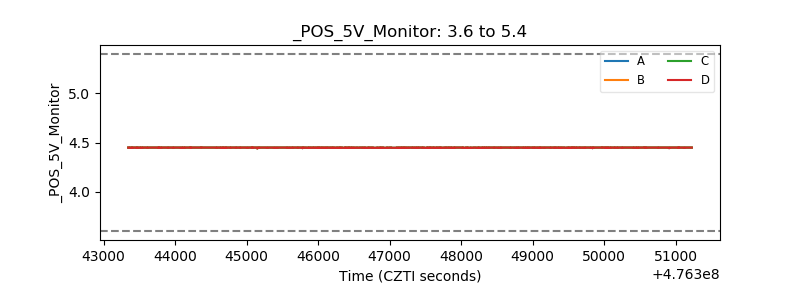 |
| _ROLL_ROT | 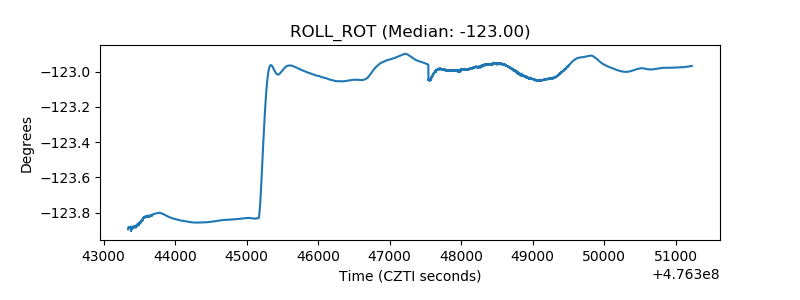 |
| _Roll_DEC | 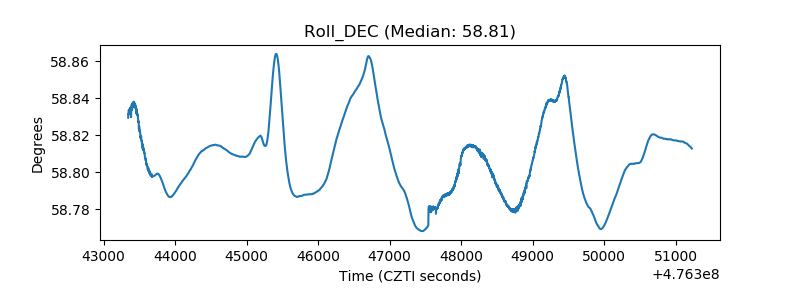 |
| _Roll_RA | 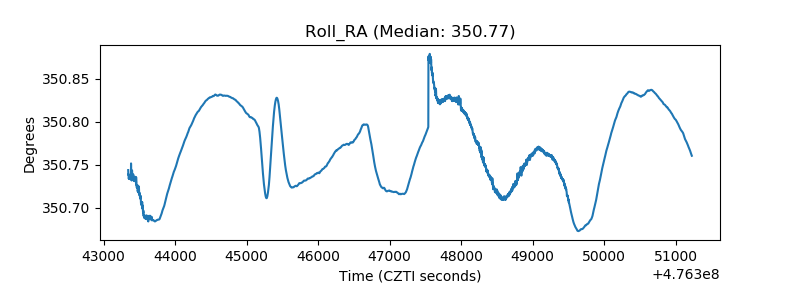 |
| Veto Counter | 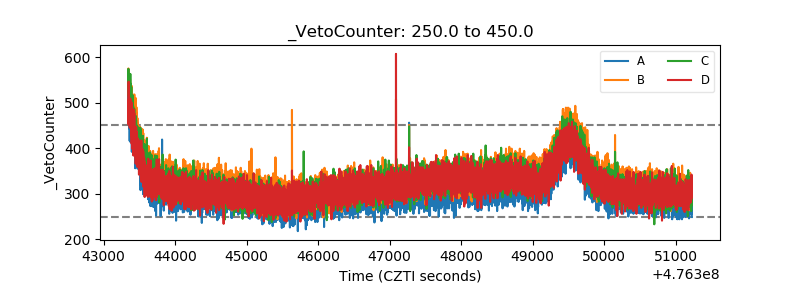 |