| Param | Original file | Final file |
|---|---|---|
| Filename | modeM0/AS1T05_239T01_9000006444_50603cztM0_level2.fits | modeM0/AS1T05_239T01_9000006444_50603cztM0_level2_quad_clean.evt |
| Size (bytes) | 2,350,555,200 | 223,413,120 |
| Size | 2.2 GB | 213.1 MB |
| Events in quadrant A | 12,832,273 | 1,662,044 |
| Events in quadrant B | 29,939,645 | 1,218,974 |
| Events in quadrant C | 24,840,577 | 1,180,179 |
| Events in quadrant D | 17,949,268 | 1,403,207 |
| Mode M0 | |||
|---|---|---|---|
| Quadrant | BADHDUFLAG | Total packets | Discarded packets |
| A | 0 | 50809 | 5 |
| B | 0 | 102048 | 2 |
| C | 0 | 86879 | 2 |
| D | 0 | 66621 | 2 |
| Mode M9 | |||
|---|---|---|---|
| Quadrant | BADHDUFLAG | Total packets | Discarded packets |
| A | 0 | 8 | 0 |
| B | 0 | 8 | 0 |
| C | 0 | 8 | 0 |
| D | 0 | 8 | 0 |
| Mode SS | |||
|---|---|---|---|
| Quadrant | BADHDUFLAG | Total packets | Discarded packets |
| A | 0 | 382 | 0 |
| B | 0 | 382 | 0 |
| C | 0 | 382 | 0 |
| D | 0 | 382 | 0 |
| Quadrant | Total seconds | Saturated seconds | Saturation percentage |
|---|---|---|---|
| A | 18833 | 722 | 3.833696% |
| B | 18834 | 7209 | 38.276521% |
| C | 18834 | 5485 | 29.122863% |
| D | 18834 | 1818 | 9.652756% |
Noise dominated data is calculated using 1-second bins in cleaned event files. If a bin has >2000 counts, and if more than 50% of those come from <1% of pixels, then it is considered to be noise-dominated and hence unusable.
| Quadrant | # 1 sec bins | Bins with >0 counts | Bins with >2000 counts | High rate bins dominated by noise | Noise dominated (total time) | Noise dominated (detector-on time) | Marked lightcurve |
|---|---|---|---|---|---|---|---|
| A | 19653 | 18835 | 521 | 521 | 2.65% | 2.77% | 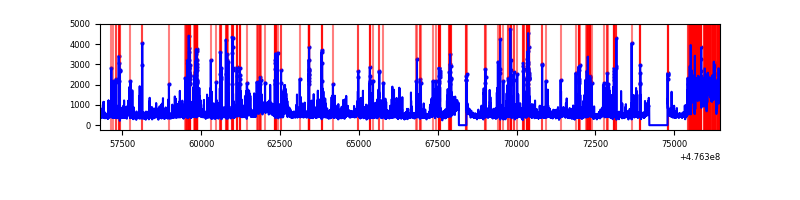 |
| B | 19654 | 18835 | 5045 | 5045 | 25.67% | 26.79% | 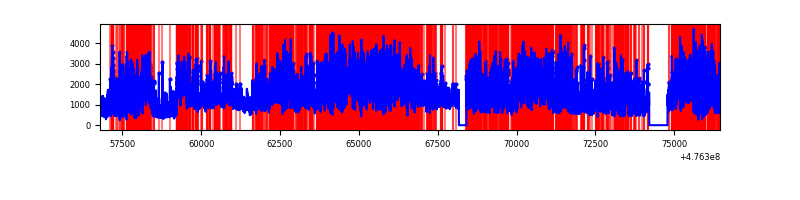 |
| C | 19654 | 18834 | 4518 | 4518 | 22.99% | 23.99% | 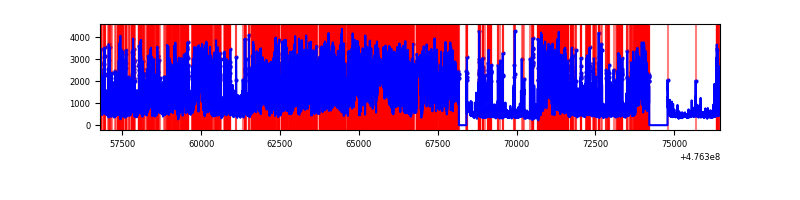 |
| D | 19654 | 18835 | 1321 | 1321 | 6.72% | 7.01% | 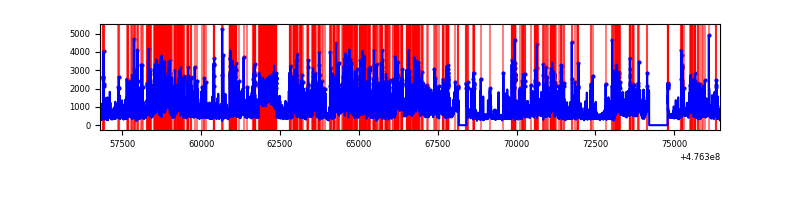 |
Top three noisy pixels from each quadrant. If the there are fewer than three noisy pixels in the level2.evt file, extra rows are filled as -1
| Pixel properties | Quadrant properties | ||||||
|---|---|---|---|---|---|---|---|
| Quadrant | DetID | PixID | Counts | Sigma | Mean | Median | Sigma |
| A | 12 | 80 | 1093513 | 2205.39 | 1984 | 1934 | 495.0 |
| A | 12 | 250 | 842336 | 1697.92 | 1984 | 1934 | 495.0 |
| A | 4 | 3 | 401797 | 807.87 | 1984 | 1934 | 495.0 |
| B | 4 | 170 | 11656254 | 31590.48 | 1718 | 1653 | 368.9 |
| B | 5 | 172 | 4450500 | 12058.86 | 1718 | 1653 | 368.9 |
| B | 5 | 32 | 2350464 | 6366.59 | 1718 | 1653 | 368.9 |
| C | 15 | 158 | 9753841 | 20189.89 | 1705 | 1692 | 483.0 |
| C | 13 | 235 | 1326906 | 2743.59 | 1705 | 1692 | 483.0 |
| C | 13 | 250 | 982247 | 2030.04 | 1705 | 1692 | 483.0 |
| D | 2 | 165 | 1760644 | 3411.06 | 1873 | 1812 | 515.6 |
| D | 14 | 67 | 1412699 | 2736.26 | 1873 | 1812 | 515.6 |
| D | 7 | 60 | 1331049 | 2577.91 | 1873 | 1812 | 515.6 |
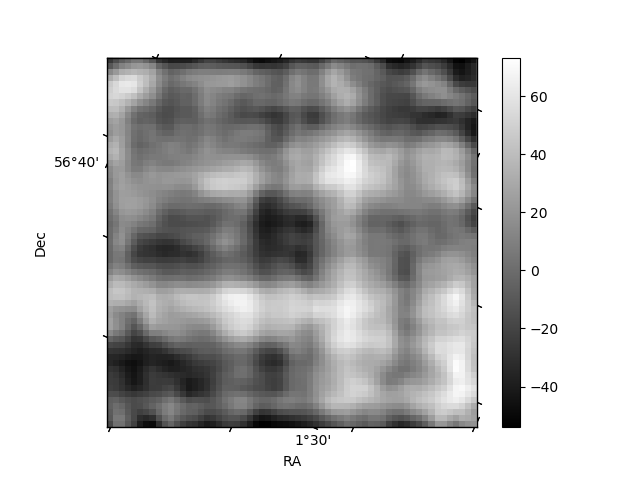
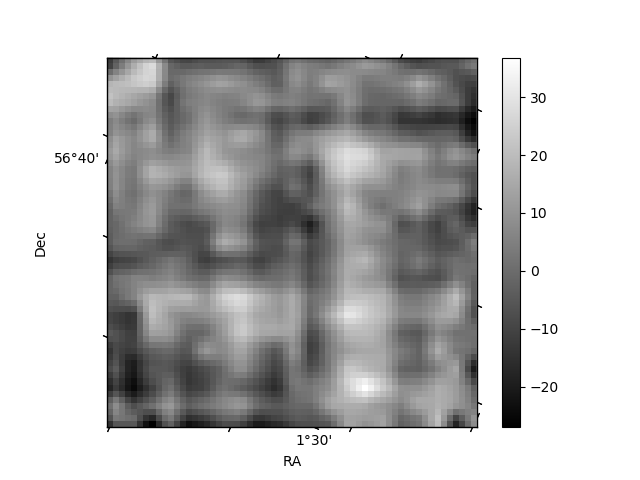
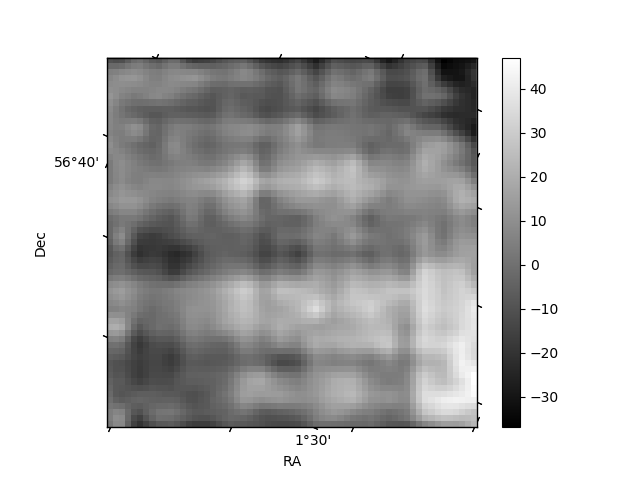
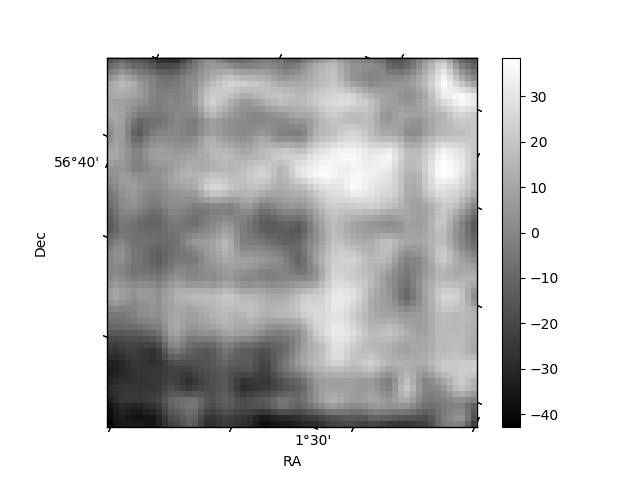
Histogram calculated using DETX and DETY for each event in the final _common_clean file
| Quadrant A | 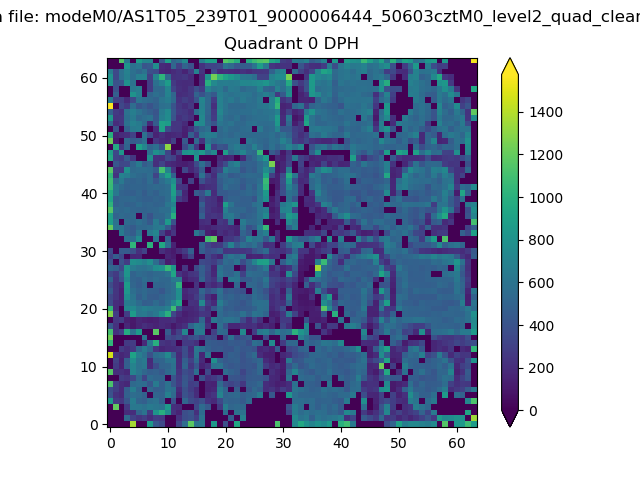 |
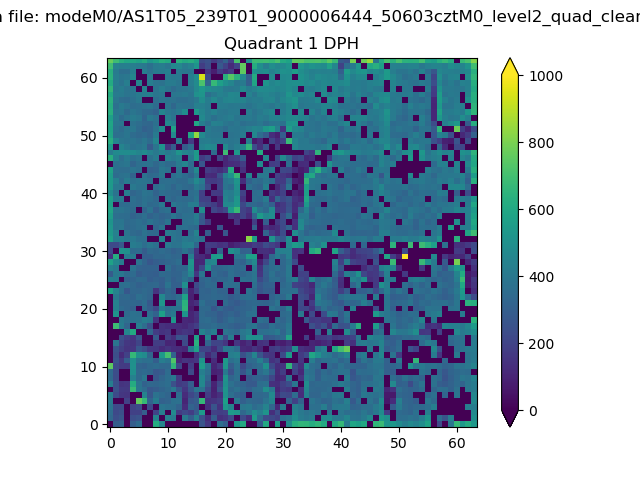 |
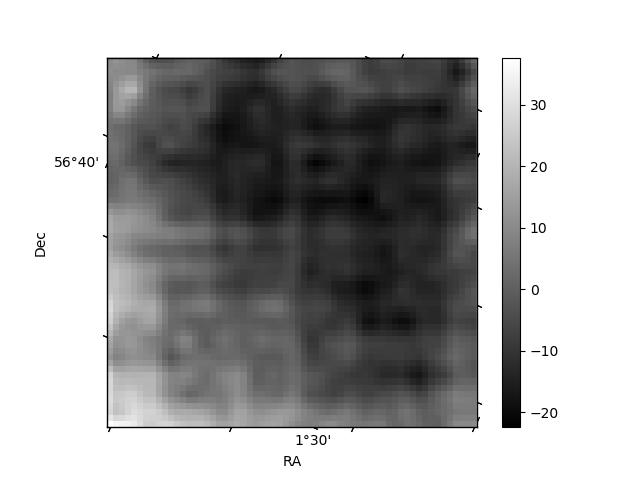
Quadrant B |
|---|---|---|---|
| Quadrant D | 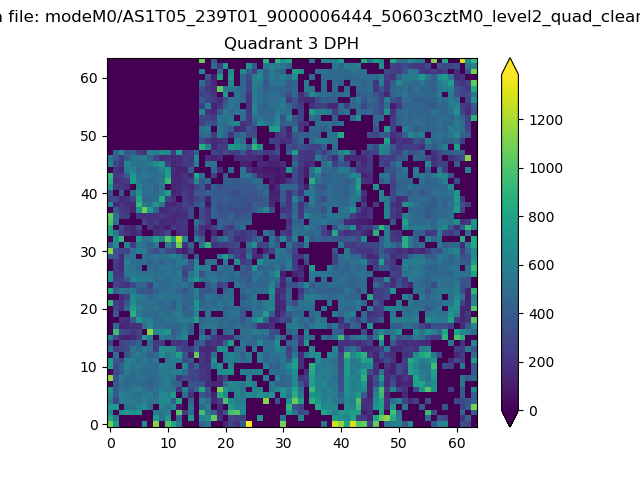 |
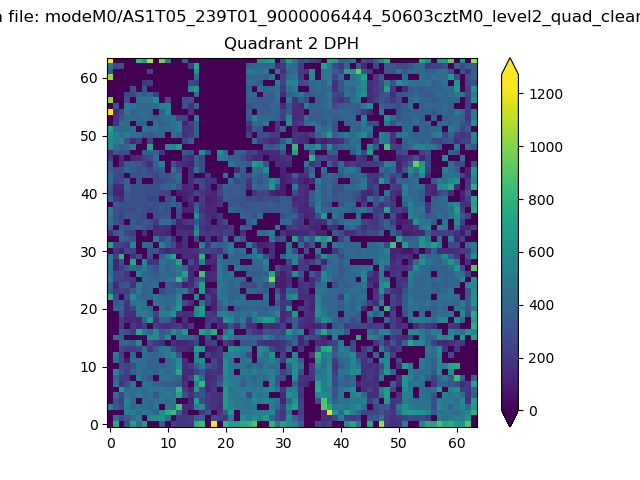 |
Quadrant C |
| Plot type | Count rate plots | Images |
|---|---|---|
| Comparison with Poisson distribution Blue bars denote a histogram of data divided into 1 sec bins. Red curve is a Poisson curve with rate = median count rate of data. |
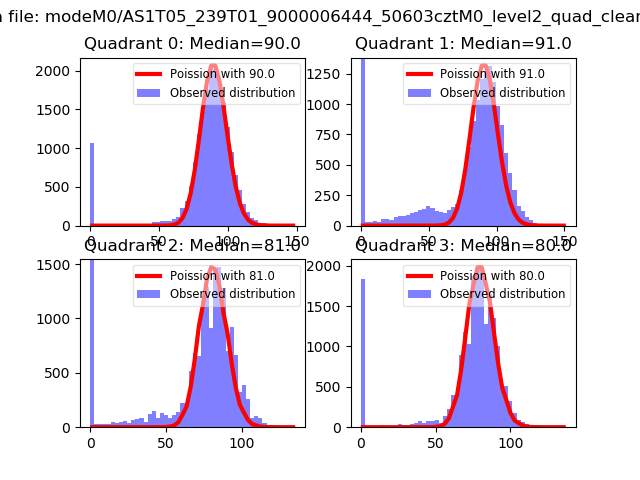 |
 |
| Quadrant-wise count rates Data is divided into 100 sec bins |
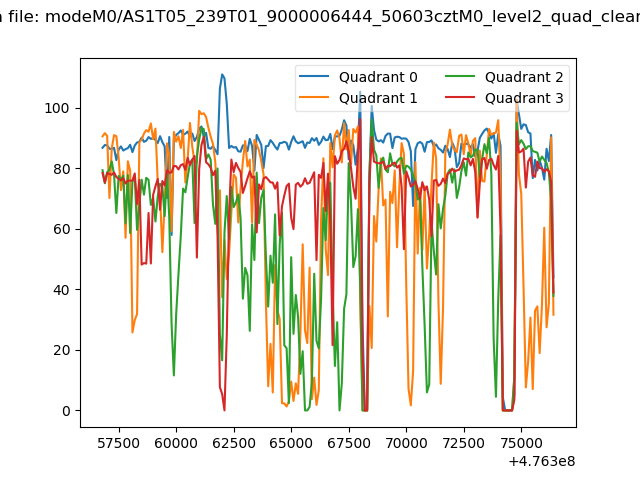 |
|
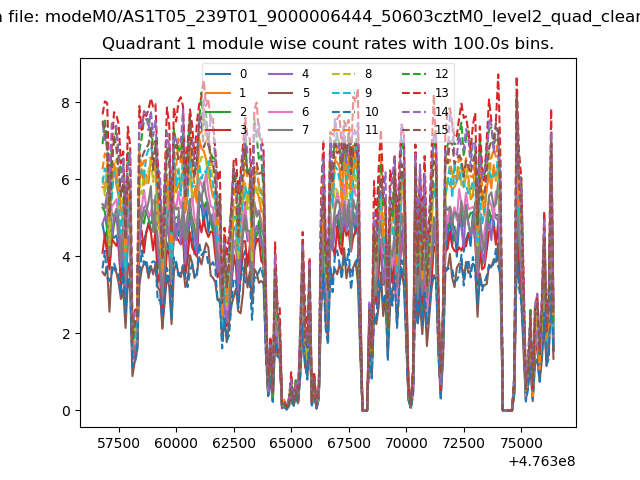
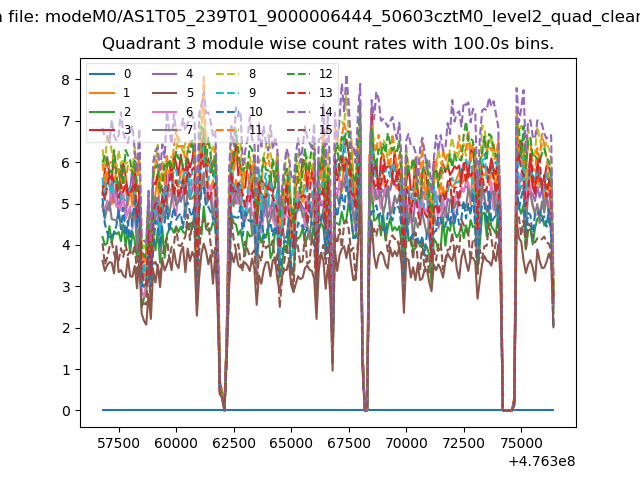
| Module-wise count rates for Quadrant A Data is divided into 100 sec bins |
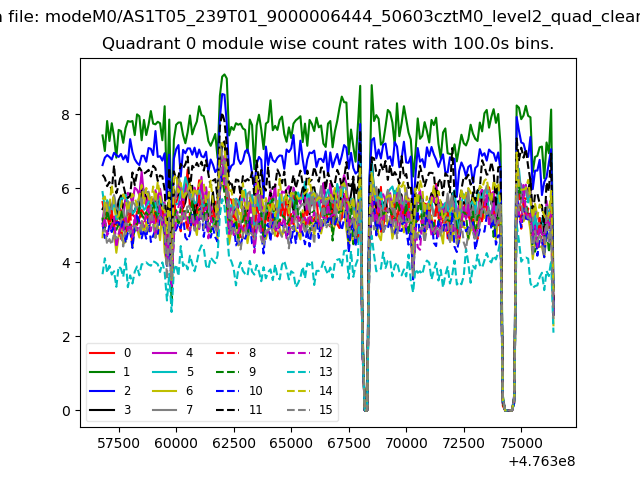 |
 |
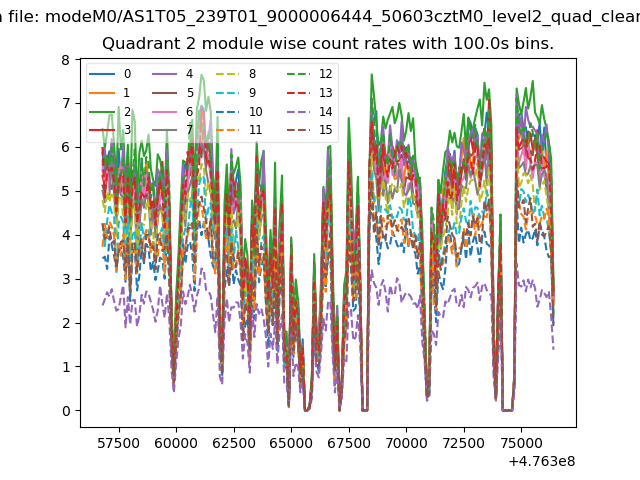
| Module-wise count rates for Quadrant B Data is divided into 100 sec bins |
 |
 |
| Module-wise count rates for Quadrant C Data is divided into 100 sec bins |
 |
 |
| Module-wise count rates for Quadrant D Data is divided into 100 sec bins |
 |
 |
| Parameter | Plot |
|---|---|
| CZT HV Monitor | 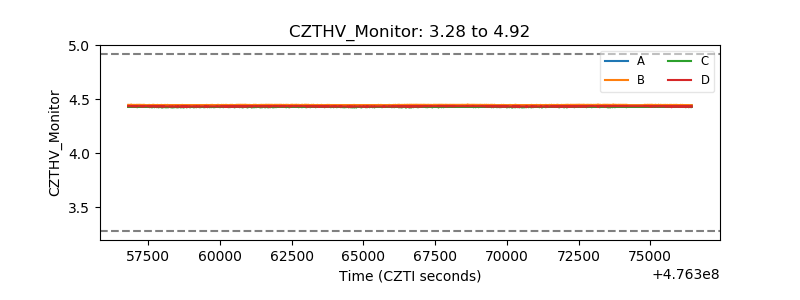 |
| D_VDD | 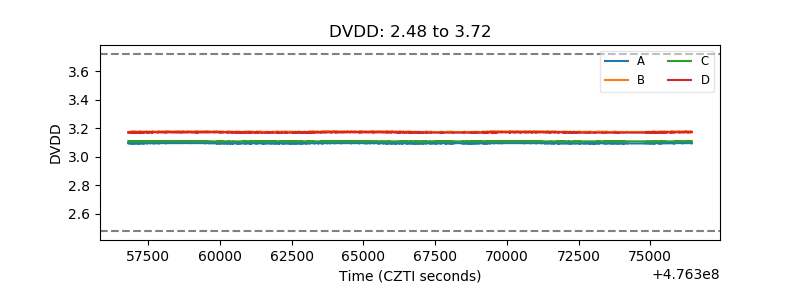 |
| Temperature 1 | 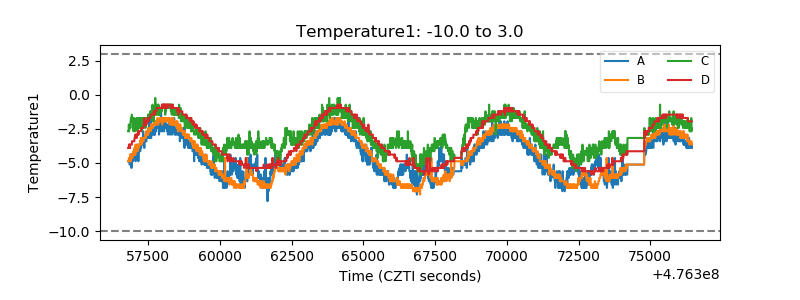 |
| Veto HV Monitor | 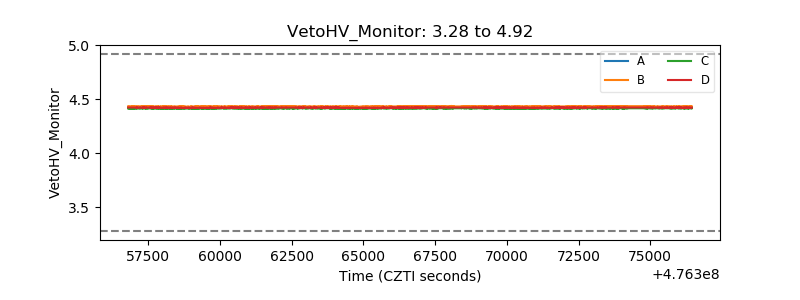 |
| Veto LLD | 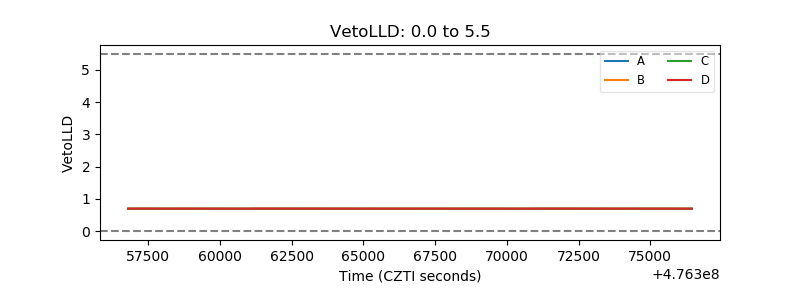 |
| Alpha Counter | 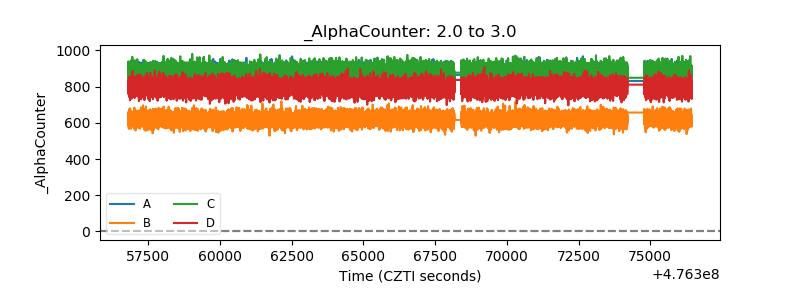 |
| _CPM_Rate | 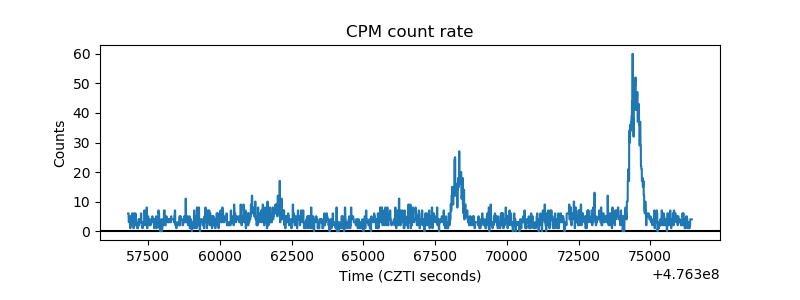 |
| CZT Counter | 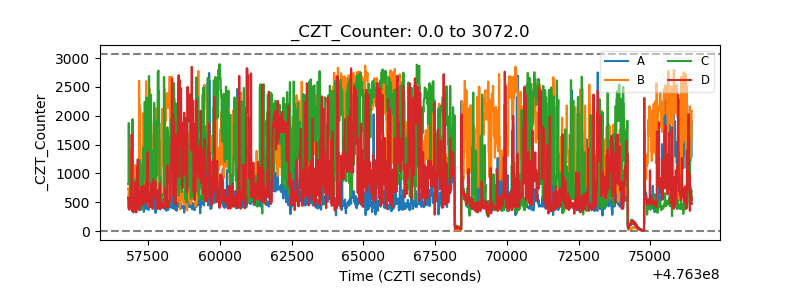 |
| +2.5 Volts monitor | 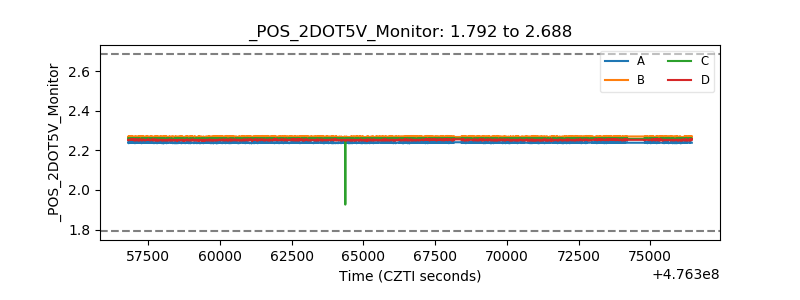 |
| +5 Volts monitor |  |
| _ROLL_ROT | 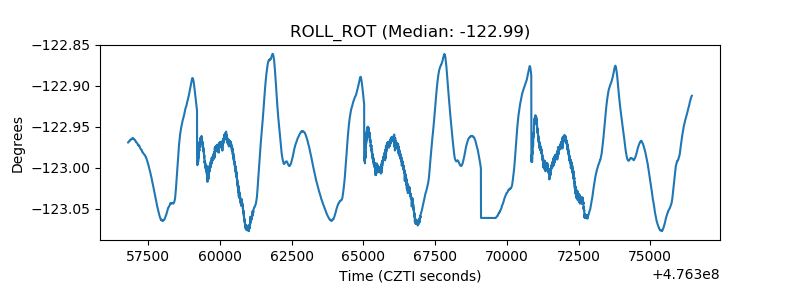 |
| _Roll_DEC | 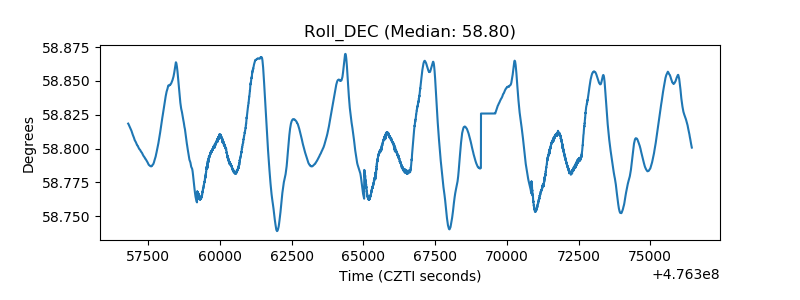 |
| _Roll_RA | 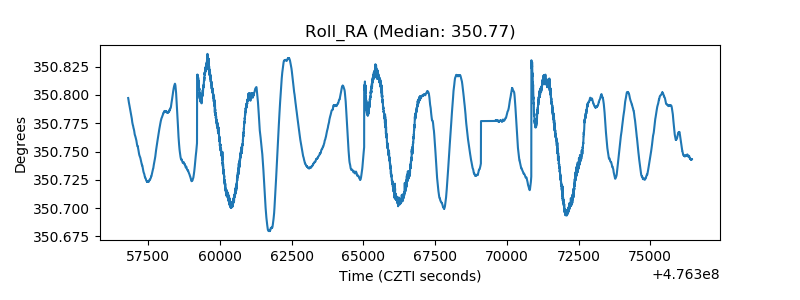 |
| Veto Counter | 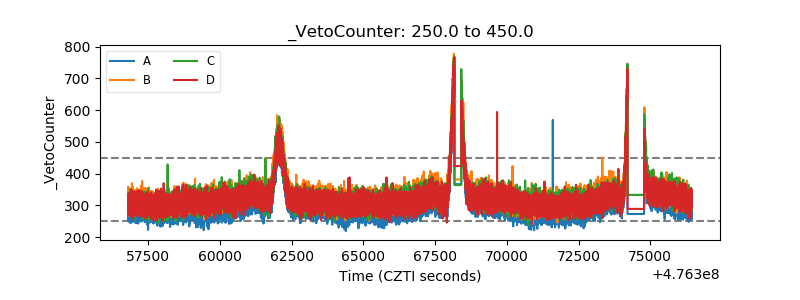 |