| Param | Original file | Final file |
|---|---|---|
| Filename | modeM0/AS1T05_239T01_9000006444_50604cztM0_level2.fits | modeM0/AS1T05_239T01_9000006444_50604cztM0_level2_quad_clean.evt |
| Size (bytes) | 726,140,160 | 83,016,000 |
| Size | 692.5 MB | 79.2 MB |
| Events in quadrant A | 5,971,744 | 562,971 |
| Events in quadrant B | 9,885,579 | 425,108 |
| Events in quadrant C | 5,481,116 | 542,604 |
| Events in quadrant D | 5,034,927 | 526,739 |
| Mode M0 | |||
|---|---|---|---|
| Quadrant | BADHDUFLAG | Total packets | Discarded packets |
| A | 0 | 22221 | 1 |
| B | 0 | 33915 | 4 |
| C | 0 | 20825 | 1 |
| D | 0 | 19506 | 1 |
| Mode M9 | |||
|---|---|---|---|
| Quadrant | BADHDUFLAG | Total packets | Discarded packets |
| A | 0 | 8 | 0 |
| B | 0 | 8 | 0 |
| C | 0 | 8 | 0 |
| D | 0 | 8 | 0 |
| Mode SS | |||
|---|---|---|---|
| Quadrant | BADHDUFLAG | Total packets | Discarded packets |
| A | 0 | 132 | 0 |
| B | 0 | 132 | 0 |
| C | 0 | 132 | 0 |
| D | 0 | 132 | 0 |
| Quadrant | Total seconds | Saturated seconds | Saturation percentage |
|---|---|---|---|
| A | 6538 | 614 | 9.391251% |
| B | 6537 | 2562 | 39.192290% |
| C | 6537 | 577 | 8.826679% |
| D | 6538 | 344 | 5.261548% |
Noise dominated data is calculated using 1-second bins in cleaned event files. If a bin has >2000 counts, and if more than 50% of those come from <1% of pixels, then it is considered to be noise-dominated and hence unusable.
| Quadrant | # 1 sec bins | Bins with >0 counts | Bins with >2000 counts | High rate bins dominated by noise | Noise dominated (total time) | Noise dominated (detector-on time) | Marked lightcurve |
|---|---|---|---|---|---|---|---|
| A | 7343 | 6539 | 606 | 606 | 8.25% | 9.27% | 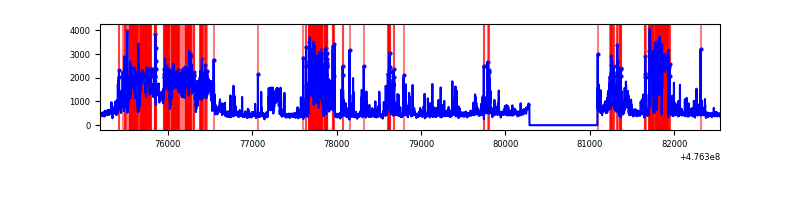 |
| B | 7341 | 6537 | 2020 | 2020 | 27.52% | 30.90% | 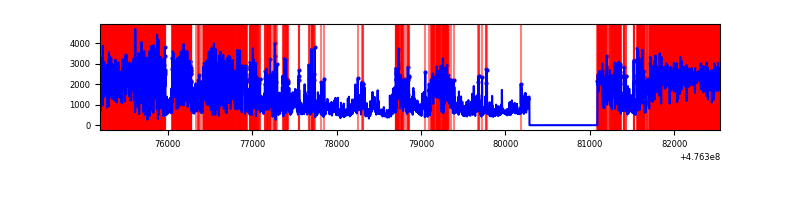 |
| C | 7342 | 6538 | 473 | 473 | 6.44% | 7.23% | 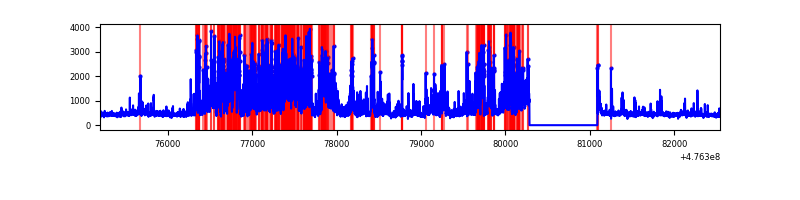 |
| D | 7343 | 6539 | 284 | 284 | 3.87% | 4.34% | 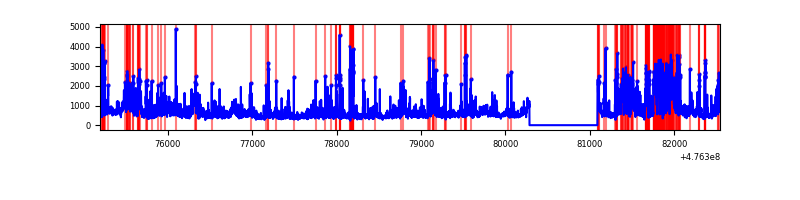 |
Top three noisy pixels from each quadrant. If the there are fewer than three noisy pixels in the level2.evt file, extra rows are filled as -1
| Pixel properties | Quadrant properties | ||||||
|---|---|---|---|---|---|---|---|
| Quadrant | DetID | PixID | Counts | Sigma | Mean | Median | Sigma |
| A | 12 | 80 | 1402540 | 8626.99 | 654 | 638 | 162.5 |
| A | 12 | 250 | 541074 | 3325.72 | 654 | 638 | 162.5 |
| A | 10 | 251 | 519557 | 3193.31 | 654 | 638 | 162.5 |
| B | 4 | 170 | 5592966 | 45642.1 | 576 | 556 | 122.5 |
| B | 5 | 172 | 1232579 | 10055.08 | 576 | 556 | 122.5 |
| B | 5 | 32 | 152423 | 1239.45 | 576 | 556 | 122.5 |
| C | 15 | 158 | 2440142 | 13395.44 | 649 | 644 | 182.1 |
| C | 1 | 3 | 89051 | 485.45 | 649 | 644 | 182.1 |
| C | 0 | 208 | 66166 | 359.79 | 649 | 644 | 182.1 |
| D | 2 | 165 | 418819 | 2354.51 | 647 | 627 | 177.6 |
| D | 2 | 226 | 359812 | 2022.29 | 647 | 627 | 177.6 |
| D | 2 | 249 | 272861 | 1532.74 | 647 | 627 | 177.6 |
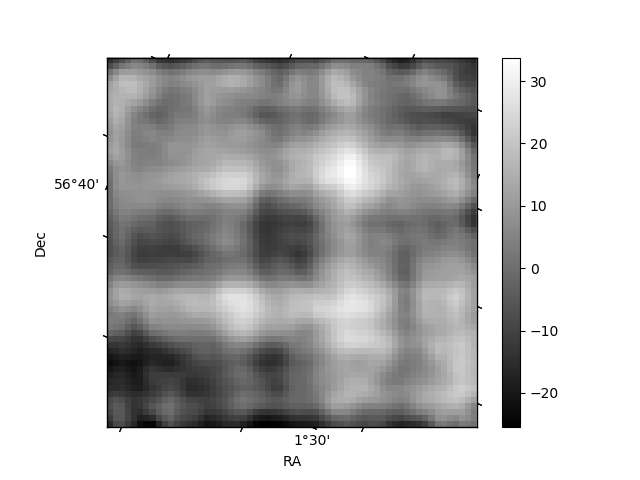
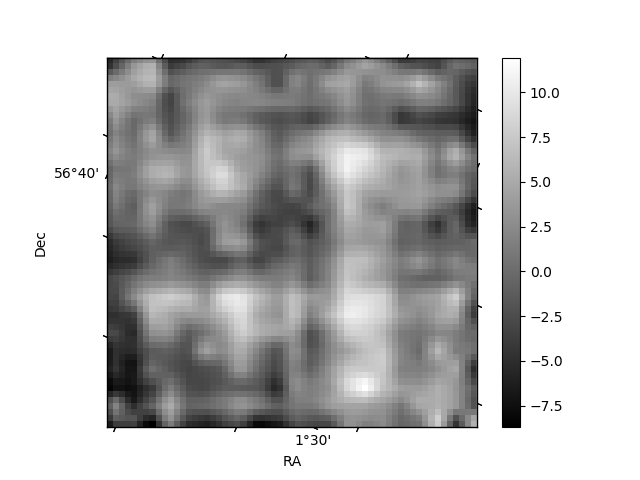
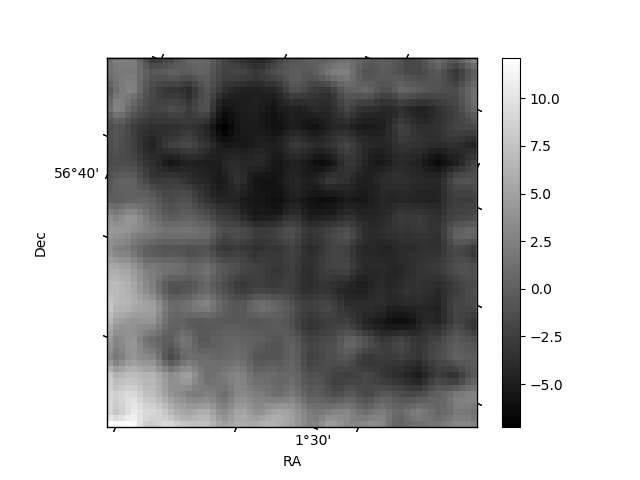
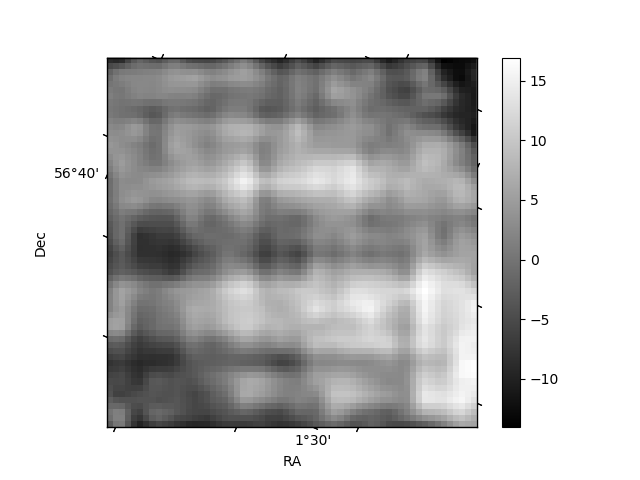
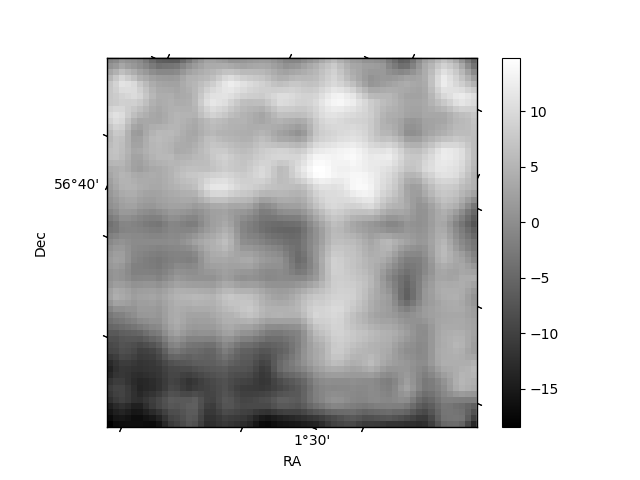
Histogram calculated using DETX and DETY for each event in the final _common_clean file
| Quadrant A | 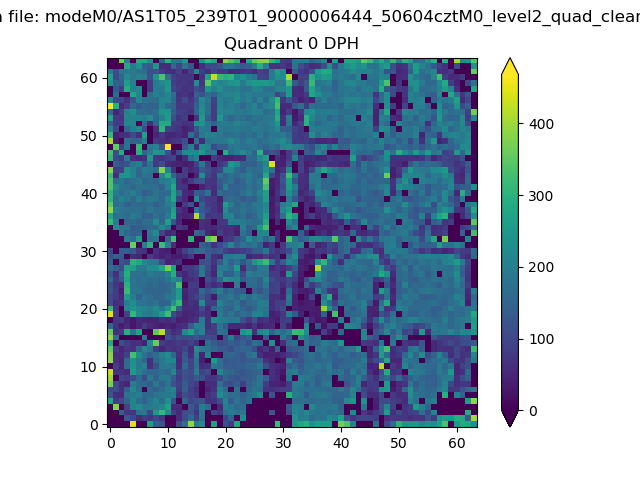 |
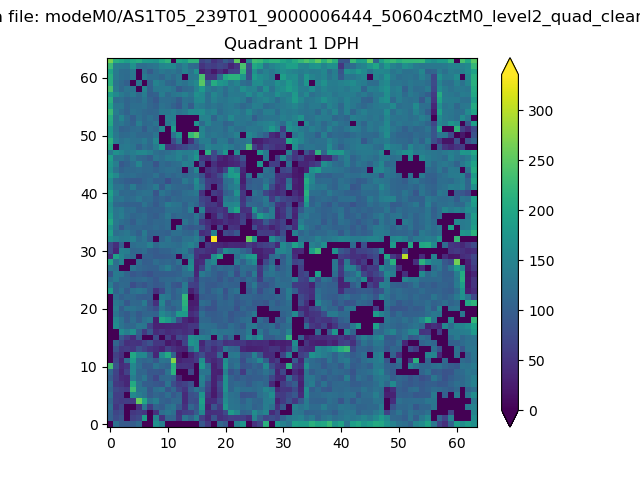 |
Quadrant B |
|---|---|---|---|
| Quadrant D | 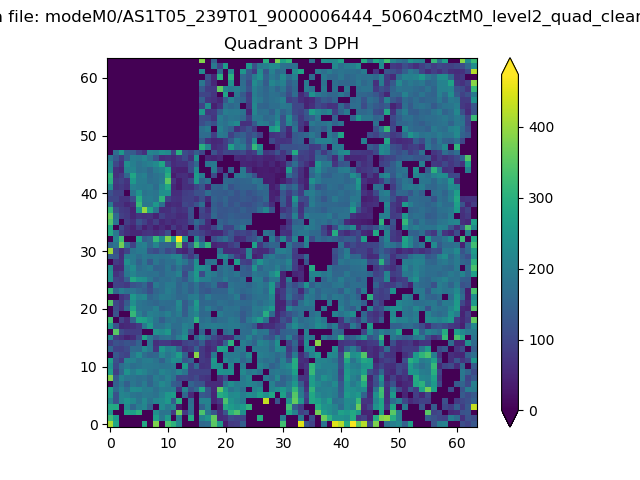 |
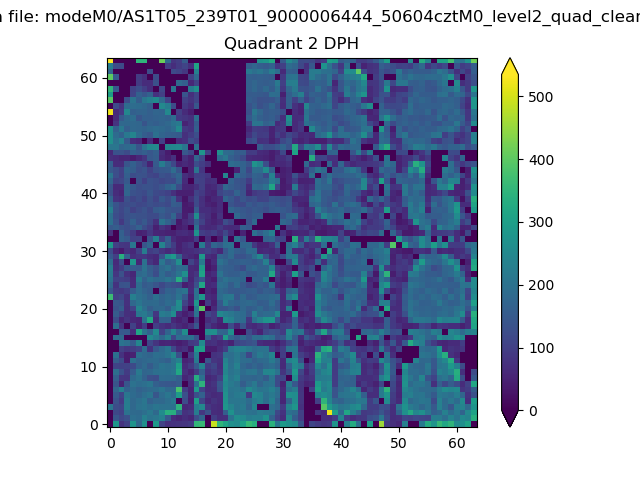 |
Quadrant C |
| Plot type | Count rate plots | Images |
|---|---|---|
| Comparison with Poisson distribution Blue bars denote a histogram of data divided into 1 sec bins. Red curve is a Poisson curve with rate = median count rate of data. |
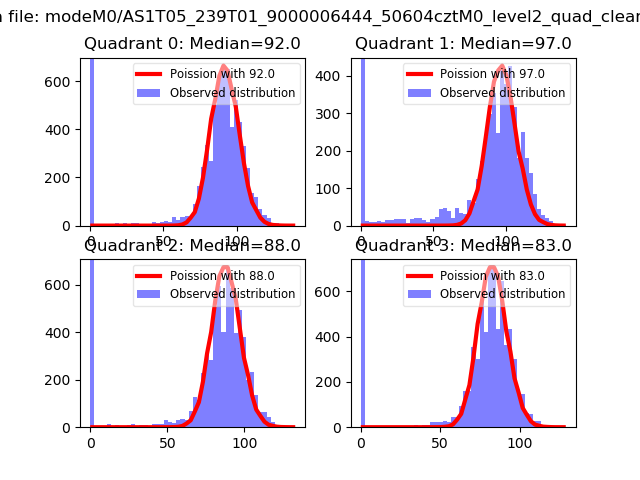 |
 |
| Quadrant-wise count rates Data is divided into 100 sec bins |
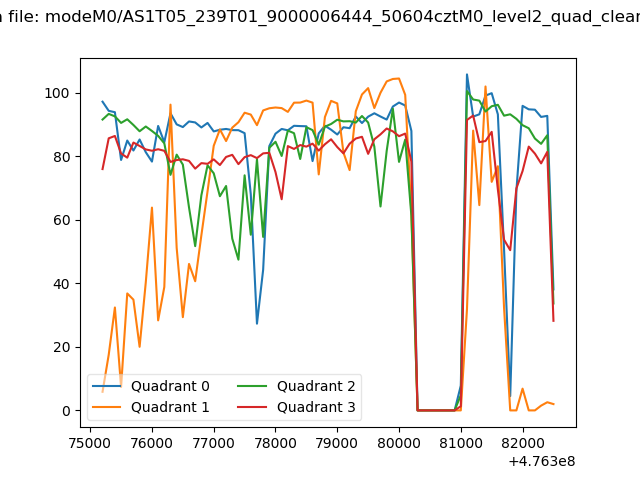 |
|
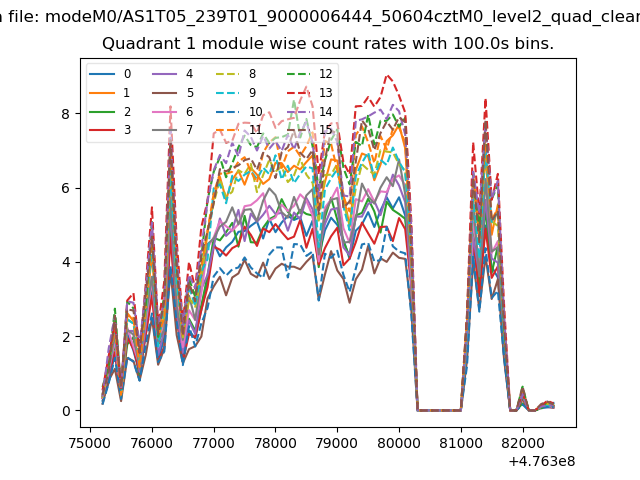
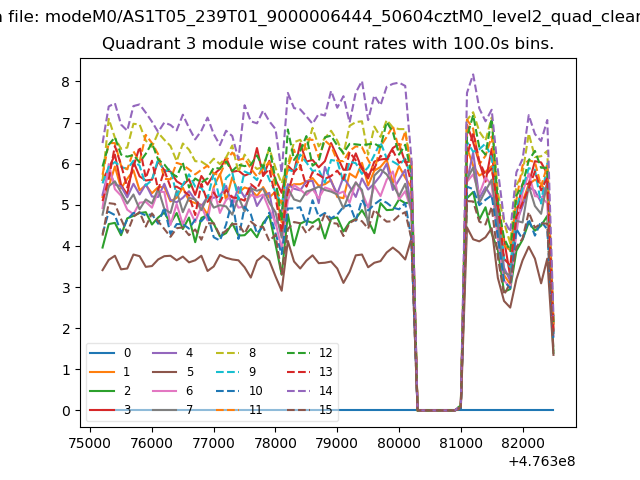
| Module-wise count rates for Quadrant A Data is divided into 100 sec bins |
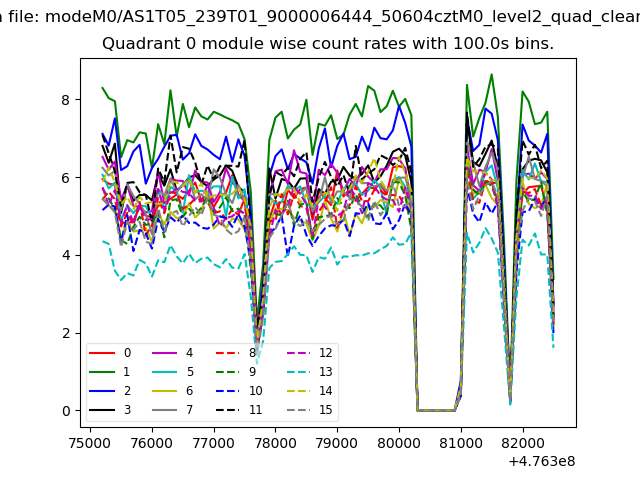 |
 |
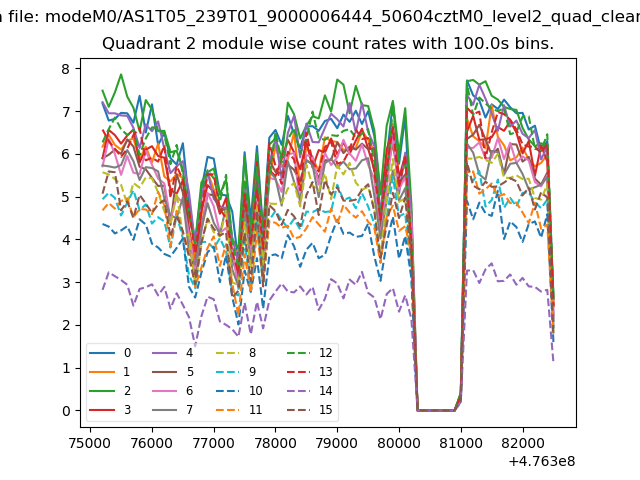
| Module-wise count rates for Quadrant B Data is divided into 100 sec bins |
 |
 |
| Module-wise count rates for Quadrant C Data is divided into 100 sec bins |
 |
 |
| Module-wise count rates for Quadrant D Data is divided into 100 sec bins |
 |
 |
| Parameter | Plot |
|---|---|
| CZT HV Monitor | 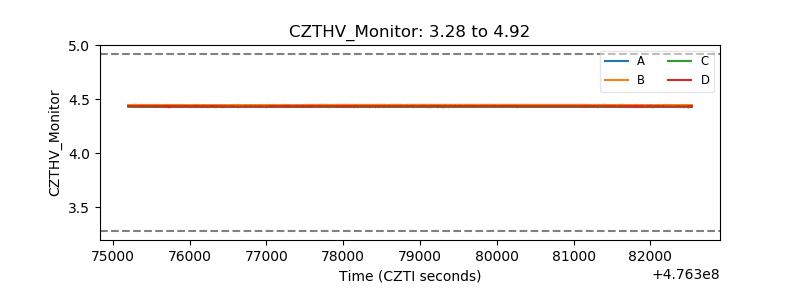 |
| D_VDD | 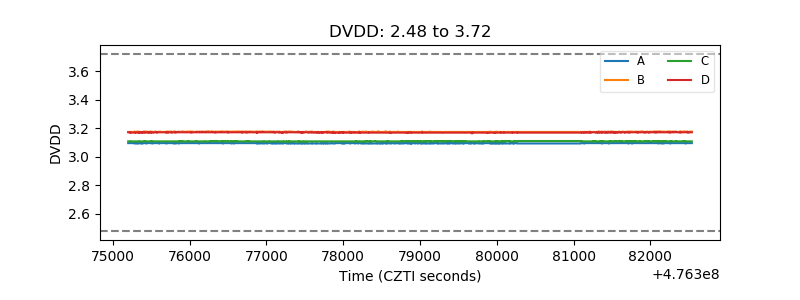 |
| Temperature 1 | 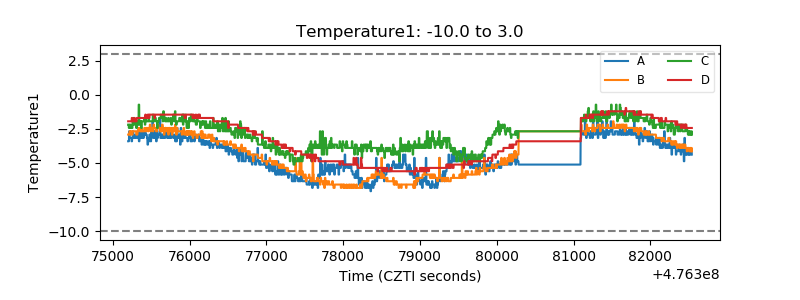 |
| Veto HV Monitor | 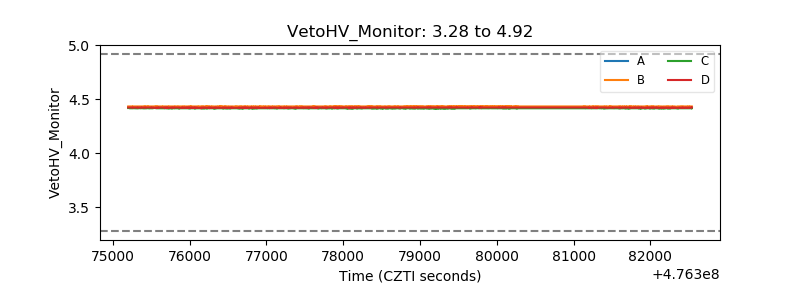 |
| Veto LLD | 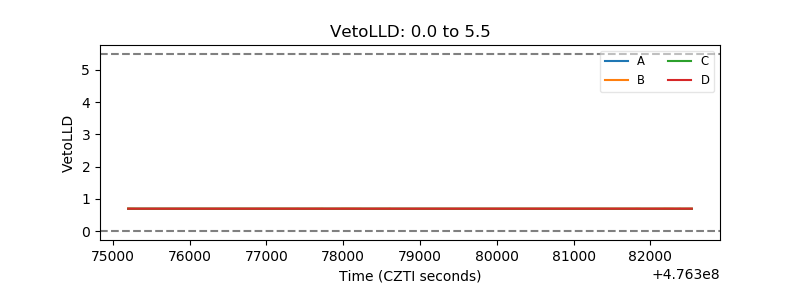 |
| Alpha Counter | 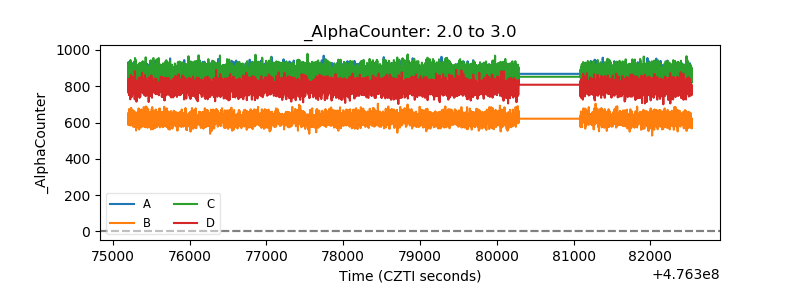 |
| _CPM_Rate | 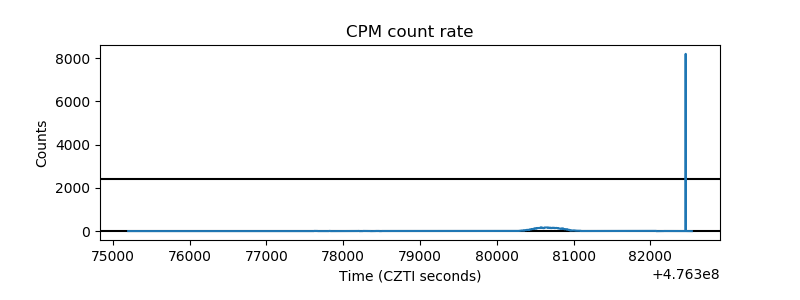 |
| CZT Counter | 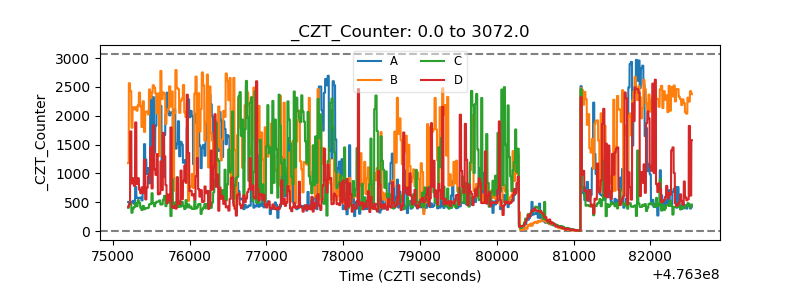 |
| +2.5 Volts monitor | 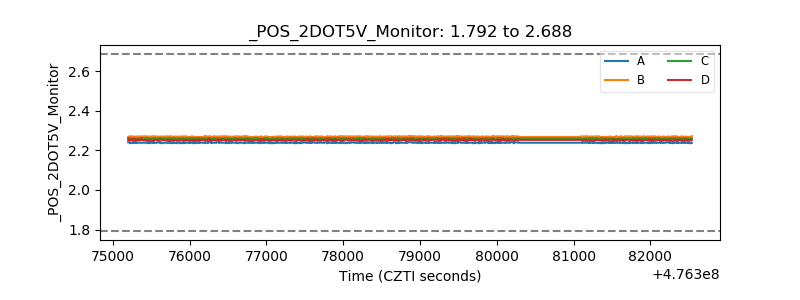 |
| +5 Volts monitor | 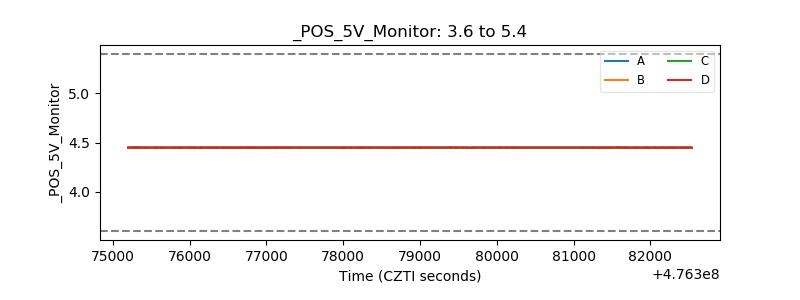 |
| _ROLL_ROT | 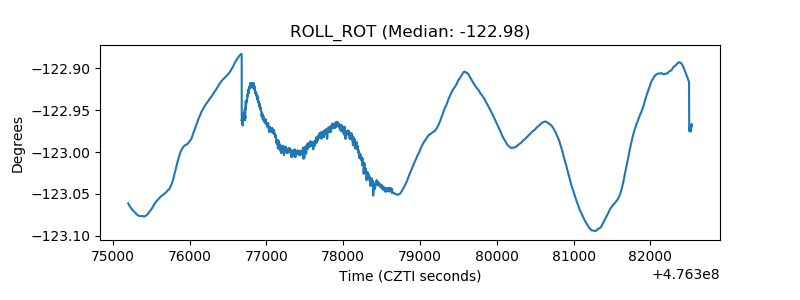 |
| _Roll_DEC | 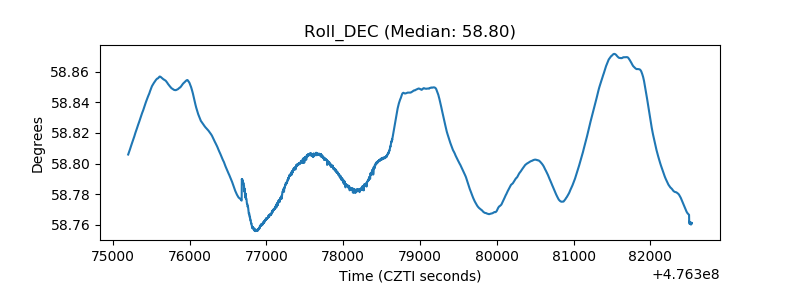 |
| _Roll_RA | 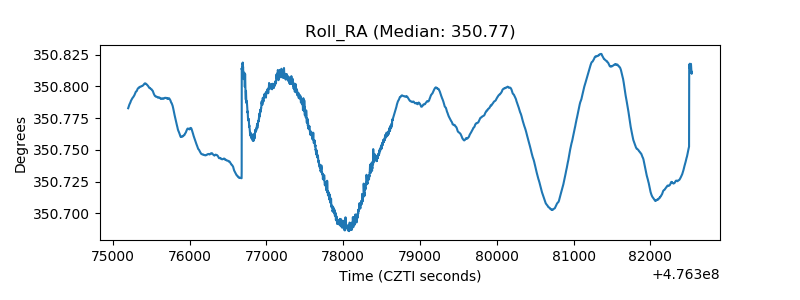 |
| Veto Counter | 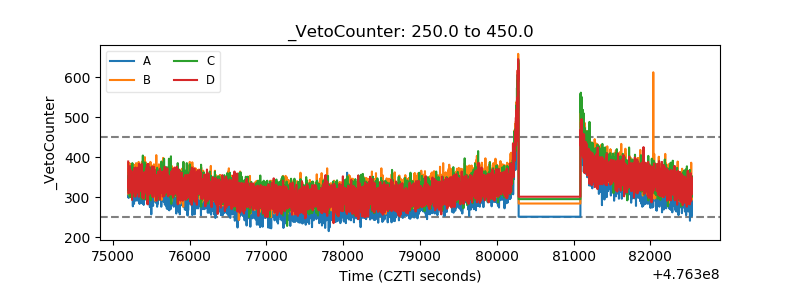 |