| Param | Original file | Final file |
|---|---|---|
| Filename | modeM0/AS1T05_239T01_9000006444_50607cztM0_level2.fits | modeM0/AS1T05_239T01_9000006444_50607cztM0_level2_quad_clean.evt |
| Size (bytes) | 835,850,880 | 67,697,280 |
| Size | 797.1 MB | 64.6 MB |
| Events in quadrant A | 3,929,904 | 573,826 |
| Events in quadrant B | 7,649,033 | 486,897 |
| Events in quadrant C | 4,639,244 | 527,093 |
| Events in quadrant D | 14,249,352 | 35,695 |
| Mode M0 | |||
|---|---|---|---|
| Quadrant | BADHDUFLAG | Total packets | Discarded packets |
| A | 0 | 15780 | 1 |
| B | 0 | 26901 | 2 |
| C | 0 | 18041 | 1 |
| D | 0 | 46459 | 1 |
| Mode M9 | |||
|---|---|---|---|
| Quadrant | BADHDUFLAG | Total packets | Discarded packets |
| A | 0 | 11 | 0 |
| B | 0 | 11 | 0 |
| C | 0 | 11 | 0 |
| D | 0 | 11 | 0 |
| Mode SS | |||
|---|---|---|---|
| Quadrant | BADHDUFLAG | Total packets | Discarded packets |
| A | 0 | 124 | 0 |
| B | 0 | 124 | 0 |
| C | 0 | 124 | 0 |
| D | 0 | 124 | 0 |
| Quadrant | Total seconds | Saturated seconds | Saturation percentage |
|---|---|---|---|
| A | 6099 | 102 | 1.672405% |
| B | 6099 | 1575 | 25.823906% |
| C | 6099 | 478 | 7.837350% |
| D | 6099 | 5779 | 94.753238% |
Noise dominated data is calculated using 1-second bins in cleaned event files. If a bin has >2000 counts, and if more than 50% of those come from <1% of pixels, then it is considered to be noise-dominated and hence unusable.
| Quadrant | # 1 sec bins | Bins with >0 counts | Bins with >2000 counts | High rate bins dominated by noise | Noise dominated (total time) | Noise dominated (detector-on time) | Marked lightcurve |
|---|---|---|---|---|---|---|---|
| A | 7204 | 6100 | 89 | 89 | 1.24% | 1.46% | 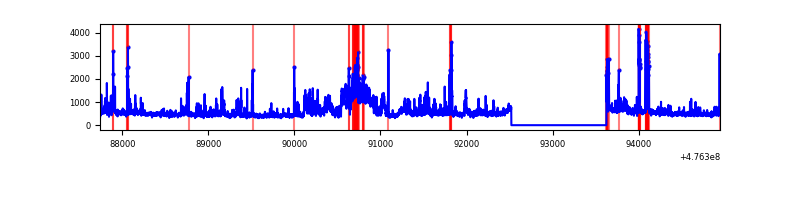 |
| B | 7204 | 6099 | 1239 | 1239 | 17.20% | 20.31% | 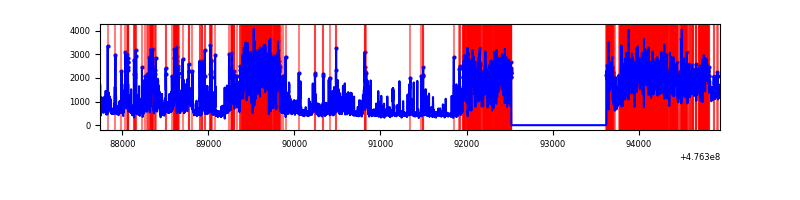 |
| C | 7204 | 6100 | 446 | 446 | 6.19% | 7.31% | 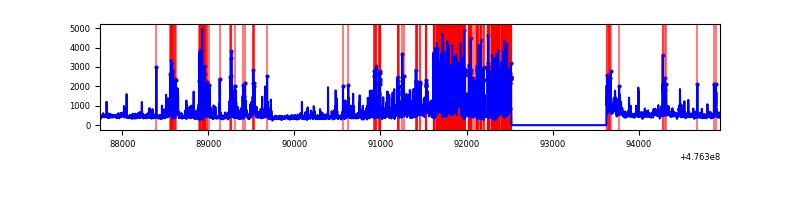 |
| D | 7204 | 6099 | 5458 | 5458 | 75.76% | 89.49% | 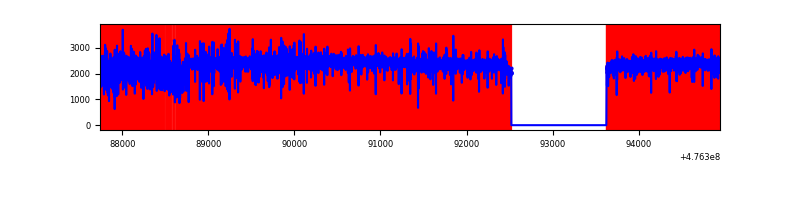 |
Top three noisy pixels from each quadrant. If the there are fewer than three noisy pixels in the level2.evt file, extra rows are filled as -1
| Pixel properties | Quadrant properties | ||||||
|---|---|---|---|---|---|---|---|
| Quadrant | DetID | PixID | Counts | Sigma | Mean | Median | Sigma |
| A | 9 | 96 | 480709 | 3023.77 | 633 | 617 | 158.8 |
| A | 7 | 204 | 224505 | 1410.12 | 633 | 617 | 158.8 |
| A | 4 | 3 | 157341 | 987.1 | 633 | 617 | 158.8 |
| B | 4 | 170 | 2966725 | 24069.81 | 580 | 560 | 123.2 |
| B | 3 | 249 | 691293 | 5605.15 | 580 | 560 | 123.2 |
| B | 5 | 32 | 592289 | 4801.75 | 580 | 560 | 123.2 |
| C | 15 | 1 | 862227 | 5221.98 | 604 | 600 | 165.0 |
| C | 15 | 158 | 393832 | 2383.22 | 604 | 600 | 165.0 |
| C | 14 | 247 | 301738 | 1825.08 | 604 | 600 | 165.0 |
| D | 2 | 226 | 12362192 | 128228.19 | 338 | 326 | 96.4 |
| D | 2 | 249 | 131693 | 1362.65 | 338 | 326 | 96.4 |
| D | 7 | 96 | 75237 | 777.04 | 338 | 326 | 96.4 |
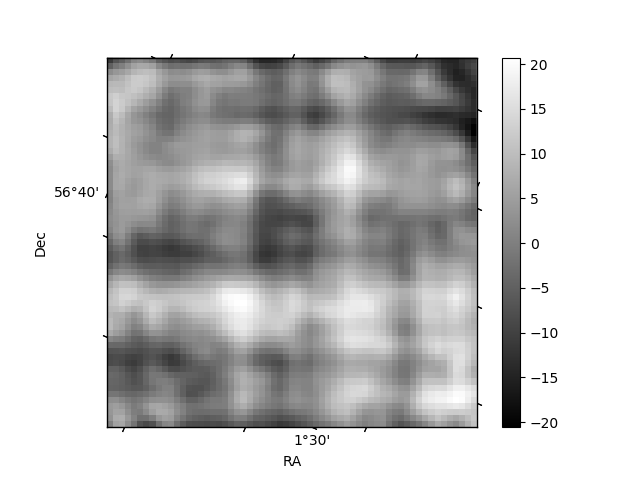
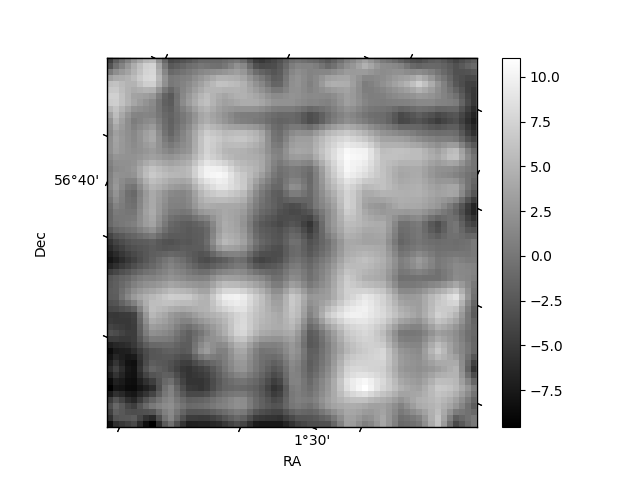
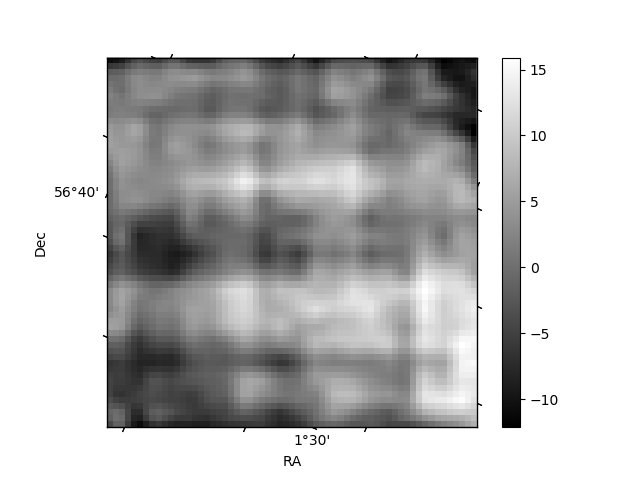
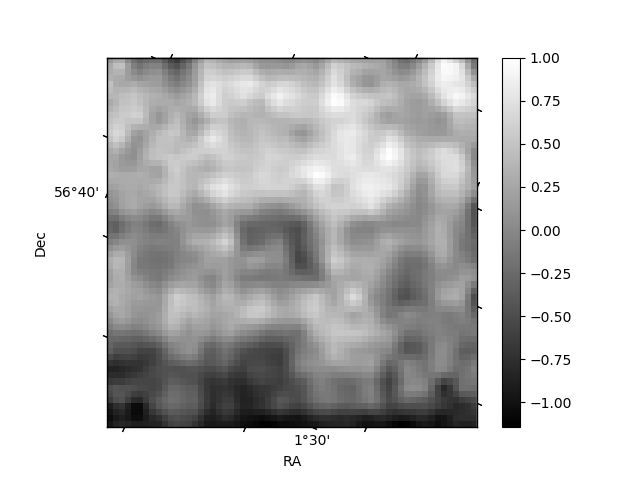
Histogram calculated using DETX and DETY for each event in the final _common_clean file
| Quadrant A | 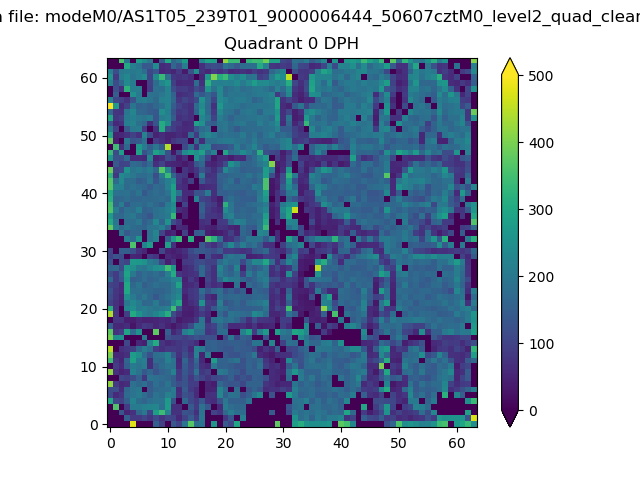 |
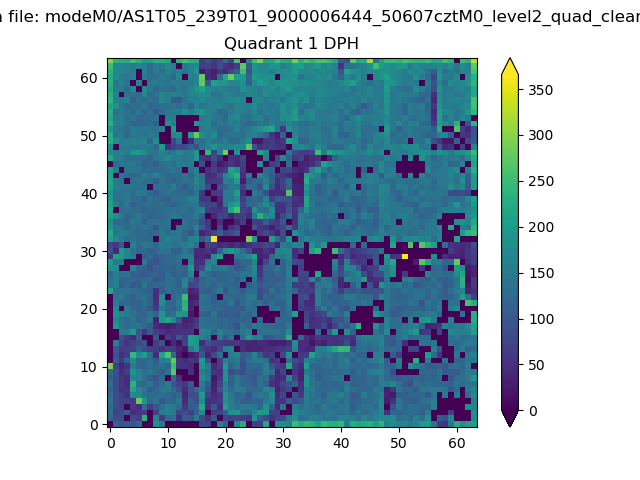 |
Quadrant B |
|---|---|---|---|
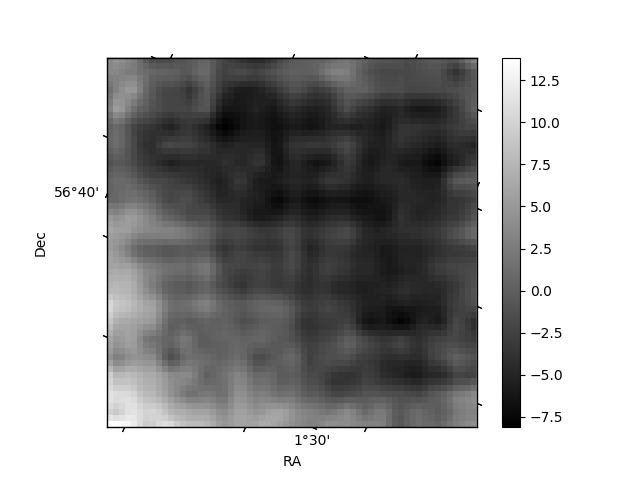
| Quadrant D | 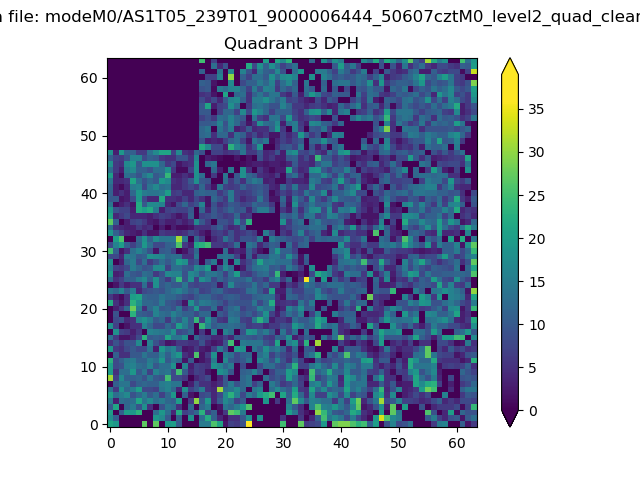 |
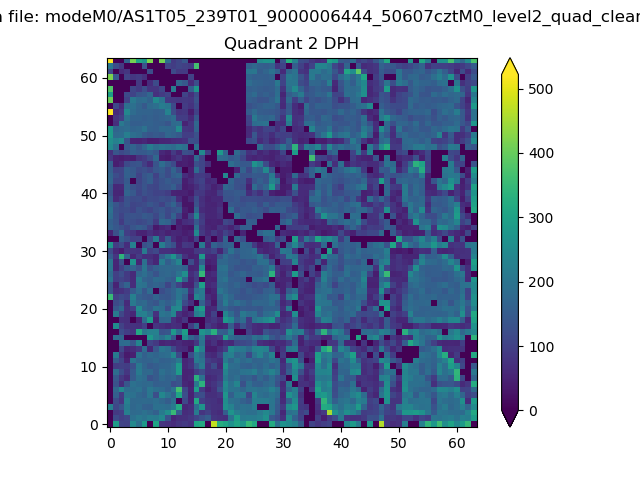 |
Quadrant C |
| Plot type | Count rate plots | Images |
|---|---|---|
| Comparison with Poisson distribution Blue bars denote a histogram of data divided into 1 sec bins. Red curve is a Poisson curve with rate = median count rate of data. |
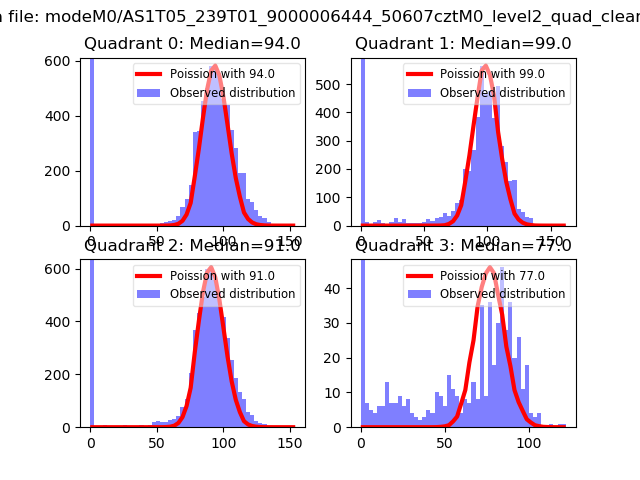 |
 |
| Quadrant-wise count rates Data is divided into 100 sec bins |
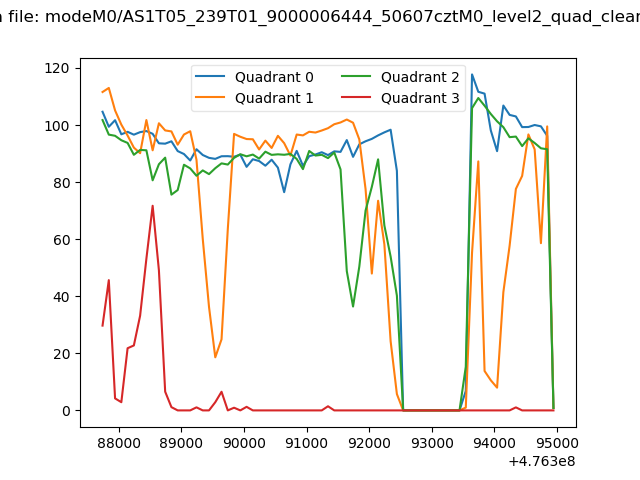 |
|
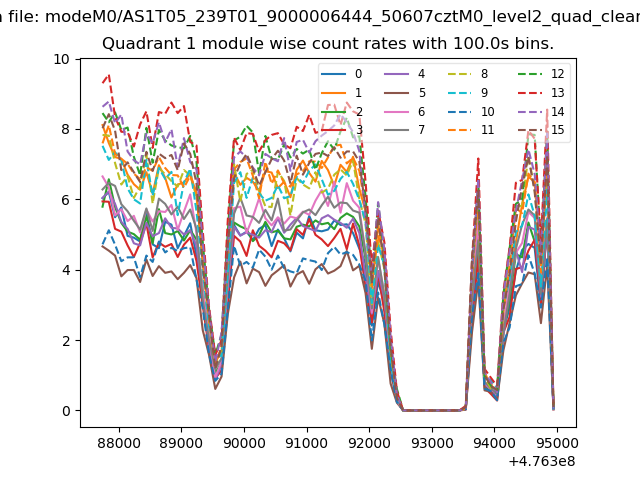
| Module-wise count rates for Quadrant A Data is divided into 100 sec bins |
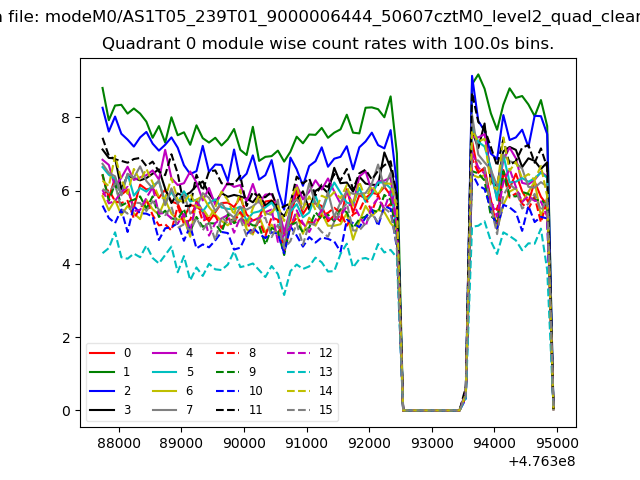 |
 |
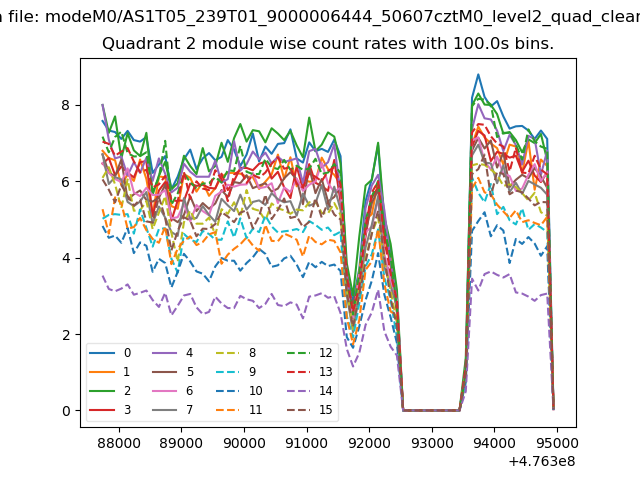
| Module-wise count rates for Quadrant B Data is divided into 100 sec bins |
 |
 |
| Module-wise count rates for Quadrant C Data is divided into 100 sec bins |
 |
 |
| Module-wise count rates for Quadrant D Data is divided into 100 sec bins |
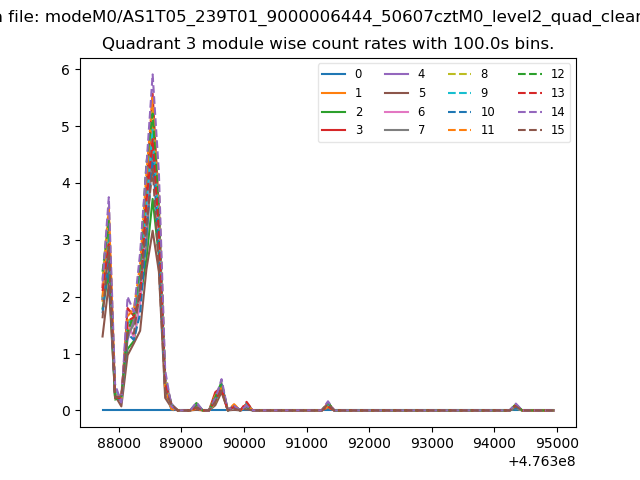 |
 |
| Parameter | Plot |
|---|---|
| CZT HV Monitor | 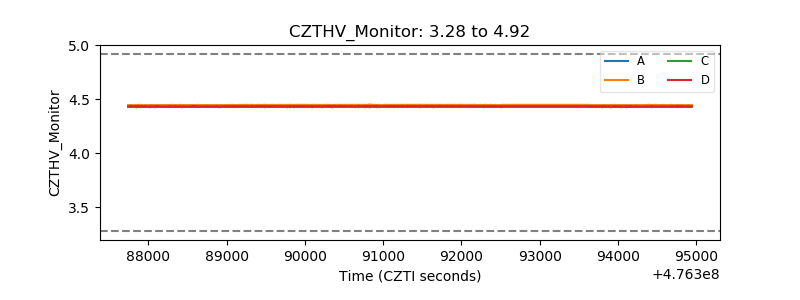 |
| D_VDD | 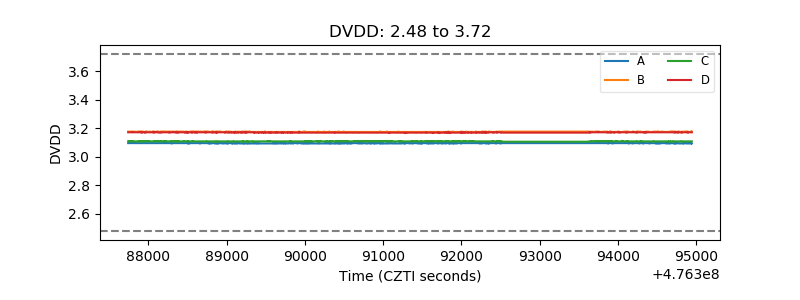 |
| Temperature 1 | 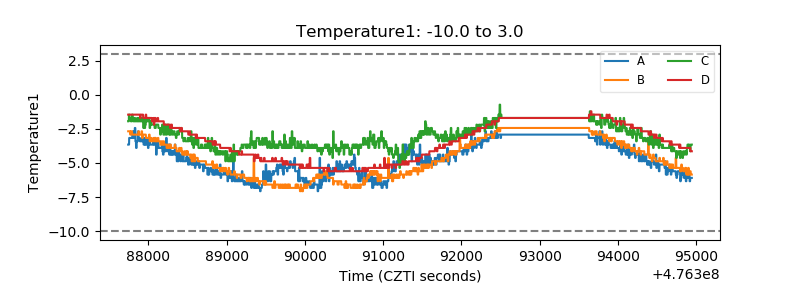 |
| Veto HV Monitor | 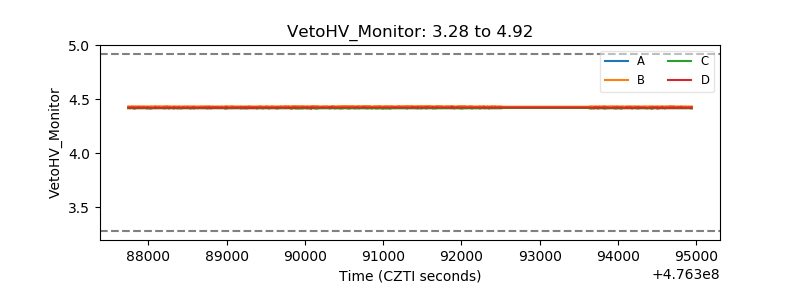 |
| Veto LLD | 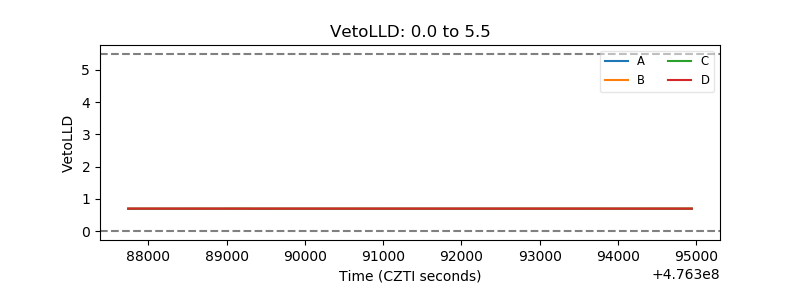 |
| Alpha Counter | 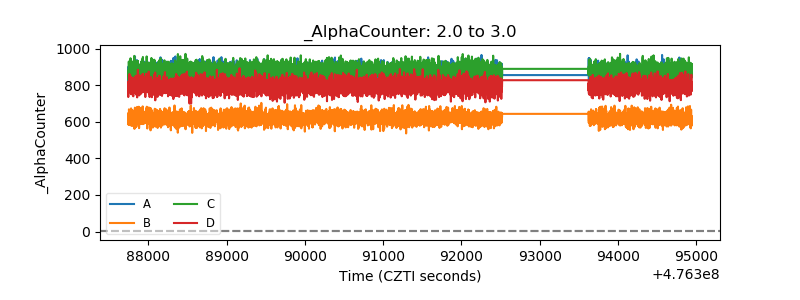 |
| _CPM_Rate | 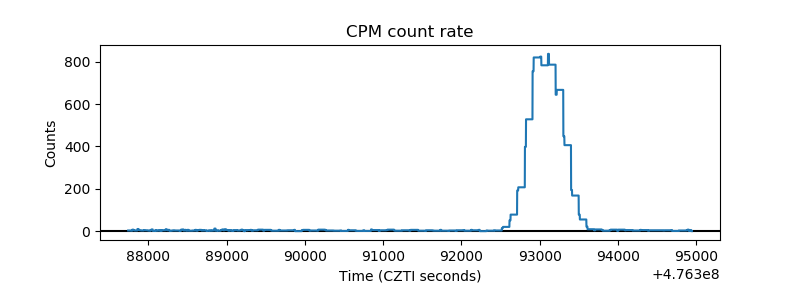 |
| CZT Counter | 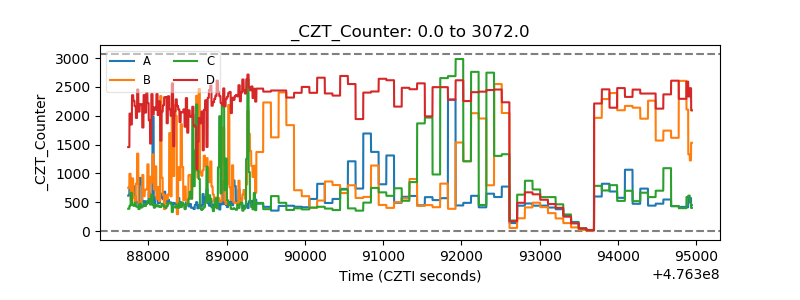 |
| +2.5 Volts monitor |  |
| +5 Volts monitor | 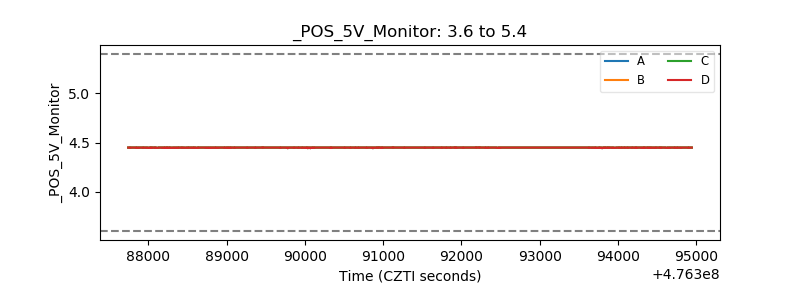 |
| _ROLL_ROT | 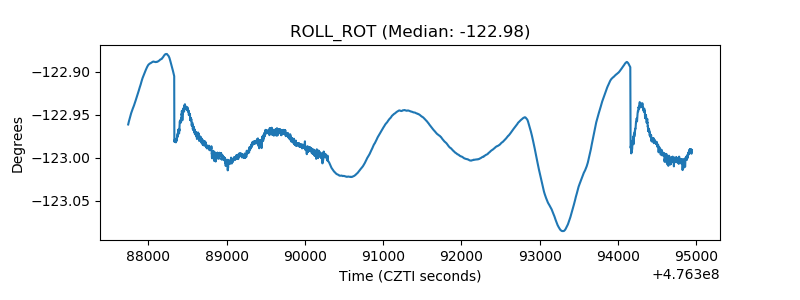 |
| _Roll_DEC | 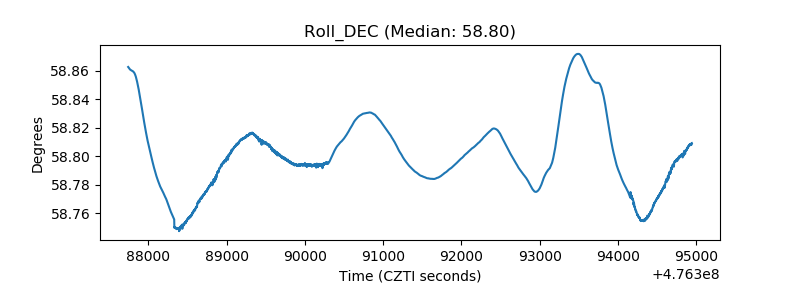 |
| _Roll_RA | 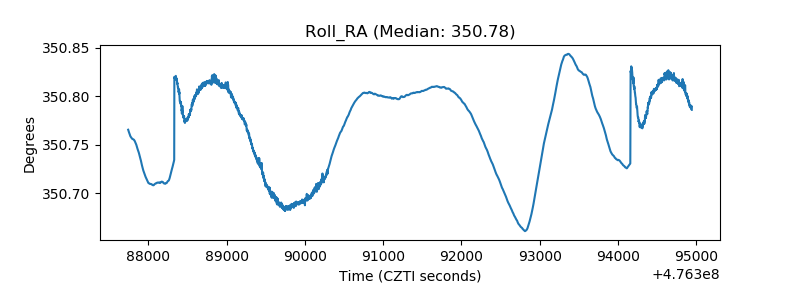 |
| Veto Counter | 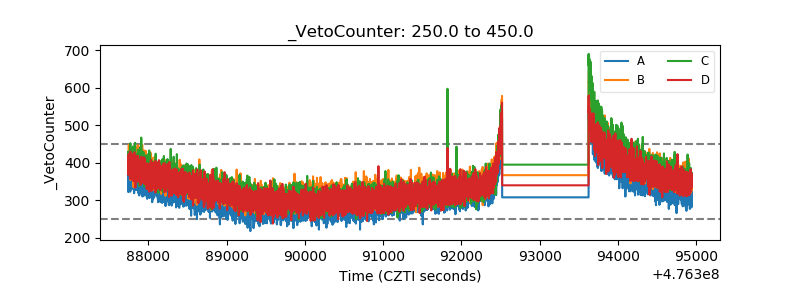 |