| Param | Original file | Final file |
|---|---|---|
| Filename | modeM0/AS1T05_239T01_9000006444_50608cztM0_level2.fits | modeM0/AS1T05_239T01_9000006444_50608cztM0_level2_quad_clean.evt |
| Size (bytes) | 845,095,680 | 75,142,080 |
| Size | 805.9 MB | 71.7 MB |
| Events in quadrant A | 4,661,365 | 574,681 |
| Events in quadrant B | 8,796,220 | 534,663 |
| Events in quadrant C | 4,313,872 | 556,074 |
| Events in quadrant D | 13,034,351 | 178,828 |
| Mode M0 | |||
|---|---|---|---|
| Quadrant | BADHDUFLAG | Total packets | Discarded packets |
| A | 0 | 17986 | 1 |
| B | 0 | 30449 | 1 |
| C | 0 | 16934 | 1 |
| D | 0 | 42993 | 3 |
| Mode M9 | |||
|---|---|---|---|
| Quadrant | BADHDUFLAG | Total packets | Discarded packets |
| A | 0 | 12 | 0 |
| B | 0 | 12 | 0 |
| C | 0 | 12 | 0 |
| D | 0 | 12 | 0 |
| Mode SS | |||
|---|---|---|---|
| Quadrant | BADHDUFLAG | Total packets | Discarded packets |
| A | 0 | 126 | 0 |
| B | 0 | 126 | 0 |
| C | 0 | 126 | 0 |
| D | 0 | 126 | 0 |
| Quadrant | Total seconds | Saturated seconds | Saturation percentage |
|---|---|---|---|
| A | 6164 | 342 | 5.548345% |
| B | 6165 | 1449 | 23.503650% |
| C | 6165 | 368 | 5.969181% |
| D | 6164 | 4604 | 74.691759% |
Noise dominated data is calculated using 1-second bins in cleaned event files. If a bin has >2000 counts, and if more than 50% of those come from <1% of pixels, then it is considered to be noise-dominated and hence unusable.
| Quadrant | # 1 sec bins | Bins with >0 counts | Bins with >2000 counts | High rate bins dominated by noise | Noise dominated (total time) | Noise dominated (detector-on time) | Marked lightcurve |
|---|---|---|---|---|---|---|---|
| A | 7349 | 6165 | 219 | 219 | 2.98% | 3.55% | 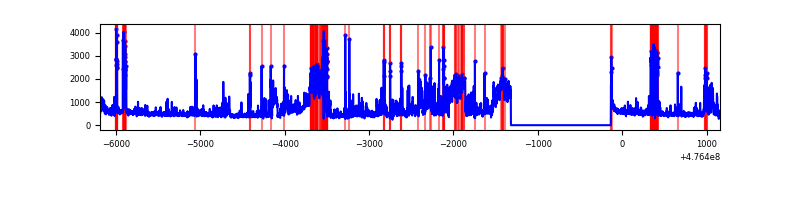 |
| B | 7350 | 6165 | 1059 | 1059 | 14.41% | 17.18% | 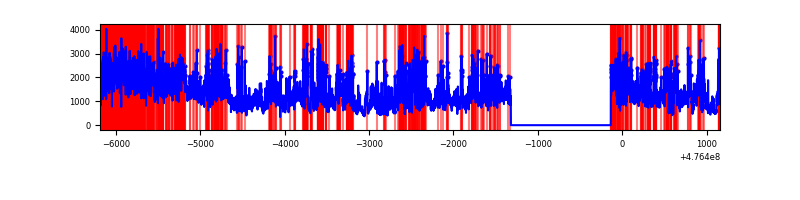 |
| C | 7350 | 6166 | 300 | 300 | 4.08% | 4.87% | 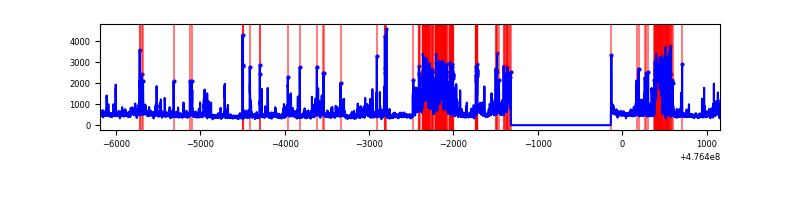 |
| D | 7349 | 6164 | 4065 | 4065 | 55.31% | 65.95% | 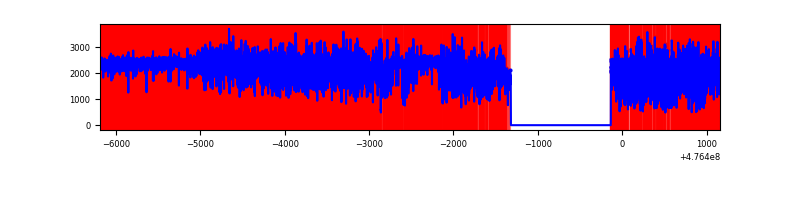 |
Top three noisy pixels from each quadrant. If the there are fewer than three noisy pixels in the level2.evt file, extra rows are filled as -1
| Pixel properties | Quadrant properties | ||||||
|---|---|---|---|---|---|---|---|
| Quadrant | DetID | PixID | Counts | Sigma | Mean | Median | Sigma |
| A | 12 | 80 | 633539 | 3986.73 | 641 | 625 | 158.8 |
| A | 15 | 174 | 439498 | 2764.46 | 641 | 625 | 158.8 |
| A | 8 | 38 | 224486 | 1410.1 | 641 | 625 | 158.8 |
| B | 4 | 170 | 3847511 | 29855.15 | 609 | 589 | 128.9 |
| B | 5 | 32 | 1048348 | 8131.44 | 609 | 589 | 128.9 |
| B | 7 | 0 | 401856 | 3114.15 | 609 | 589 | 128.9 |
| C | 15 | 158 | 625956 | 3606.21 | 633 | 630 | 173.4 |
| C | 13 | 3 | 598331 | 3446.9 | 633 | 630 | 173.4 |
| C | 12 | 247 | 136659 | 784.47 | 633 | 630 | 173.4 |
| D | 2 | 226 | 10359461 | 78919.67 | 464 | 446 | 131.3 |
| D | 2 | 249 | 124643 | 946.19 | 464 | 446 | 131.3 |
| D | 8 | 246 | 114647 | 870.04 | 464 | 446 | 131.3 |
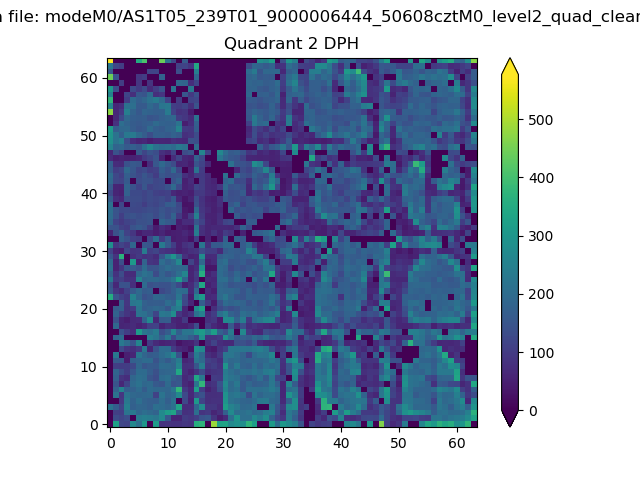
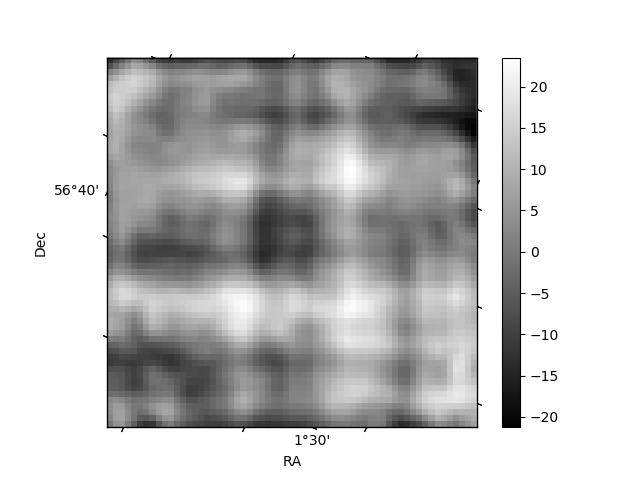
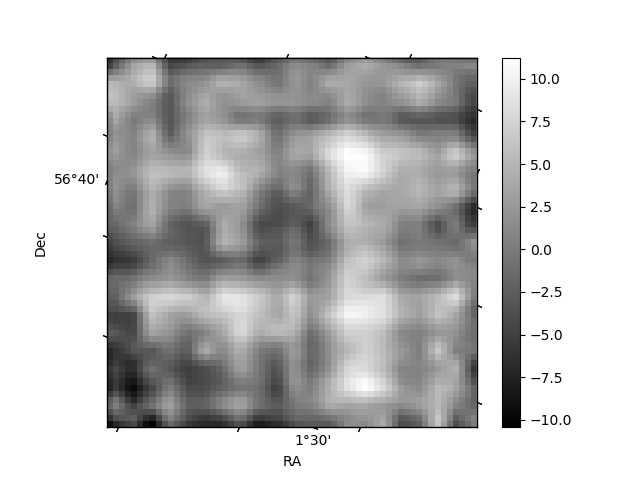
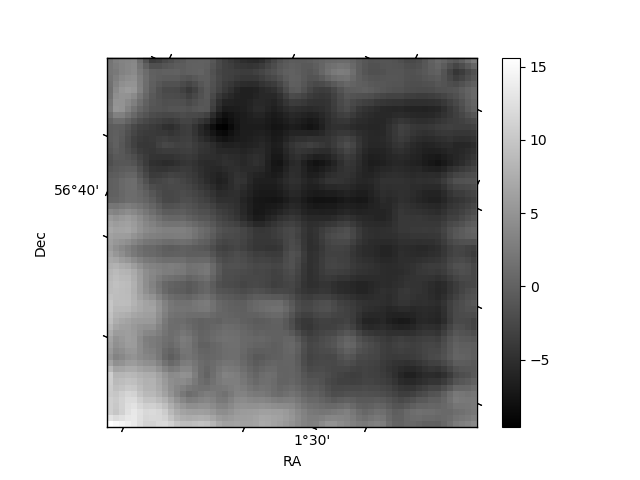
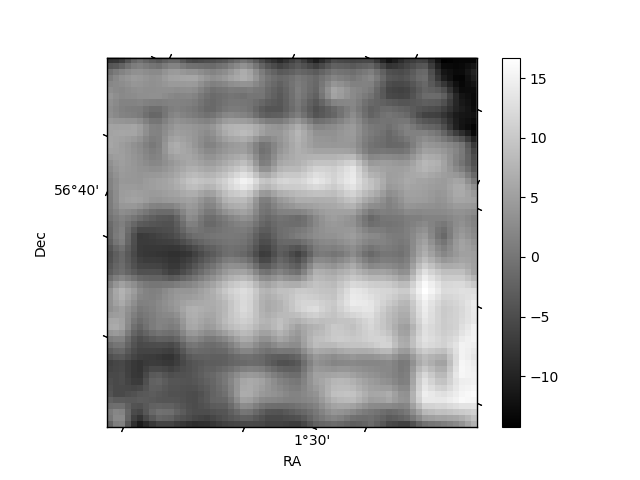
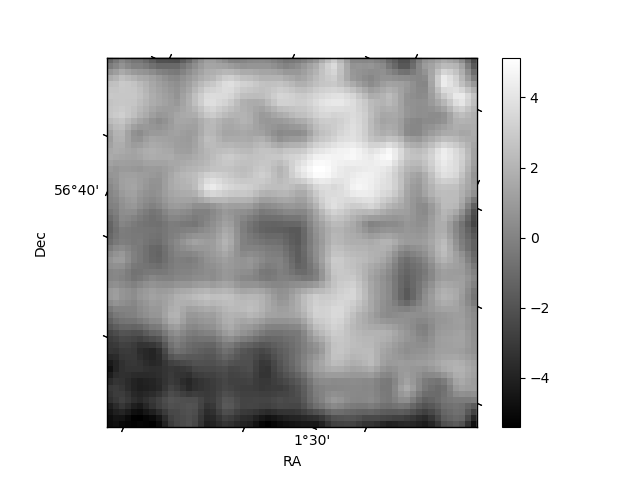
Histogram calculated using DETX and DETY for each event in the final _common_clean file
| Quadrant A | 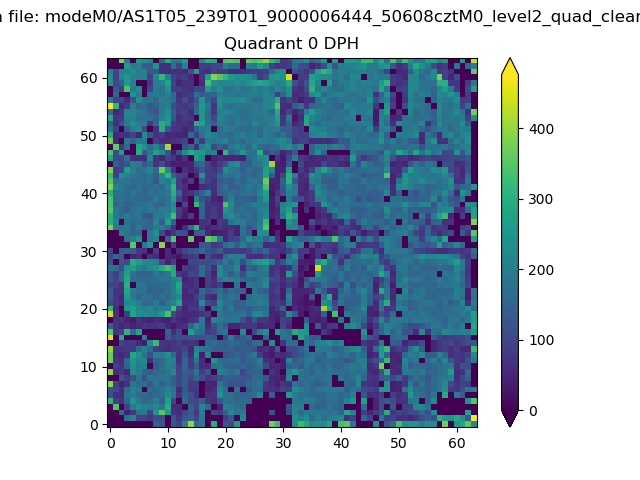 |
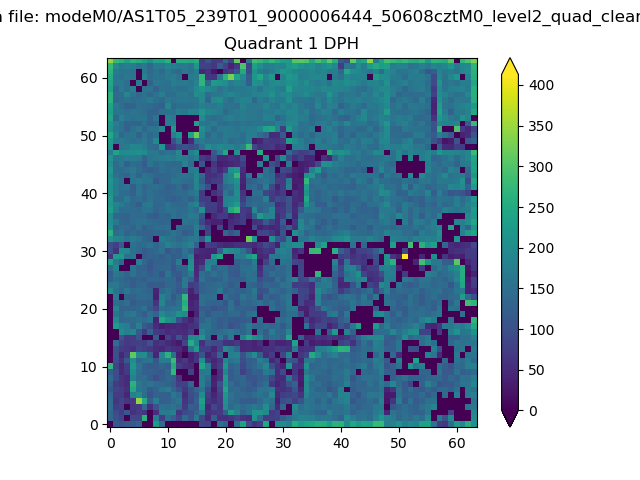 |
Quadrant B |
|---|---|---|---|
| Quadrant D | 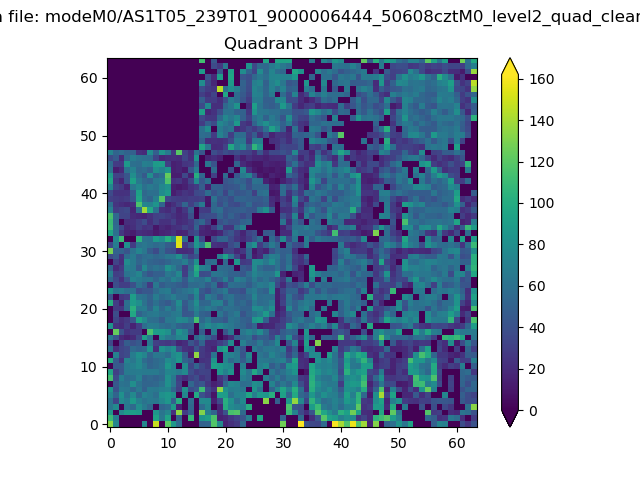 |
 |
Quadrant C |
| Plot type | Count rate plots | Images |
|---|---|---|
| Comparison with Poisson distribution Blue bars denote a histogram of data divided into 1 sec bins. Red curve is a Poisson curve with rate = median count rate of data. |
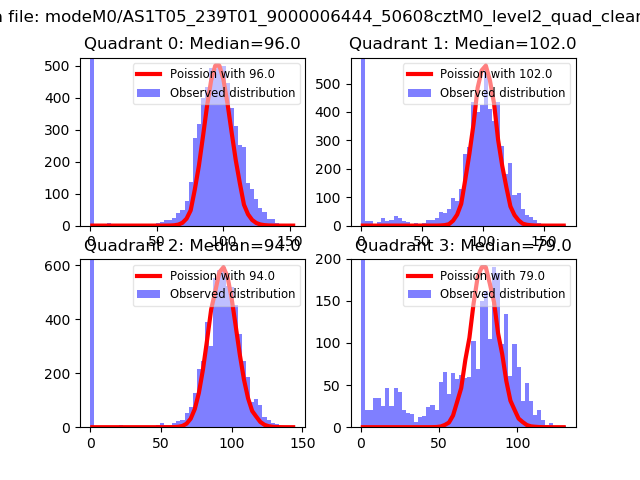 |
 |
| Quadrant-wise count rates Data is divided into 100 sec bins |
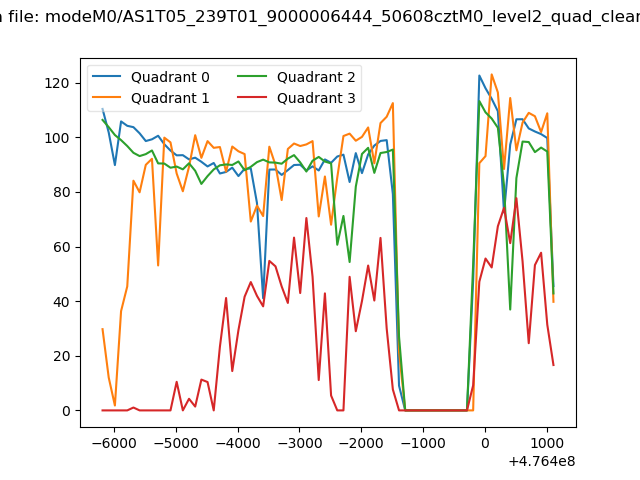 |
|
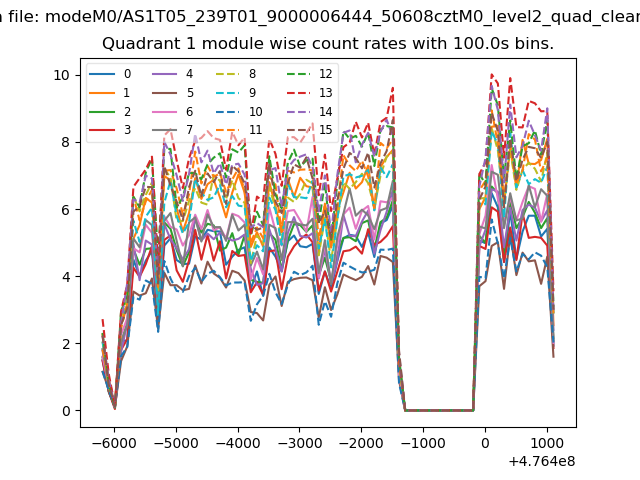
| Module-wise count rates for Quadrant A Data is divided into 100 sec bins |
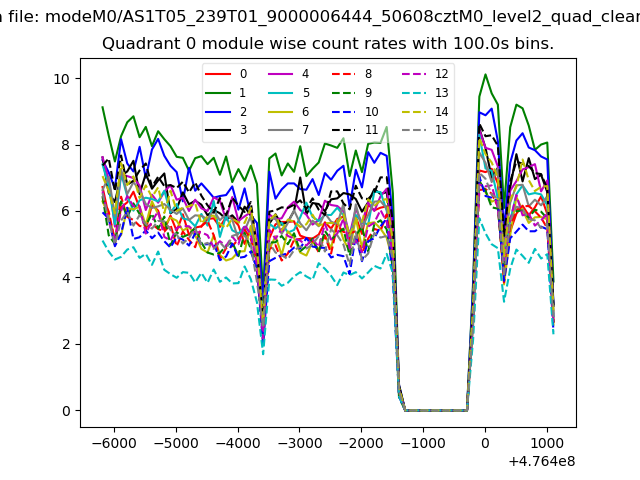 |
 |
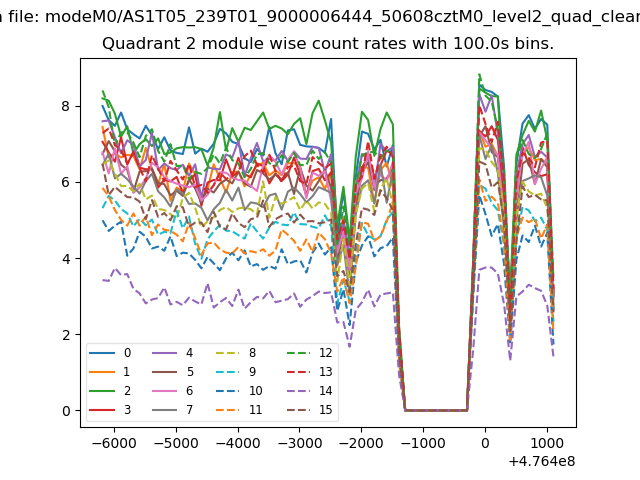
| Module-wise count rates for Quadrant B Data is divided into 100 sec bins |
 |
 |
| Module-wise count rates for Quadrant C Data is divided into 100 sec bins |
 |
 |
| Module-wise count rates for Quadrant D Data is divided into 100 sec bins |
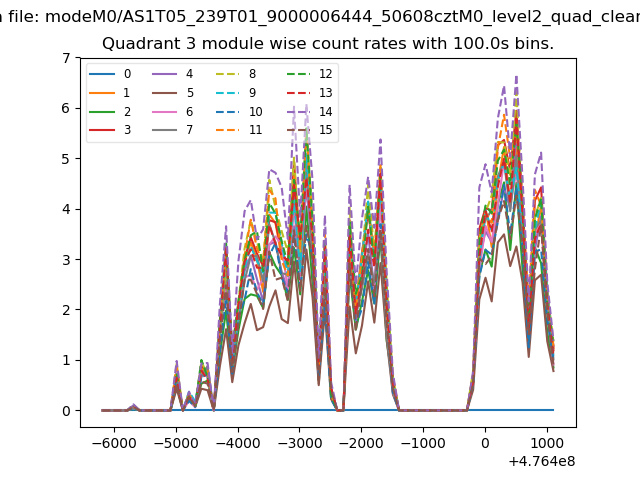 |
 |
| Parameter | Plot |
|---|---|
| CZT HV Monitor | 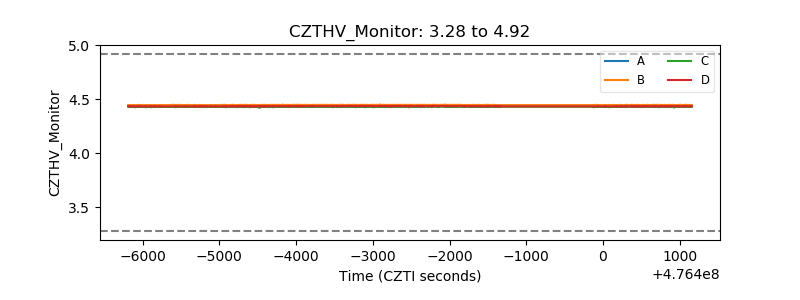 |
| D_VDD | 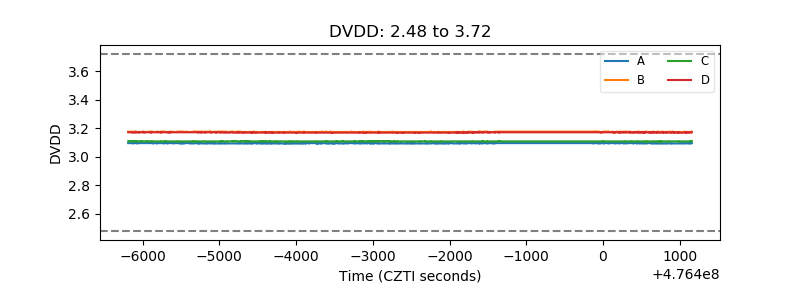 |
| Temperature 1 | 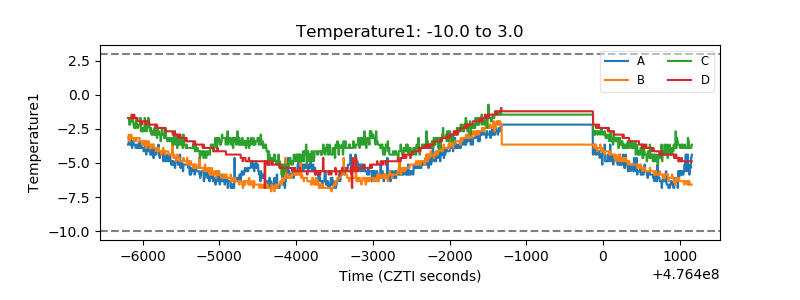 |
| Veto HV Monitor | 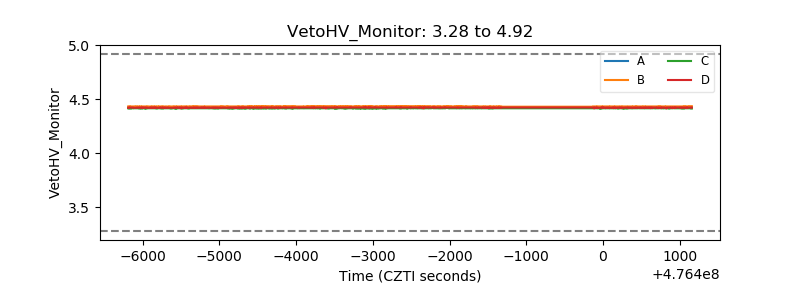 |
| Veto LLD | 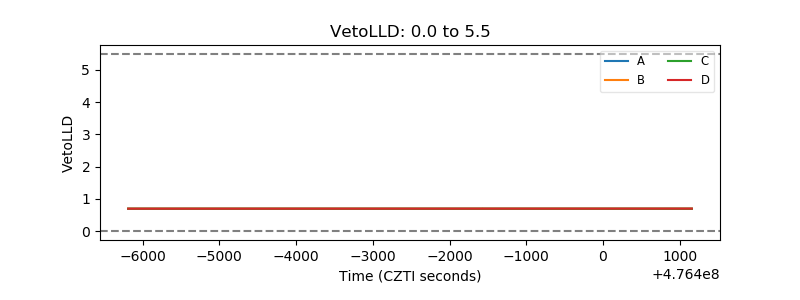 |
| Alpha Counter | 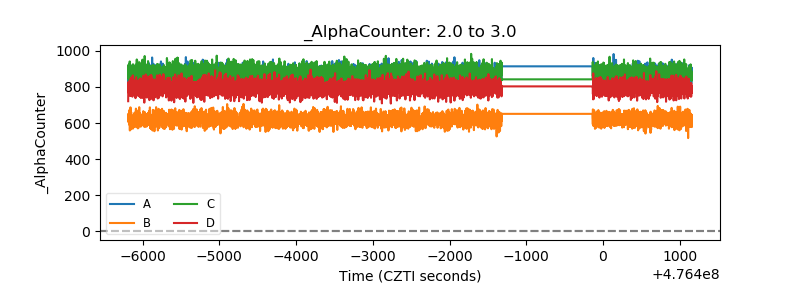 |
| _CPM_Rate | 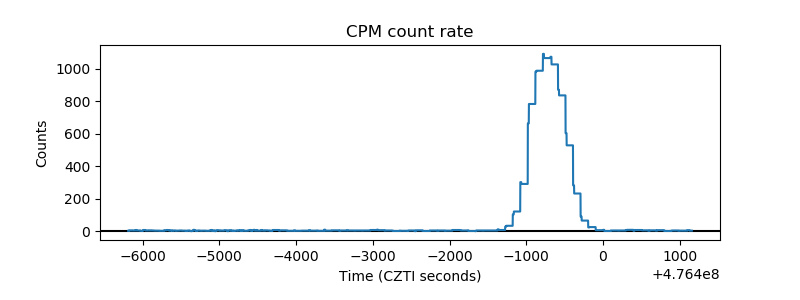 |
| CZT Counter | 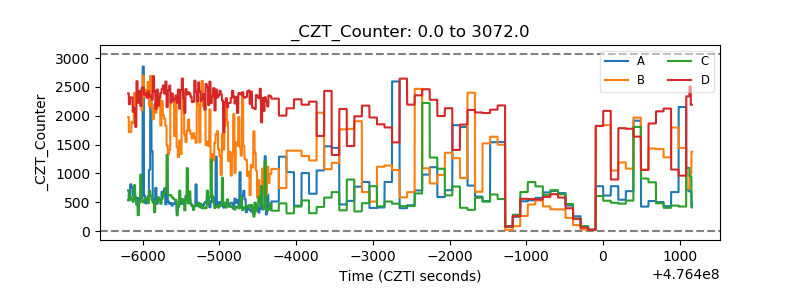 |
| +2.5 Volts monitor | 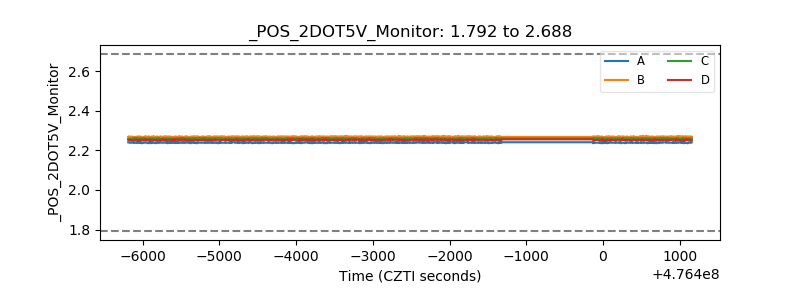 |
| +5 Volts monitor |  |
| _ROLL_ROT | 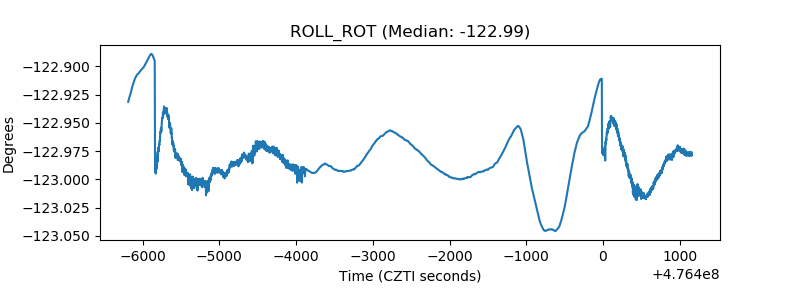 |
| _Roll_DEC | 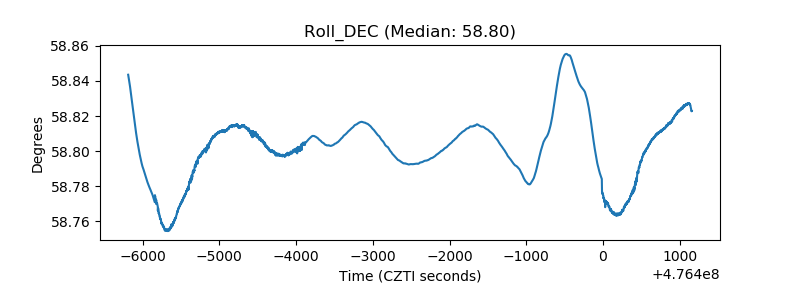 |
| _Roll_RA | 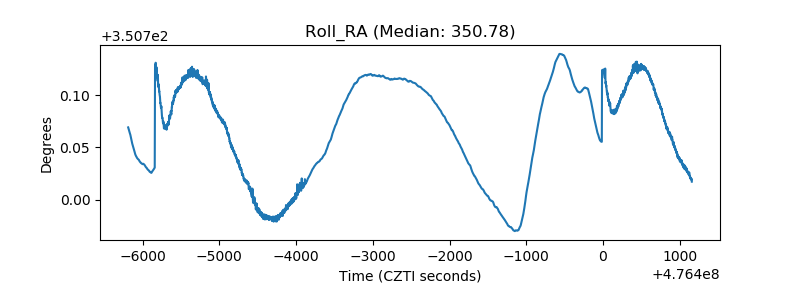 |
| Veto Counter | 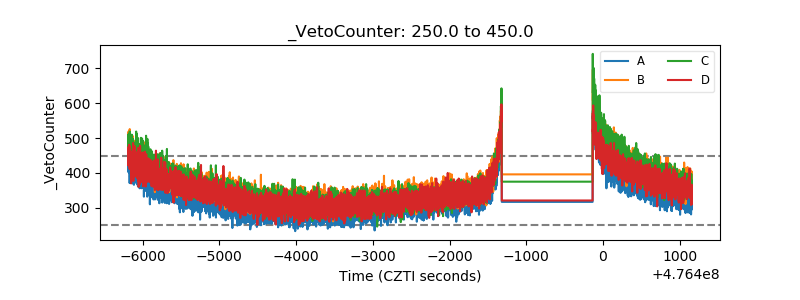 |