| Param | Original file | Final file |
|---|---|---|
| Filename | modeM0/AS1T05_239T01_9000006444_50611cztM0_level2.fits | modeM0/AS1T05_239T01_9000006444_50611cztM0_level2_quad_clean.evt |
| Size (bytes) | 628,816,320 | 86,106,240 |
| Size | 599.7 MB | 82.1 MB |
| Events in quadrant A | 3,617,511 | 622,279 |
| Events in quadrant B | 4,073,482 | 669,705 |
| Events in quadrant C | 3,421,439 | 615,743 |
| Events in quadrant D | 11,650,924 | 239,300 |
| Mode M0 | |||
|---|---|---|---|
| Quadrant | BADHDUFLAG | Total packets | Discarded packets |
| A | 0 | 15366 | 1 |
| B | 0 | 16931 | 1 |
| C | 0 | 14983 | 1 |
| D | 0 | 39138 | 1 |
| Mode M9 | |||
|---|---|---|---|
| Quadrant | BADHDUFLAG | Total packets | Discarded packets |
| A | 0 | 11 | 0 |
| B | 0 | 11 | 0 |
| C | 0 | 11 | 0 |
| D | 0 | 11 | 0 |
| Mode SS | |||
|---|---|---|---|
| Quadrant | BADHDUFLAG | Total packets | Discarded packets |
| A | 0 | 134 | 0 |
| B | 0 | 134 | 0 |
| C | 0 | 134 | 0 |
| D | 0 | 134 | 0 |
| Quadrant | Total seconds | Saturated seconds | Saturation percentage |
|---|---|---|---|
| A | 6597 | 106 | 1.606791% |
| B | 6598 | 267 | 4.046681% |
| C | 6598 | 89 | 1.348894% |
| D | 6598 | 4177 | 63.307063% |
Noise dominated data is calculated using 1-second bins in cleaned event files. If a bin has >2000 counts, and if more than 50% of those come from <1% of pixels, then it is considered to be noise-dominated and hence unusable.
| Quadrant | # 1 sec bins | Bins with >0 counts | Bins with >2000 counts | High rate bins dominated by noise | Noise dominated (total time) | Noise dominated (detector-on time) | Marked lightcurve |
|---|---|---|---|---|---|---|---|
| A | 7682 | 6598 | 71 | 71 | 0.92% | 1.08% | 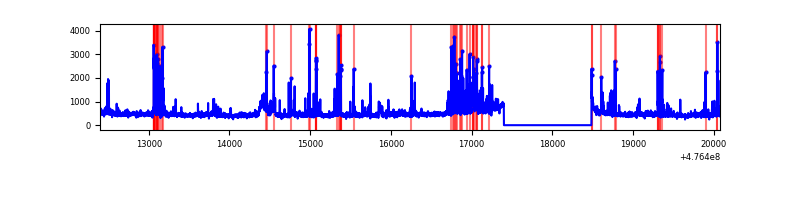 |
| B | 7683 | 6599 | 148 | 148 | 1.93% | 2.24% | 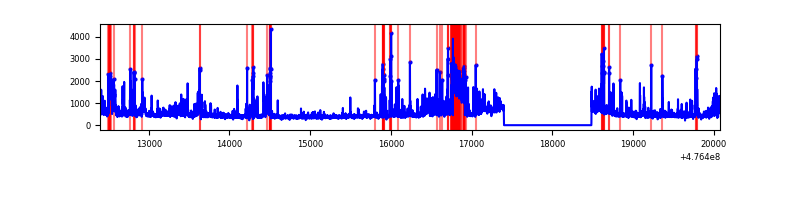 |
| C | 7683 | 6599 | 69 | 69 | 0.90% | 1.05% | 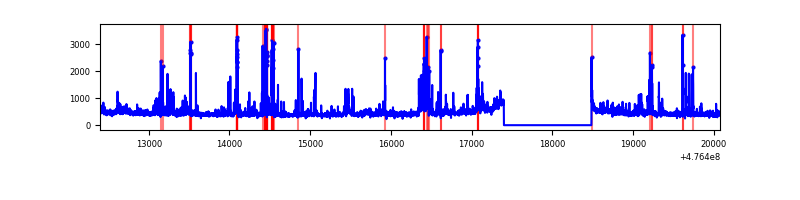 |
| D | 7683 | 6599 | 3468 | 3468 | 45.14% | 52.55% | 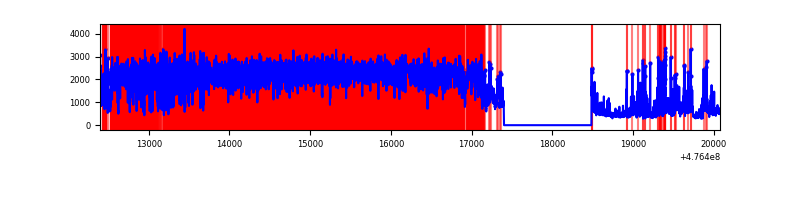 |
Top three noisy pixels from each quadrant. If the there are fewer than three noisy pixels in the level2.evt file, extra rows are filled as -1
| Pixel properties | Quadrant properties | ||||||
|---|---|---|---|---|---|---|---|
| Quadrant | DetID | PixID | Counts | Sigma | Mean | Median | Sigma |
| A | 3 | 130 | 184878 | 1060.32 | 692 | 675 | 173.7 |
| A | 4 | 3 | 159099 | 911.93 | 692 | 675 | 173.7 |
| A | 9 | 96 | 148524 | 851.06 | 692 | 675 | 173.7 |
| B | 4 | 170 | 298596 | 2033.65 | 686 | 663 | 146.5 |
| B | 0 | 229 | 175702 | 1194.79 | 686 | 663 | 146.5 |
| B | 5 | 172 | 167968 | 1142.0 | 686 | 663 | 146.5 |
| C | 0 | 177 | 111864 | 593.6 | 678 | 671 | 187.3 |
| C | 15 | 232 | 109014 | 578.39 | 678 | 671 | 187.3 |
| C | 1 | 13 | 82339 | 435.98 | 678 | 671 | 187.3 |
| D | 2 | 226 | 7855173 | 50875.04 | 550 | 530 | 154.4 |
| D | 2 | 165 | 522101 | 3378.25 | 550 | 530 | 154.4 |
| D | 15 | 154 | 149631 | 965.74 | 550 | 530 | 154.4 |
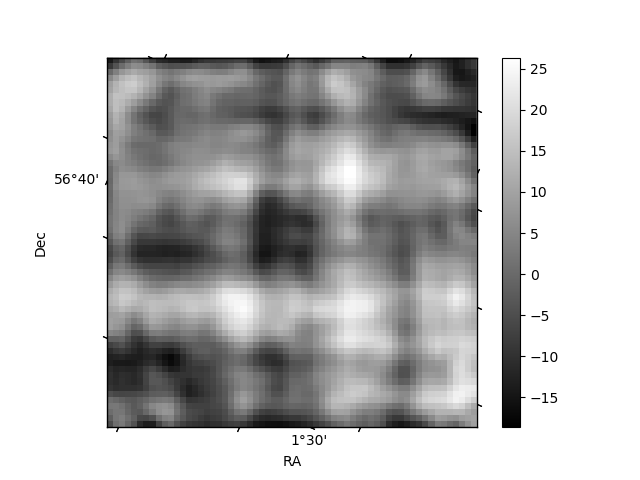
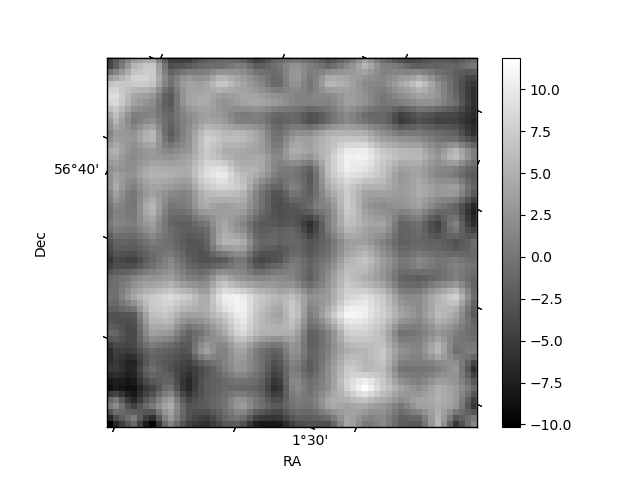
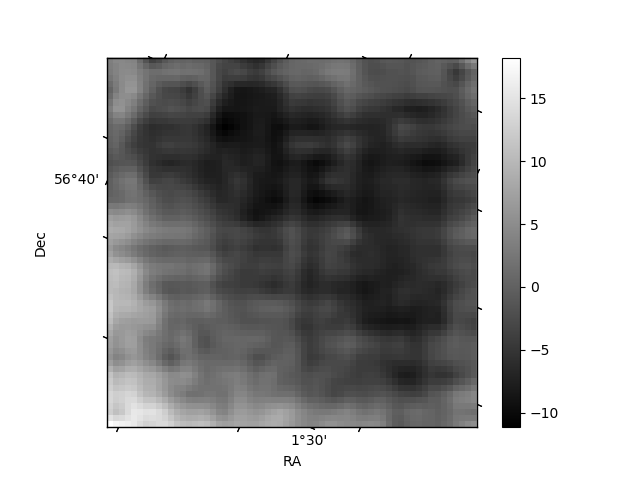
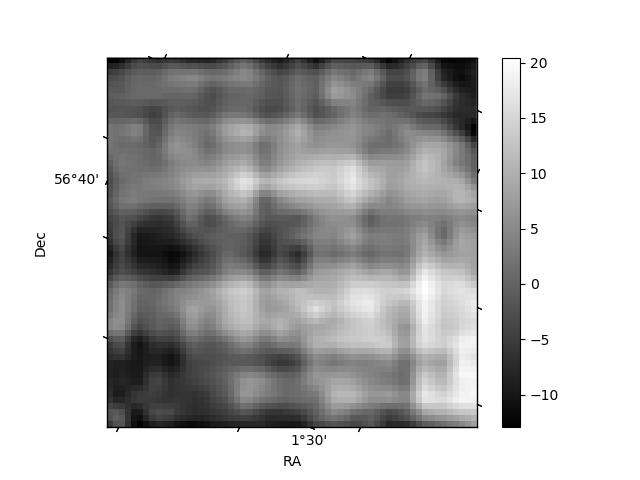
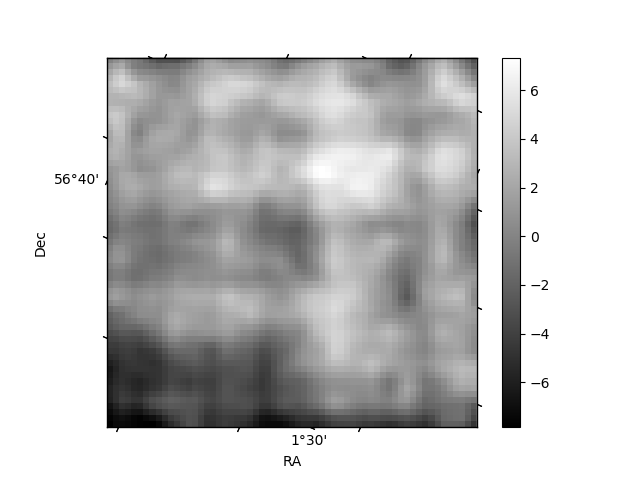
Histogram calculated using DETX and DETY for each event in the final _common_clean file
| Quadrant A | 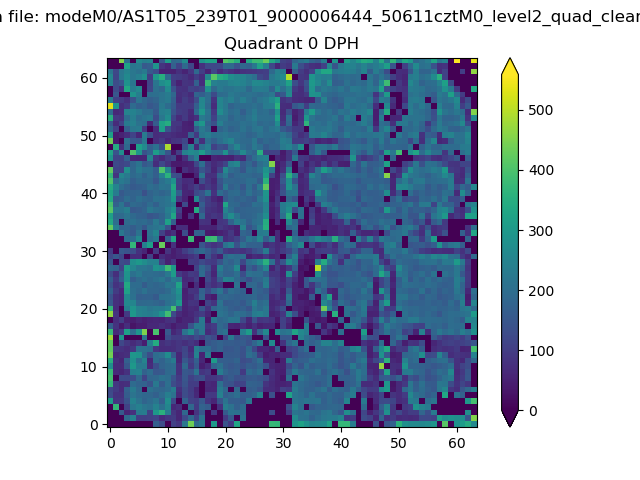 |
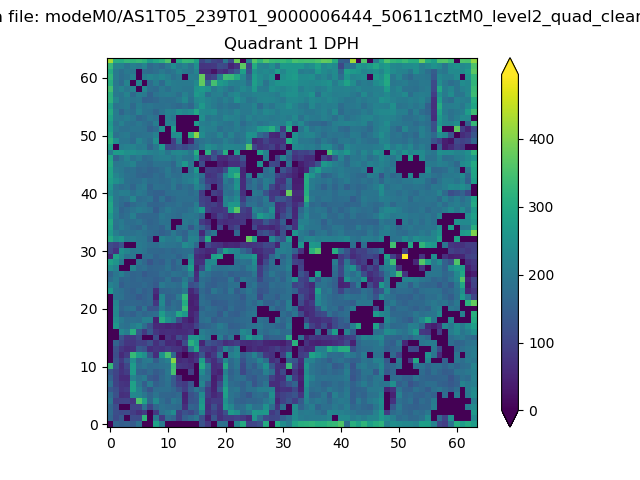 |
Quadrant B |
|---|---|---|---|
| Quadrant D | 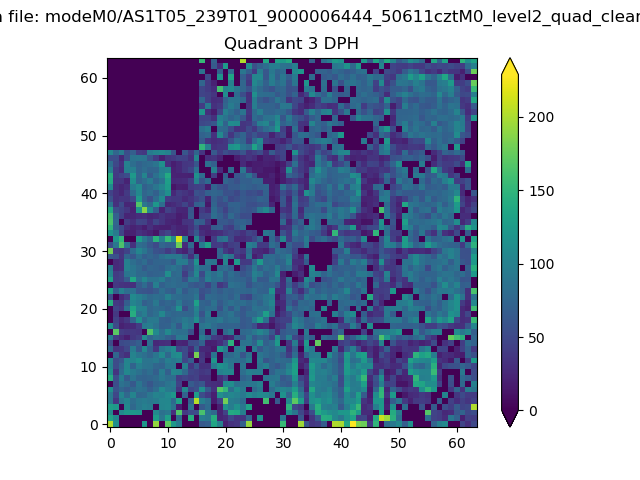 |
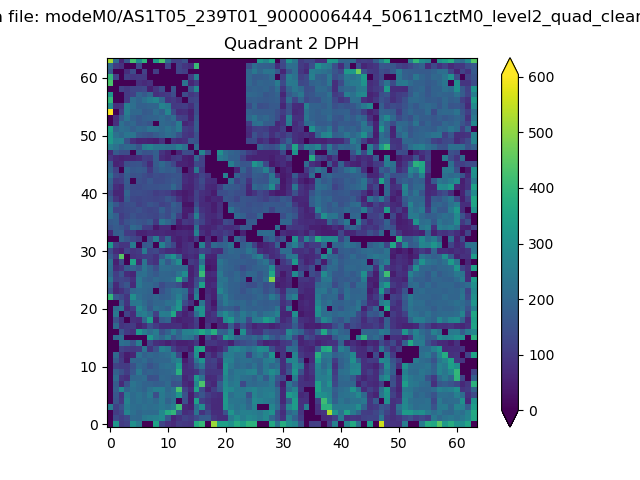 |
Quadrant C |
| Plot type | Count rate plots | Images |
|---|---|---|
| Comparison with Poisson distribution Blue bars denote a histogram of data divided into 1 sec bins. Red curve is a Poisson curve with rate = median count rate of data. |
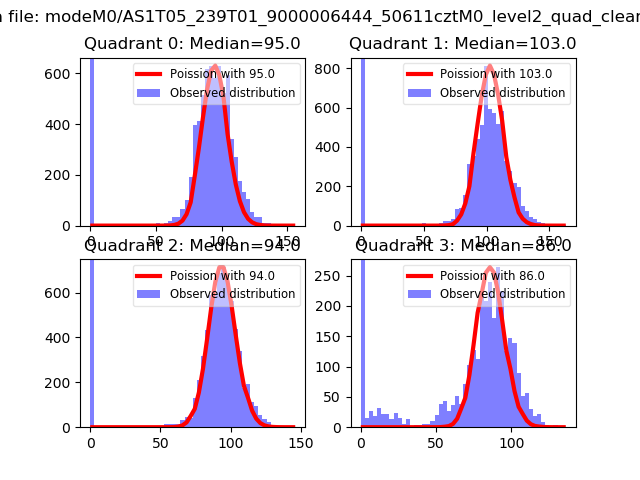 |
 |
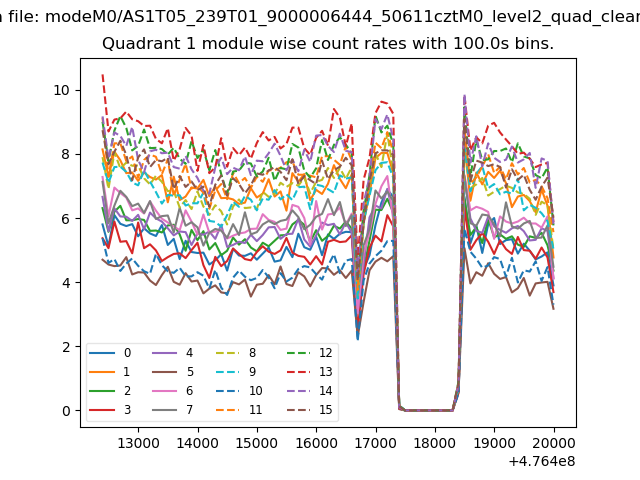
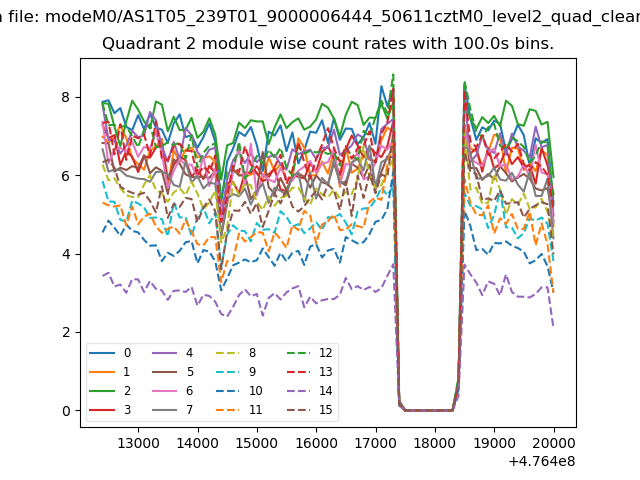
| Quadrant-wise count rates Data is divided into 100 sec bins |
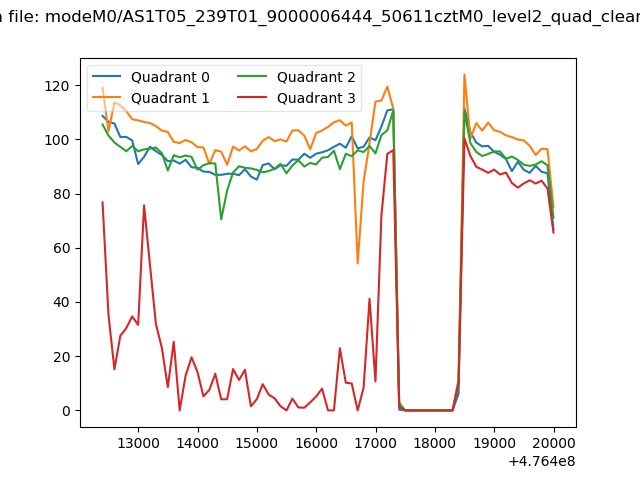 |
|
| Module-wise count rates for Quadrant A Data is divided into 100 sec bins |
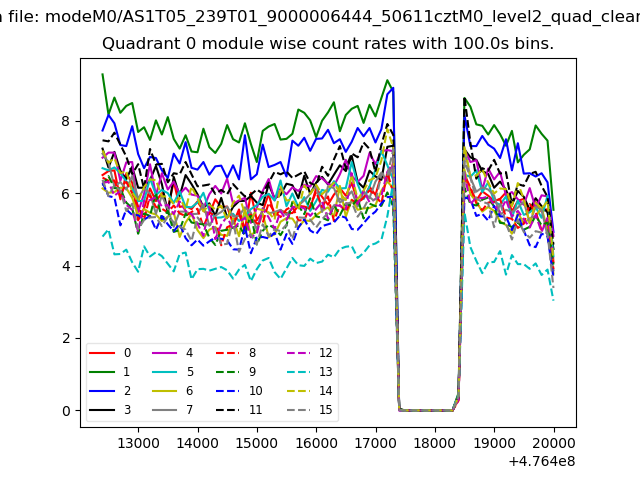 |
 |
| Module-wise count rates for Quadrant B Data is divided into 100 sec bins |
 |
 |
| Module-wise count rates for Quadrant C Data is divided into 100 sec bins |
 |
 |
| Module-wise count rates for Quadrant D Data is divided into 100 sec bins |
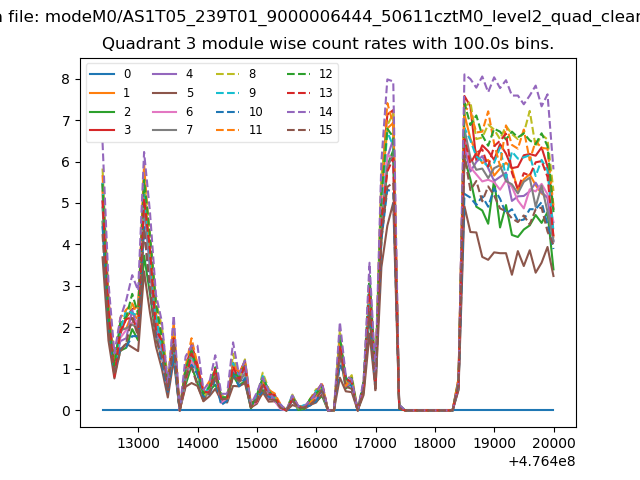 |
 |
| Parameter | Plot |
|---|---|
| CZT HV Monitor | 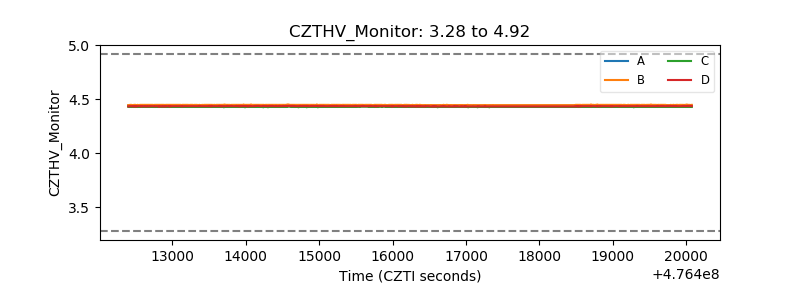 |
| D_VDD | 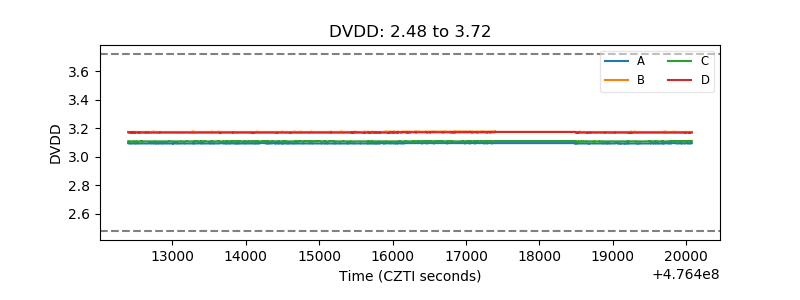 |
| Temperature 1 | 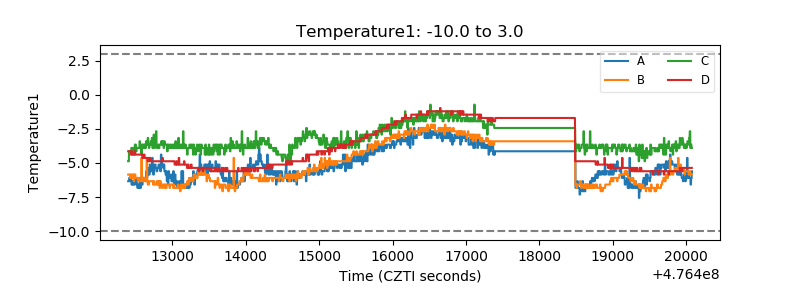 |
| Veto HV Monitor | 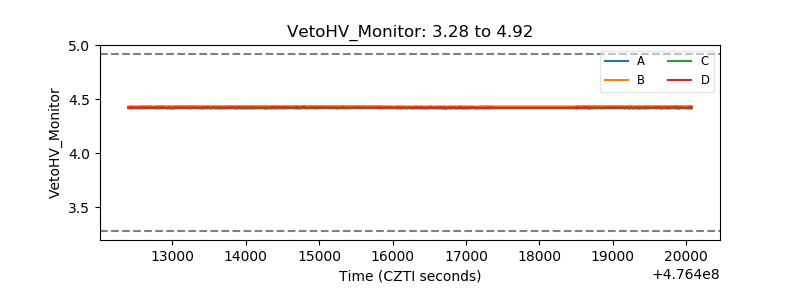 |
| Veto LLD | 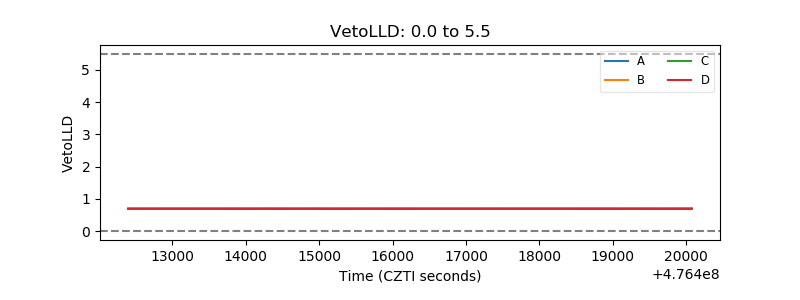 |
| Alpha Counter | 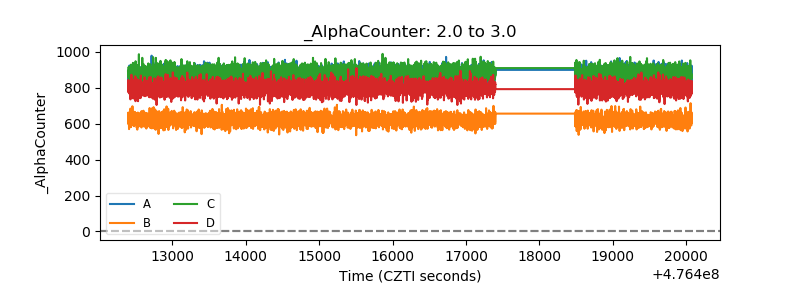 |
| _CPM_Rate | 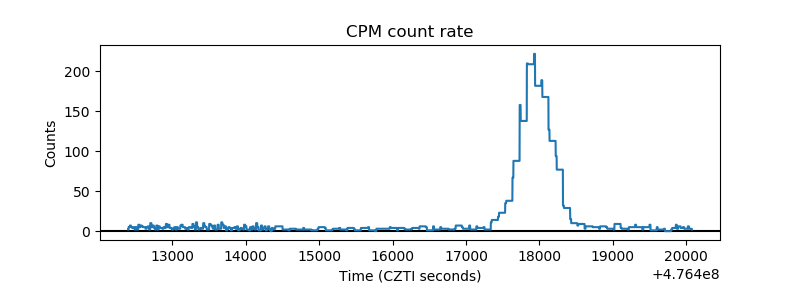 |
| CZT Counter | 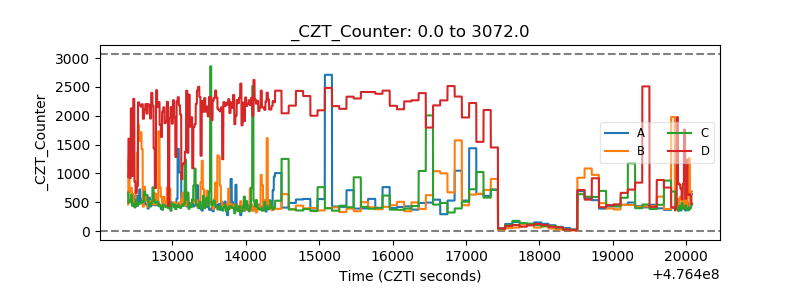 |
| +2.5 Volts monitor |  |
| +5 Volts monitor | 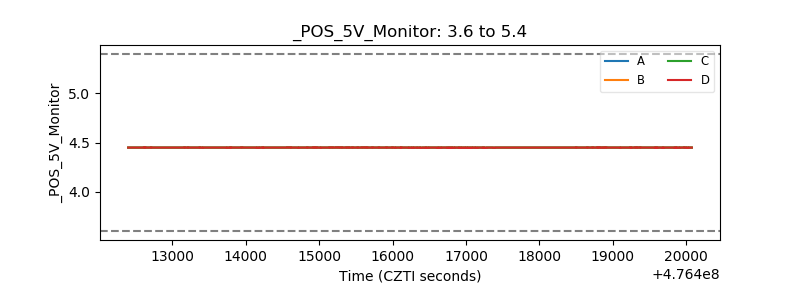 |
| _ROLL_ROT | 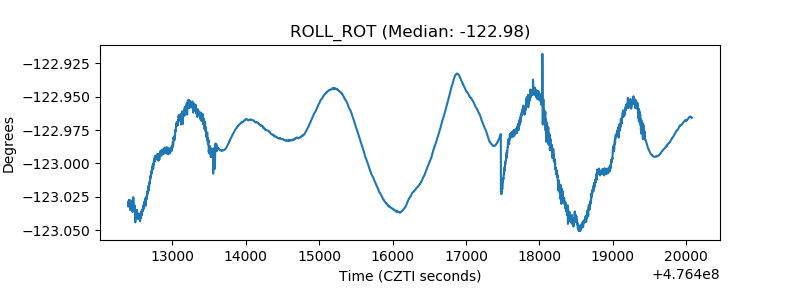 |
| _Roll_DEC | 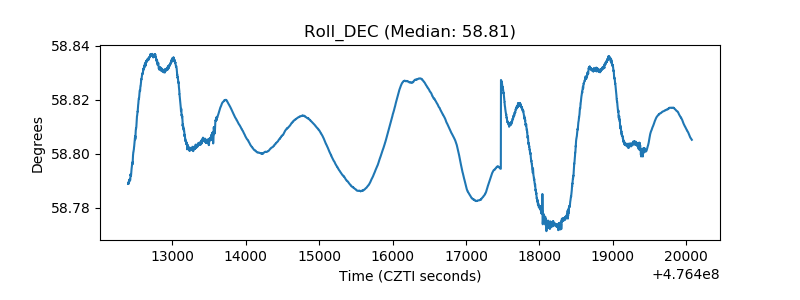 |
| _Roll_RA | 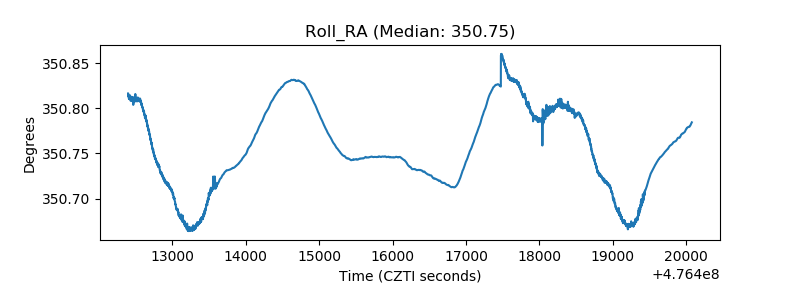 |
| Veto Counter | 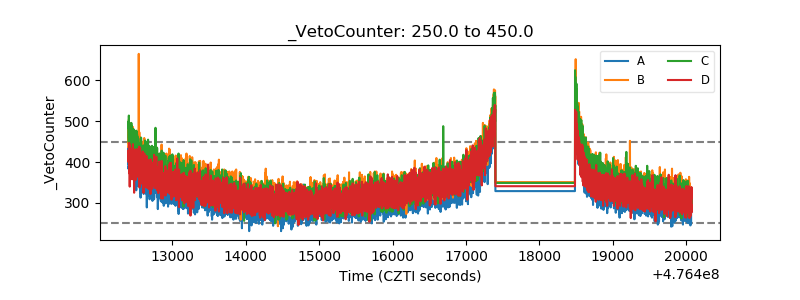 |