| Param | Original file | Final file |
|---|---|---|
| Filename | modeM0/AS1T05_239T01_9000006444_50612cztM0_level2.fits | modeM0/AS1T05_239T01_9000006444_50612cztM0_level2_quad_clean.evt |
| Size (bytes) | 574,922,880 | 100,022,400 |
| Size | 548.3 MB | 95.4 MB |
| Events in quadrant A | 4,824,115 | 644,469 |
| Events in quadrant B | 4,352,744 | 712,213 |
| Events in quadrant C | 4,885,903 | 626,071 |
| Events in quadrant D | 6,664,641 | 547,838 |
| Mode M0 | |||
|---|---|---|---|
| Quadrant | BADHDUFLAG | Total packets | Discarded packets |
| A | 0 | 19312 | 2 |
| B | 0 | 17946 | 4 |
| C | 0 | 19766 | 2 |
| D | 0 | 24973 | 2 |
| Mode M9 | |||
|---|---|---|---|
| Quadrant | BADHDUFLAG | Total packets | Discarded packets |
| A | 0 | 17 | 0 |
| B | 0 | 17 | 0 |
| C | 0 | 17 | 0 |
| D | 0 | 17 | 0 |
| Mode SS | |||
|---|---|---|---|
| Quadrant | BADHDUFLAG | Total packets | Discarded packets |
| A | 0 | 148 | 0 |
| B | 0 | 148 | 0 |
| C | 0 | 148 | 0 |
| D | 0 | 148 | 0 |
| Quadrant | Total seconds | Saturated seconds | Saturation percentage |
|---|---|---|---|
| A | 7146 | 344 | 4.813882% |
| B | 7145 | 271 | 3.792862% |
| C | 7146 | 430 | 6.017352% |
| D | 7146 | 852 | 11.922754% |
Noise dominated data is calculated using 1-second bins in cleaned event files. If a bin has >2000 counts, and if more than 50% of those come from <1% of pixels, then it is considered to be noise-dominated and hence unusable.
| Quadrant | # 1 sec bins | Bins with >0 counts | Bins with >2000 counts | High rate bins dominated by noise | Noise dominated (total time) | Noise dominated (detector-on time) | Marked lightcurve |
|---|---|---|---|---|---|---|---|
| A | 8901 | 7148 | 225 | 225 | 2.53% | 3.15% | 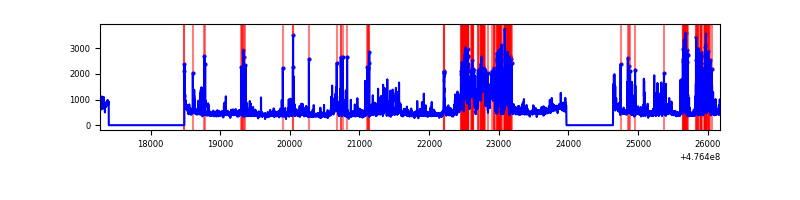 |
| B | 8900 | 7146 | 92 | 92 | 1.03% | 1.29% | 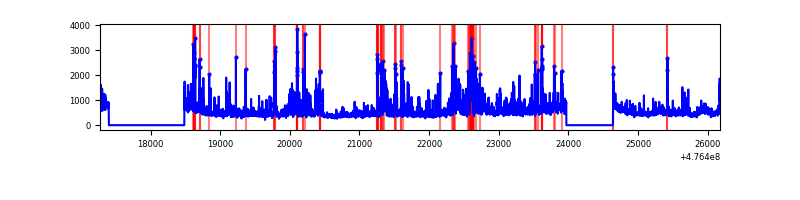 |
| C | 8901 | 7147 | 274 | 274 | 3.08% | 3.83% | 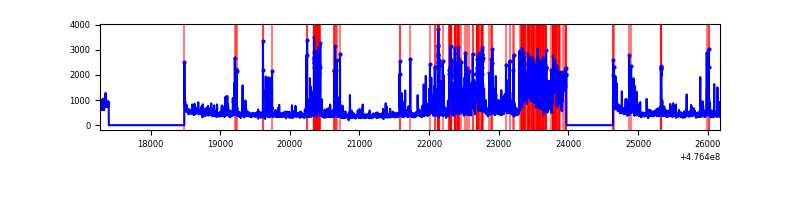 |
| D | 8901 | 7147 | 742 | 742 | 8.34% | 10.38% | 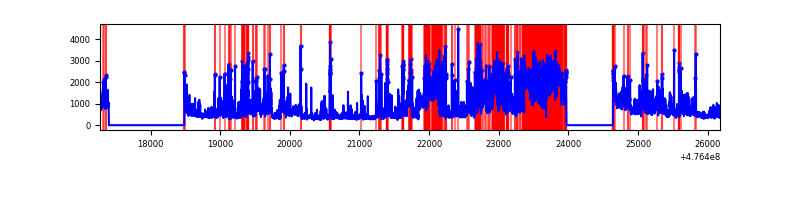 |
Top three noisy pixels from each quadrant. If the there are fewer than three noisy pixels in the level2.evt file, extra rows are filled as -1
| Pixel properties | Quadrant properties | ||||||
|---|---|---|---|---|---|---|---|
| Quadrant | DetID | PixID | Counts | Sigma | Mean | Median | Sigma |
| A | 9 | 96 | 610875 | 3292.2 | 754 | 733 | 185.3 |
| A | 3 | 114 | 331033 | 1782.23 | 754 | 733 | 185.3 |
| A | 6 | 161 | 260636 | 1402.38 | 754 | 733 | 185.3 |
| B | 5 | 185 | 287568 | 1775.1 | 754 | 726 | 161.6 |
| B | 5 | 172 | 236944 | 1461.81 | 754 | 726 | 161.6 |
| B | 4 | 170 | 185644 | 1144.35 | 754 | 726 | 161.6 |
| C | 0 | 177 | 665697 | 3295.4 | 733 | 725 | 201.8 |
| C | 15 | 232 | 206687 | 1020.69 | 733 | 725 | 201.8 |
| C | 13 | 3 | 166323 | 820.65 | 733 | 725 | 201.8 |
| D | 8 | 48 | 640828 | 3296.58 | 697 | 671 | 194.2 |
| D | 8 | 246 | 608460 | 3129.9 | 697 | 671 | 194.2 |
| D | 15 | 9 | 450780 | 2317.9 | 697 | 671 | 194.2 |
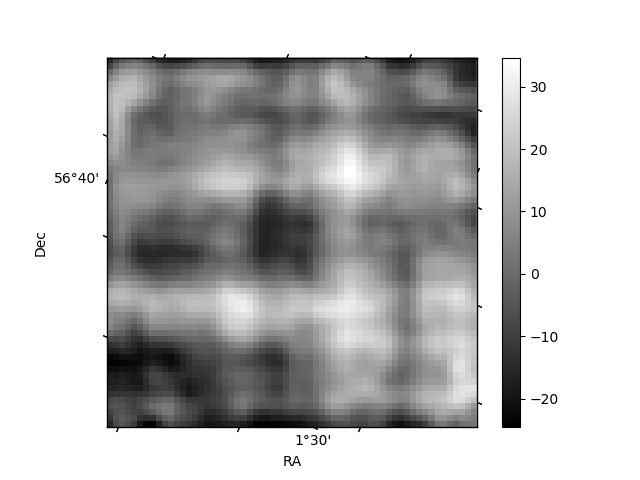
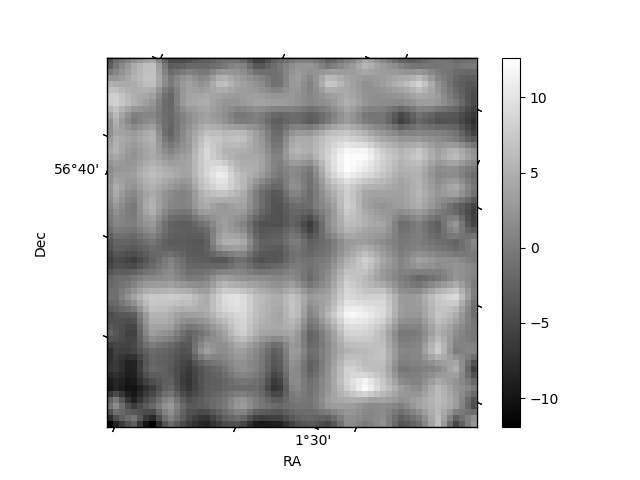
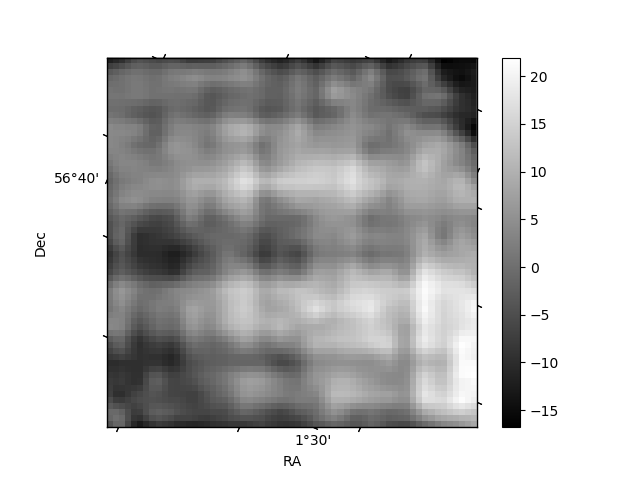
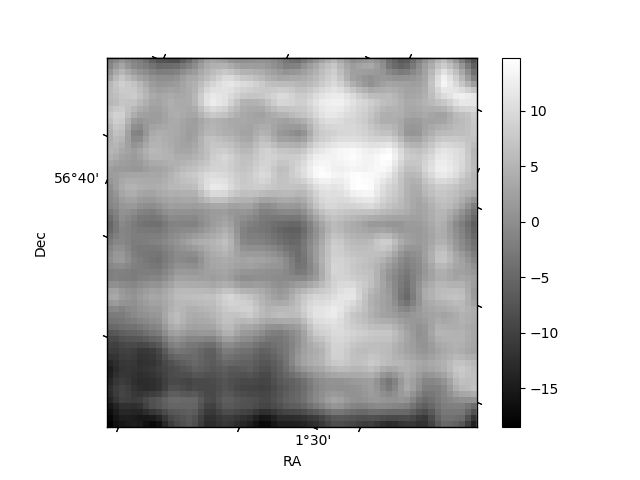
Histogram calculated using DETX and DETY for each event in the final _common_clean file
| Quadrant A | 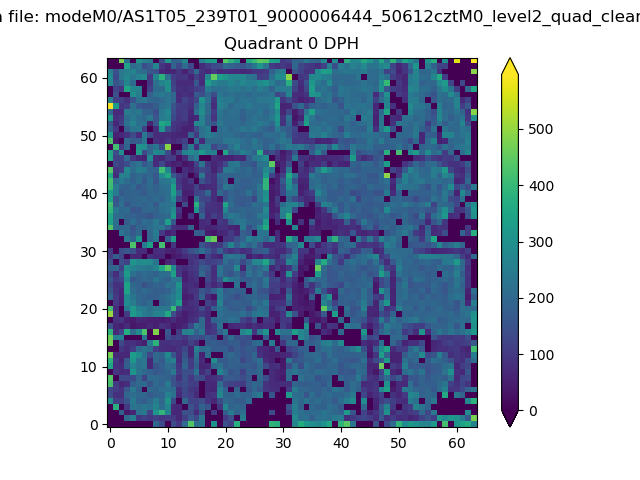 |
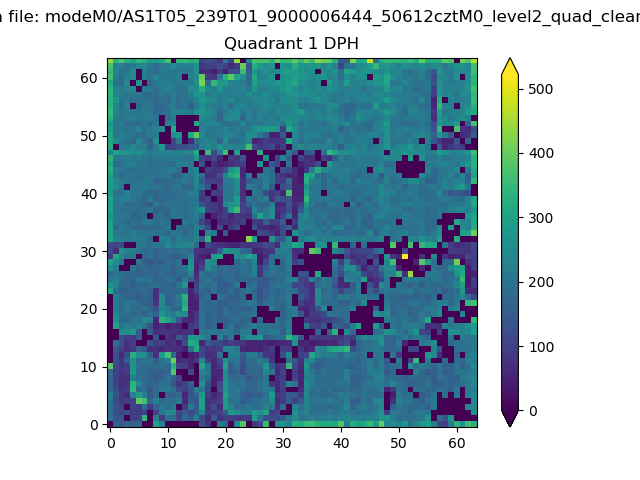 |
Quadrant B |
|---|---|---|---|
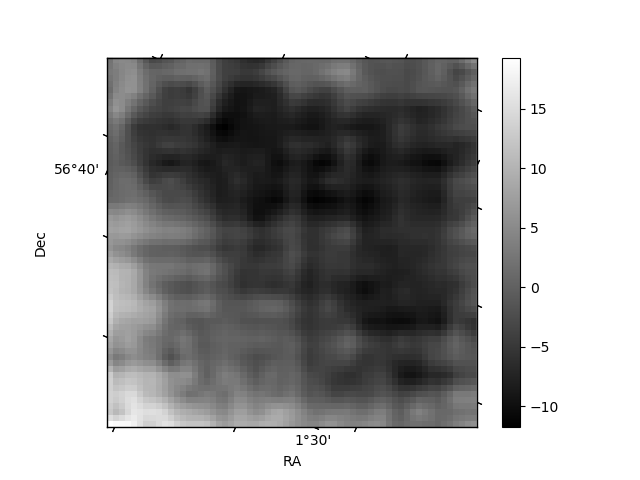
| Quadrant D | 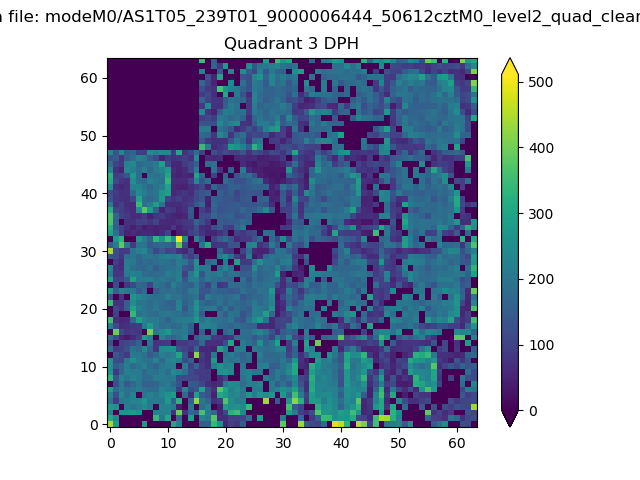 |
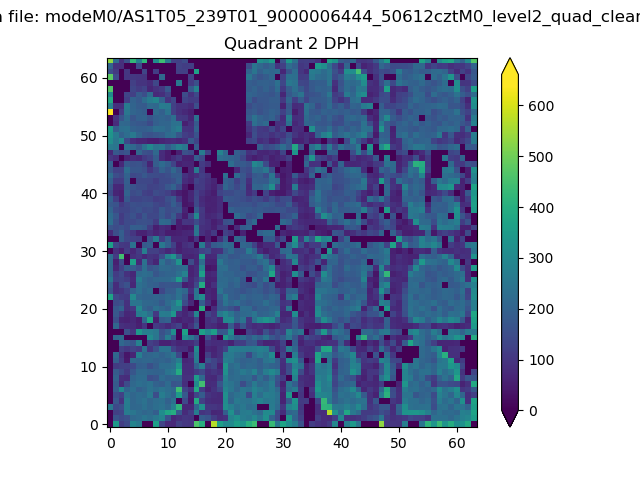 |
Quadrant C |
| Plot type | Count rate plots | Images |
|---|---|---|
| Comparison with Poisson distribution Blue bars denote a histogram of data divided into 1 sec bins. Red curve is a Poisson curve with rate = median count rate of data. |
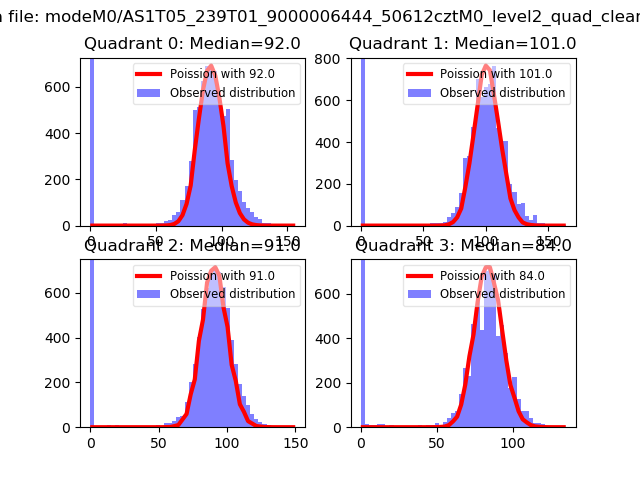 |
 |
| Quadrant-wise count rates Data is divided into 100 sec bins |
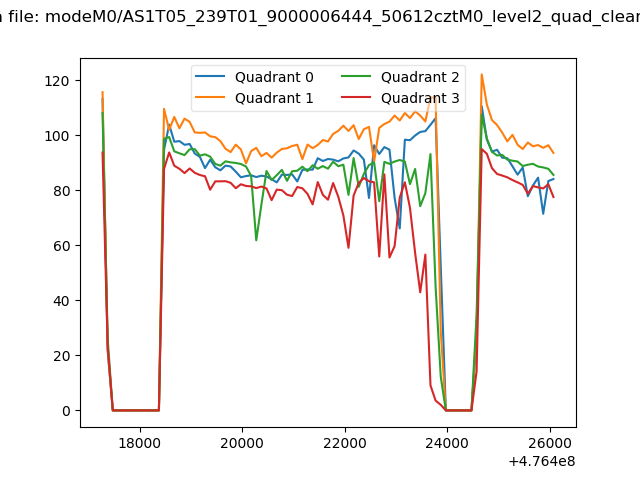 |
|
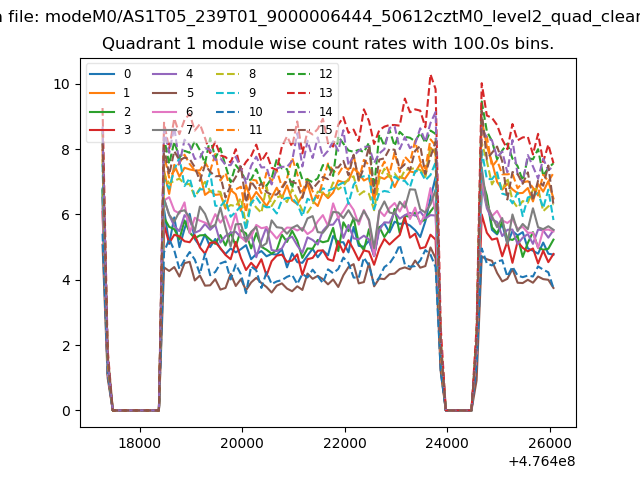
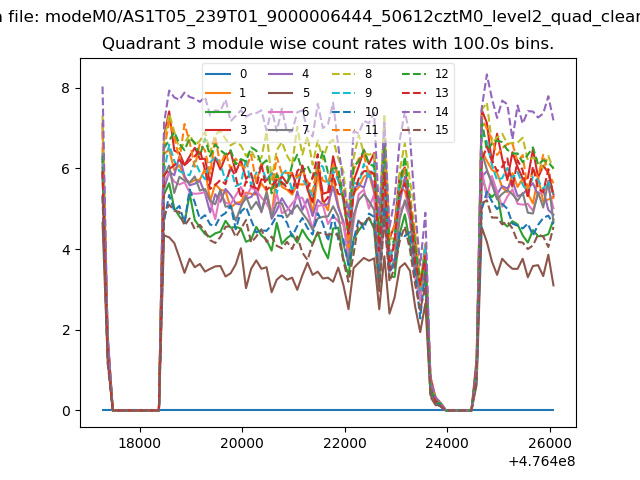
| Module-wise count rates for Quadrant A Data is divided into 100 sec bins |
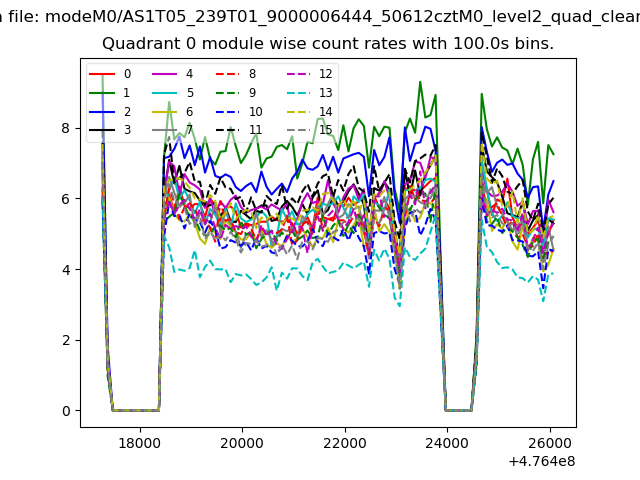 |
 |
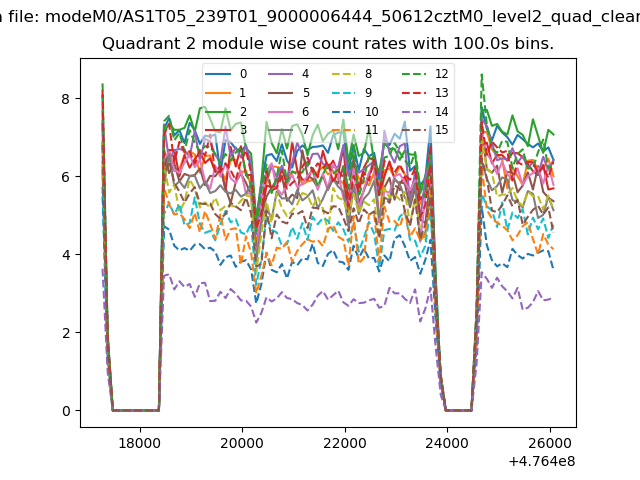
| Module-wise count rates for Quadrant B Data is divided into 100 sec bins |
 |
 |
| Module-wise count rates for Quadrant C Data is divided into 100 sec bins |
 |
 |
| Module-wise count rates for Quadrant D Data is divided into 100 sec bins |
 |
 |
| Parameter | Plot |
|---|---|
| CZT HV Monitor | 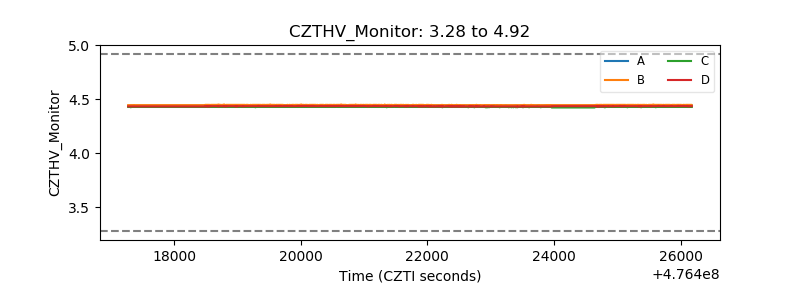 |
| D_VDD | 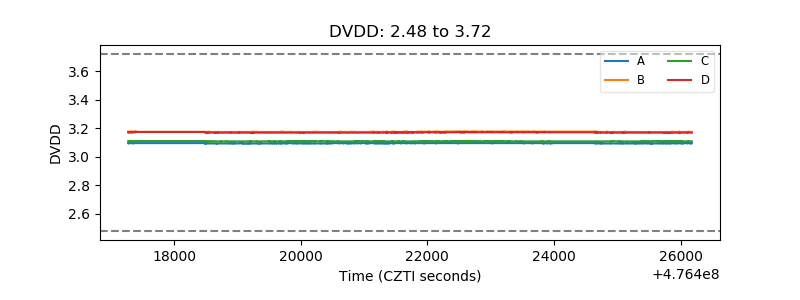 |
| Temperature 1 | 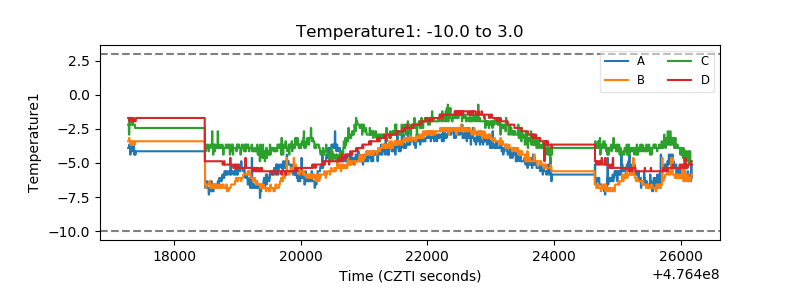 |
| Veto HV Monitor | 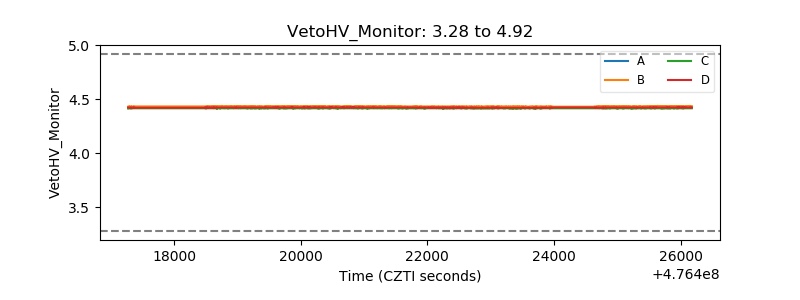 |
| Veto LLD | 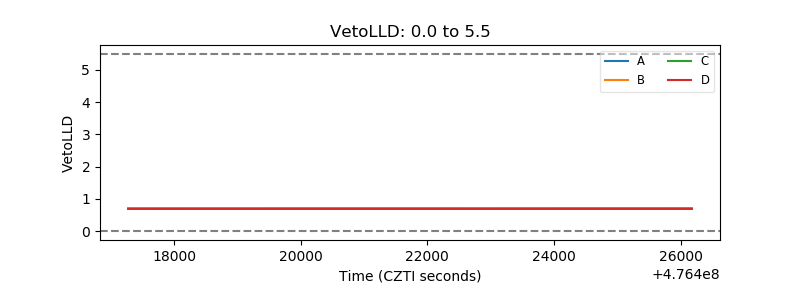 |
| Alpha Counter | 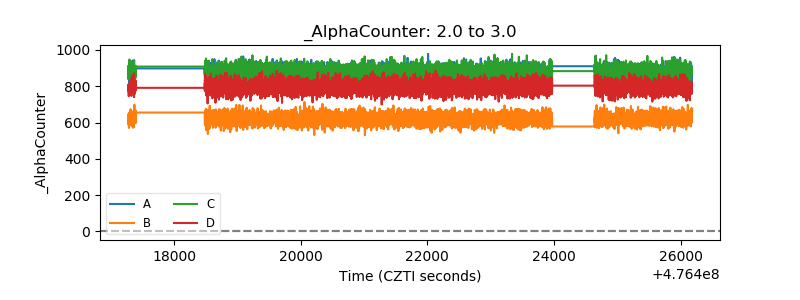 |
| _CPM_Rate | 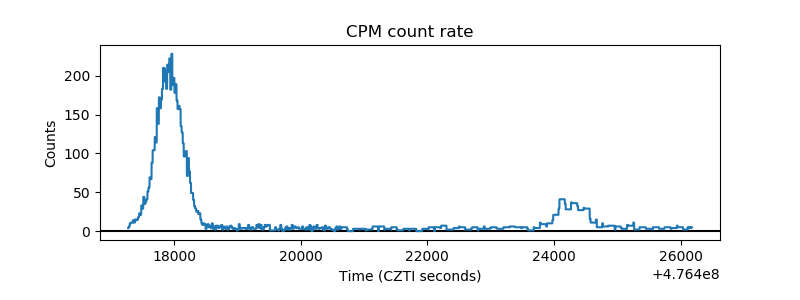 |
| CZT Counter | 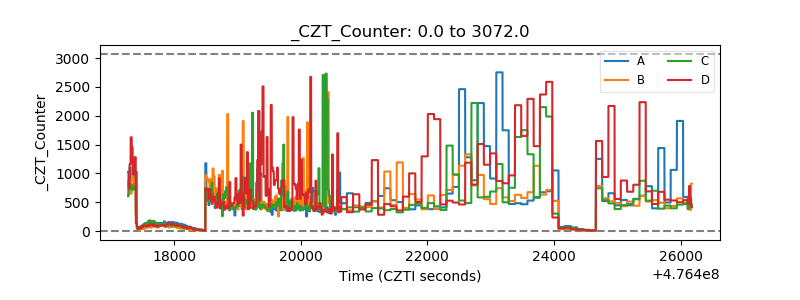 |
| +2.5 Volts monitor | 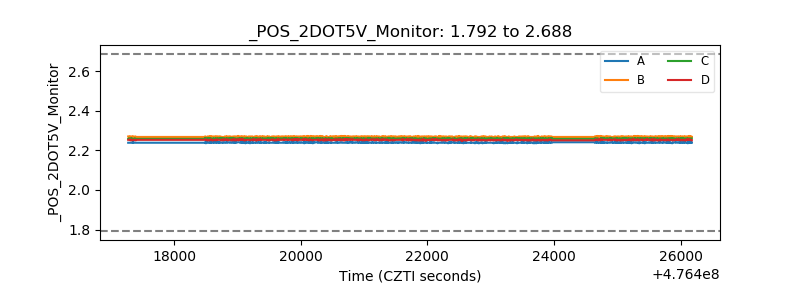 |
| +5 Volts monitor | 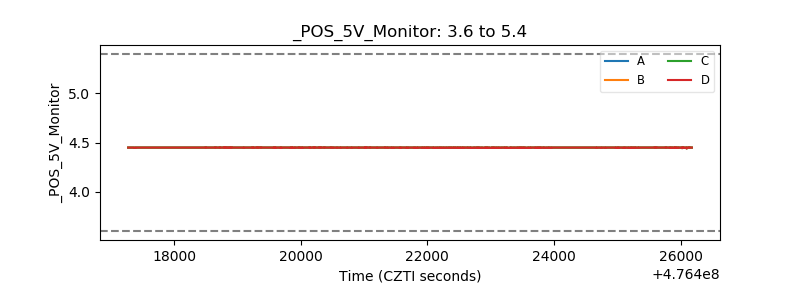 |
| _ROLL_ROT | 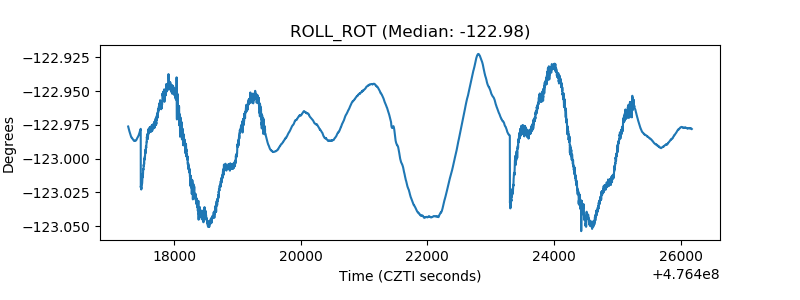 |
| _Roll_DEC | 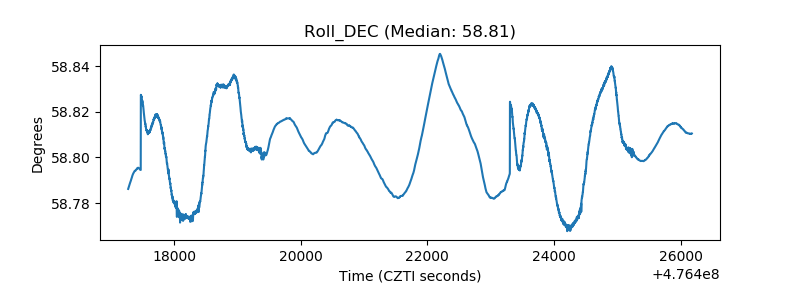 |
| _Roll_RA | 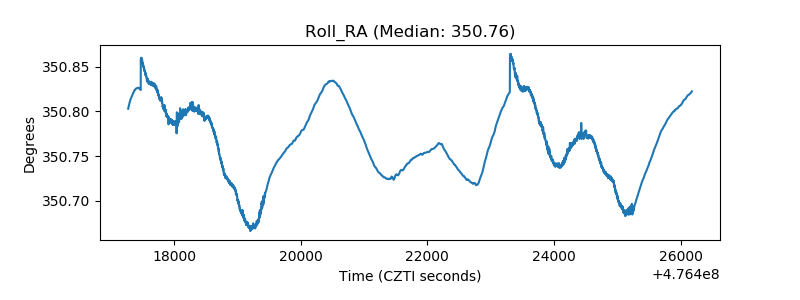 |
| Veto Counter | 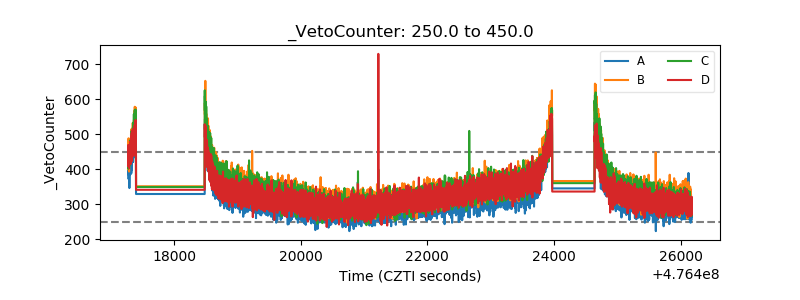 |