| Param | Original file | Final file |
|---|---|---|
| Filename | modeM0/AS1T05_239T01_9000006444_50618cztM0_level2.fits | modeM0/AS1T05_239T01_9000006444_50618cztM0_level2_quad_clean.evt |
| Size (bytes) | 2,381,834,880 | 213,540,480 |
| Size | 2.2 GB | 203.6 MB |
| Events in quadrant A | 11,654,097 | 1,678,379 |
| Events in quadrant B | 24,604,324 | 1,345,528 |
| Events in quadrant C | 31,031,578 | 829,383 |
| Events in quadrant D | 19,429,342 | 1,315,480 |
| Mode M0 | |||
|---|---|---|---|
| Quadrant | BADHDUFLAG | Total packets | Discarded packets |
| A | 0 | 47154 | 2 |
| B | 0 | 86133 | 2 |
| C | 0 | 105338 | 2 |
| D | 0 | 70792 | 3 |
| Mode M9 | |||
|---|---|---|---|
| Quadrant | BADHDUFLAG | Total packets | Discarded packets |
| A | 0 | 11 | 0 |
| B | 0 | 11 | 0 |
| C | 0 | 11 | 0 |
| D | 0 | 11 | 0 |
| Mode SS | |||
|---|---|---|---|
| Quadrant | BADHDUFLAG | Total packets | Discarded packets |
| A | 0 | 376 | 0 |
| B | 0 | 376 | 0 |
| C | 0 | 376 | 0 |
| D | 0 | 376 | 0 |
| Quadrant | Total seconds | Saturated seconds | Saturation percentage |
|---|---|---|---|
| A | 18799 | 597 | 3.175701% |
| B | 18799 | 5496 | 29.235598% |
| C | 18799 | 9854 | 52.417682% |
| D | 18799 | 2866 | 15.245492% |
Noise dominated data is calculated using 1-second bins in cleaned event files. If a bin has >2000 counts, and if more than 50% of those come from <1% of pixels, then it is considered to be noise-dominated and hence unusable.
| Quadrant | # 1 sec bins | Bins with >0 counts | Bins with >2000 counts | High rate bins dominated by noise | Noise dominated (total time) | Noise dominated (detector-on time) | Marked lightcurve |
|---|---|---|---|---|---|---|---|
| A | 19869 | 18800 | 329 | 329 | 1.66% | 1.75% | 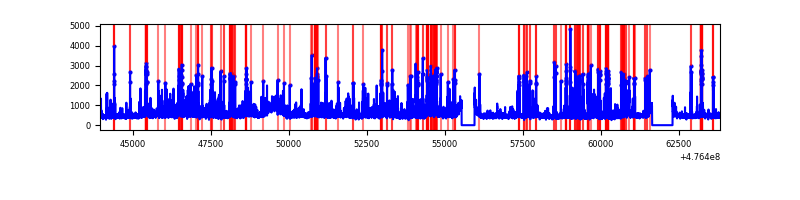 |
| B | 19868 | 18798 | 4706 | 4706 | 23.69% | 25.03% | 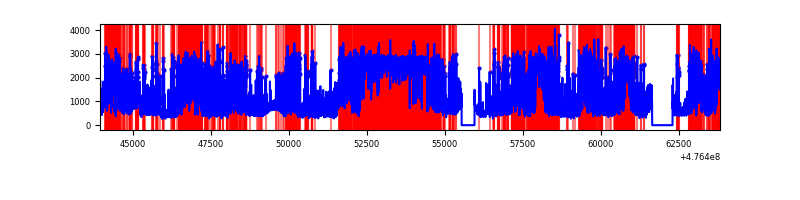 |
| C | 19869 | 18799 | 8239 | 8239 | 41.47% | 43.83% | 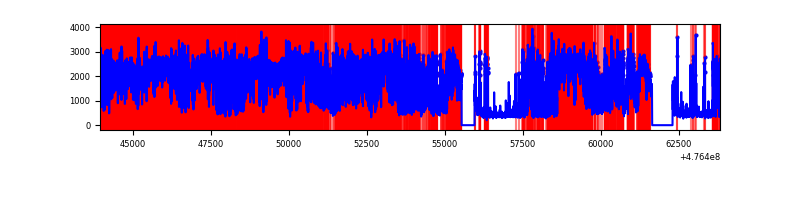 |
| D | 19869 | 18800 | 2680 | 2680 | 13.49% | 14.26% | 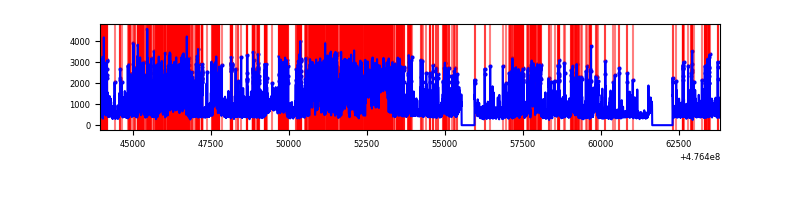 |
Top three noisy pixels from each quadrant. If the there are fewer than three noisy pixels in the level2.evt file, extra rows are filled as -1
| Pixel properties | Quadrant properties | ||||||
|---|---|---|---|---|---|---|---|
| Quadrant | DetID | PixID | Counts | Sigma | Mean | Median | Sigma |
| A | 12 | 250 | 797045 | 1623.75 | 1996 | 1952 | 489.7 |
| A | 4 | 3 | 489291 | 995.25 | 1996 | 1952 | 489.7 |
| A | 4 | 156 | 324895 | 659.52 | 1996 | 1952 | 489.7 |
| B | 4 | 170 | 6417039 | 17271.68 | 1739 | 1677 | 371.4 |
| B | 3 | 249 | 4594478 | 12364.91 | 1739 | 1677 | 371.4 |
| B | 2 | 176 | 2173746 | 5847.72 | 1739 | 1677 | 371.4 |
| C | 15 | 158 | 9467426 | 24228.49 | 1405 | 1393 | 390.7 |
| C | 15 | 157 | 4216432 | 10788.47 | 1405 | 1393 | 390.7 |
| C | 0 | 209 | 3451932 | 8831.72 | 1405 | 1393 | 390.7 |
| D | 7 | 60 | 1817974 | 3566.13 | 1852 | 1795 | 509.3 |
| D | 7 | 126 | 1673922 | 3283.28 | 1852 | 1795 | 509.3 |
| D | 14 | 226 | 859541 | 1684.22 | 1852 | 1795 | 509.3 |
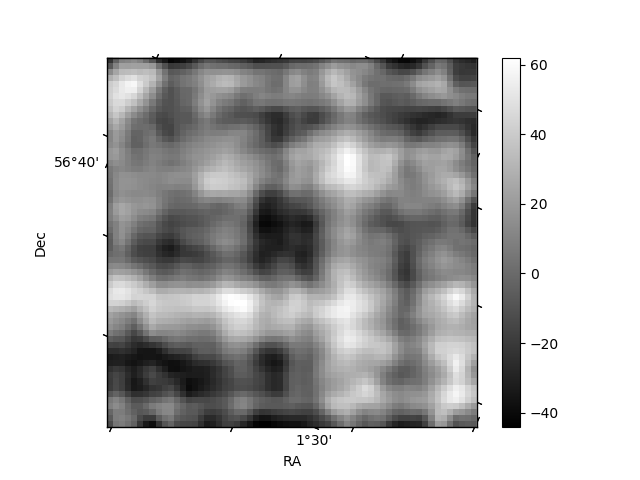
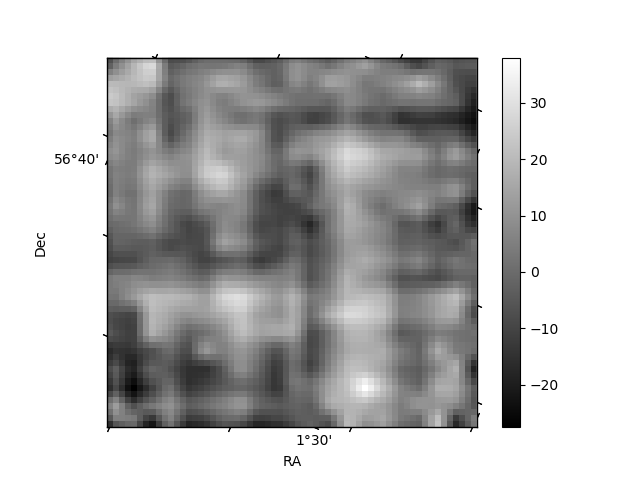
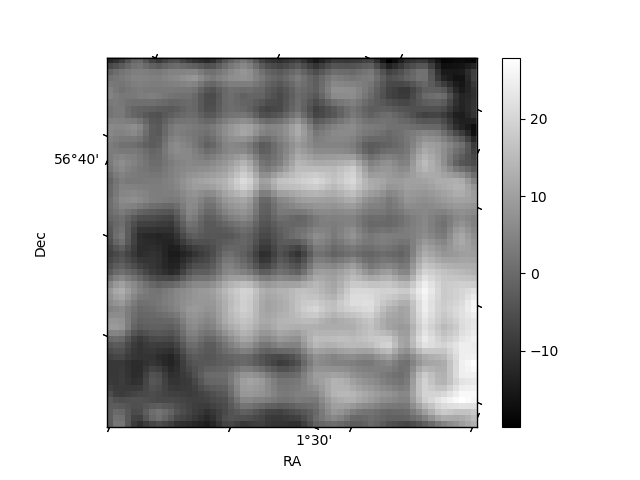
Histogram calculated using DETX and DETY for each event in the final _common_clean file
| Quadrant A | 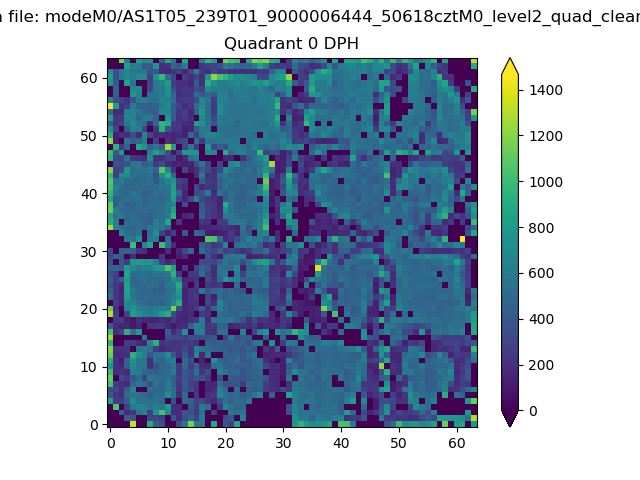 |
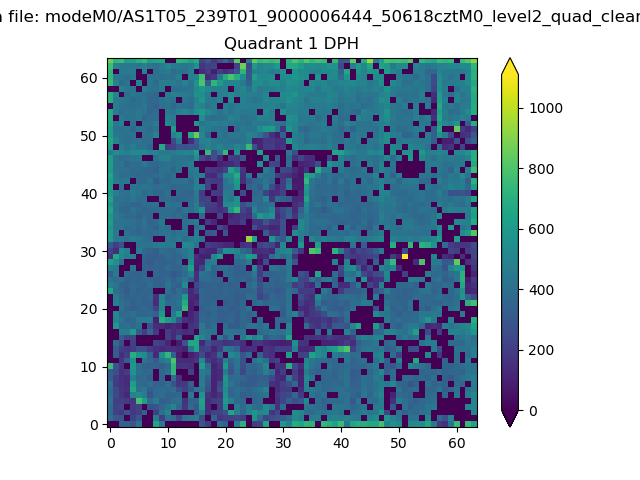 |
Quadrant B |
|---|---|---|---|
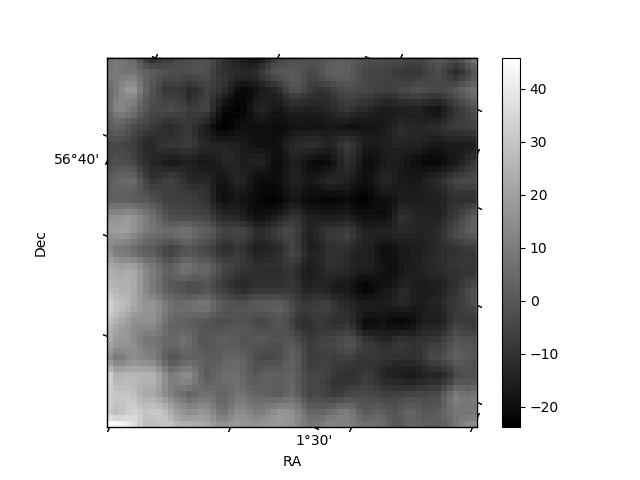
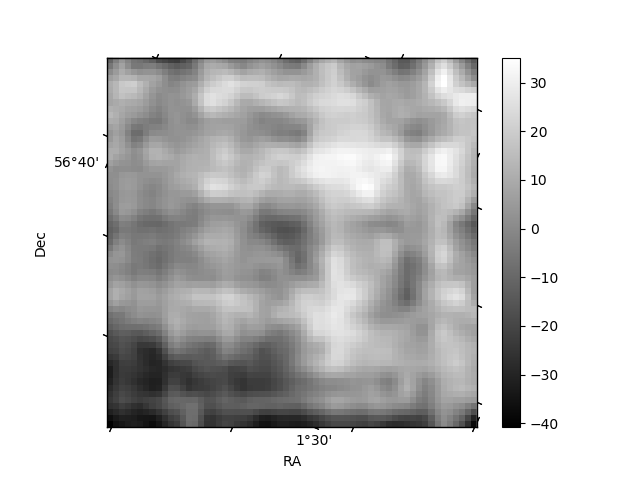
| Quadrant D | 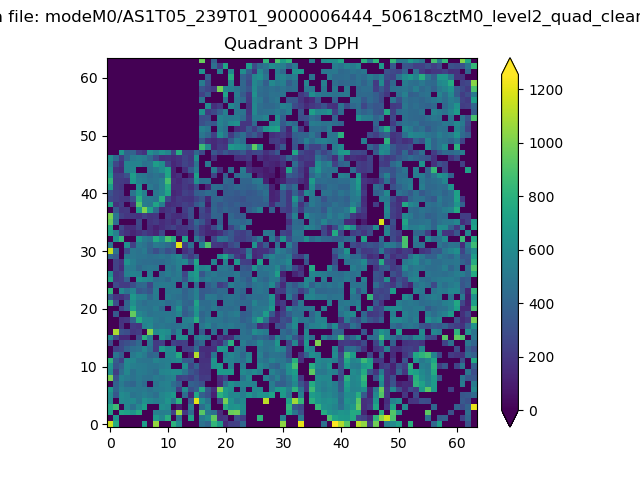 |
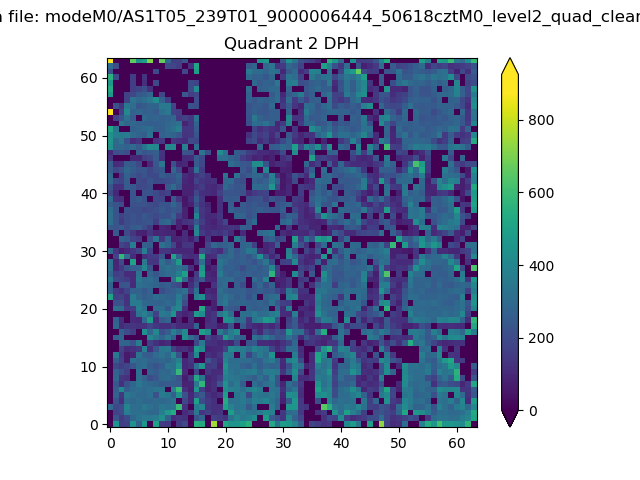 |
Quadrant C |
| Plot type | Count rate plots | Images |
|---|---|---|
| Comparison with Poisson distribution Blue bars denote a histogram of data divided into 1 sec bins. Red curve is a Poisson curve with rate = median count rate of data. |
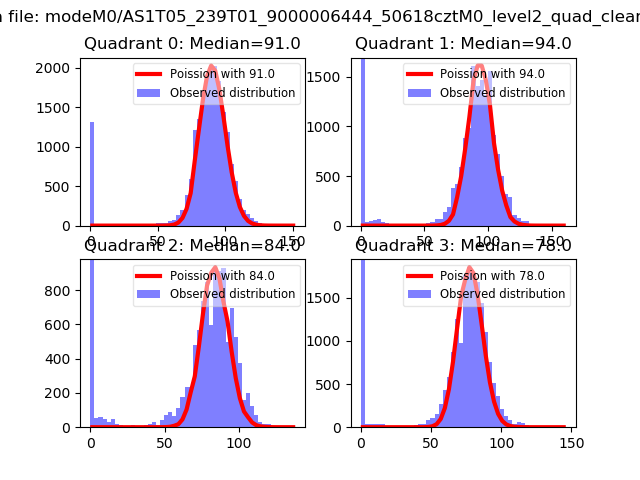 |
 |
| Quadrant-wise count rates Data is divided into 100 sec bins |
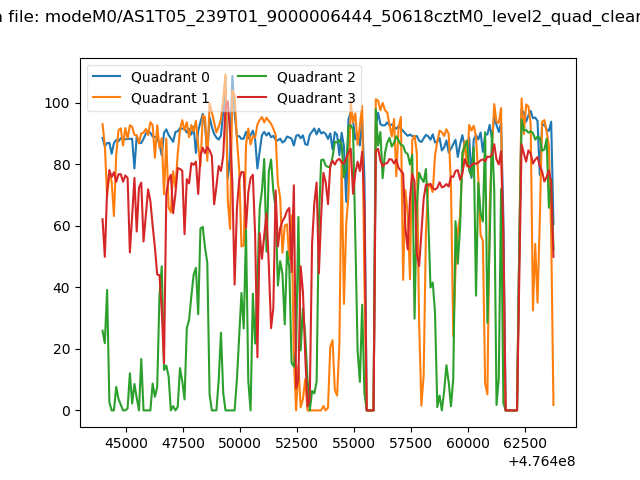 |
|
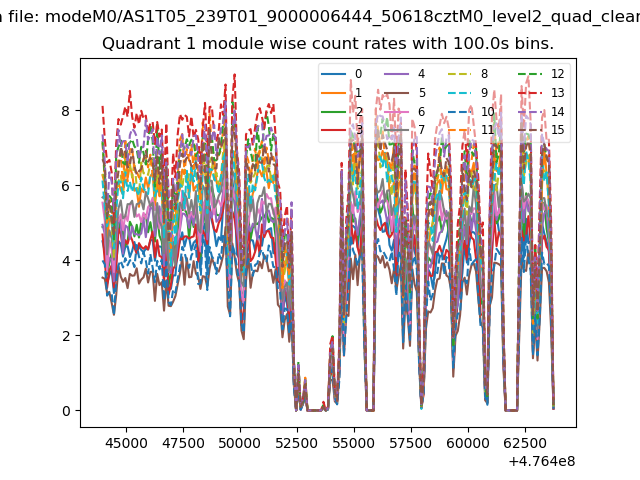
| Module-wise count rates for Quadrant A Data is divided into 100 sec bins |
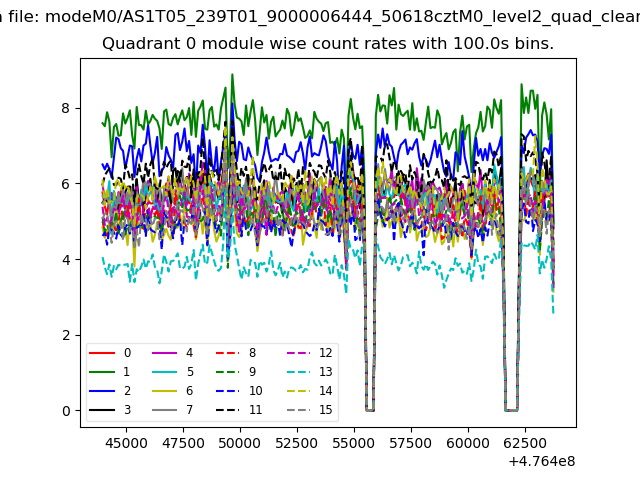 |
 |
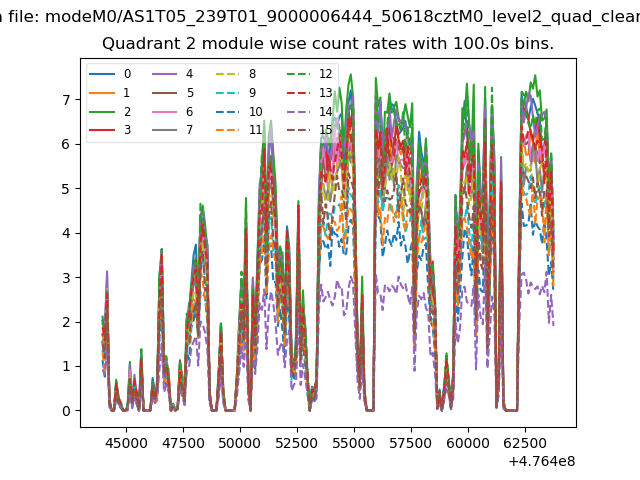
| Module-wise count rates for Quadrant B Data is divided into 100 sec bins |
 |
 |
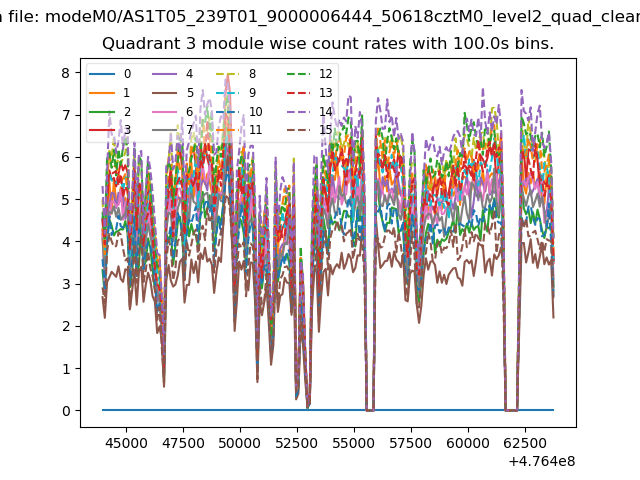
| Module-wise count rates for Quadrant C Data is divided into 100 sec bins |
 |
 |
| Module-wise count rates for Quadrant D Data is divided into 100 sec bins |
 |
 |
| Parameter | Plot |
|---|---|
| CZT HV Monitor | 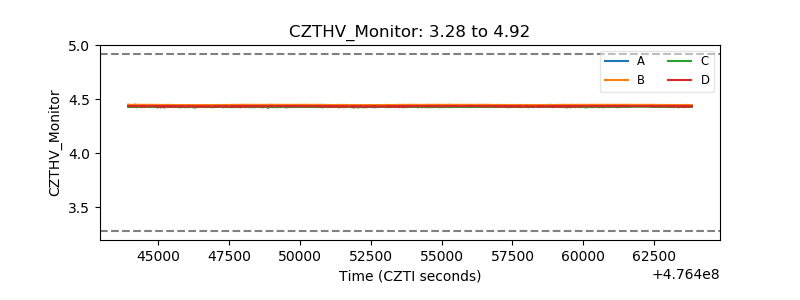 |
| D_VDD | 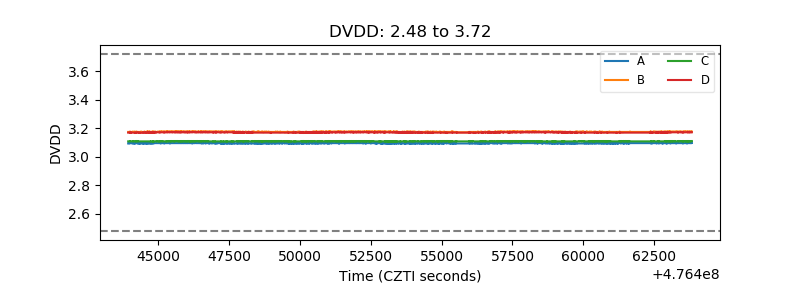 |
| Temperature 1 | 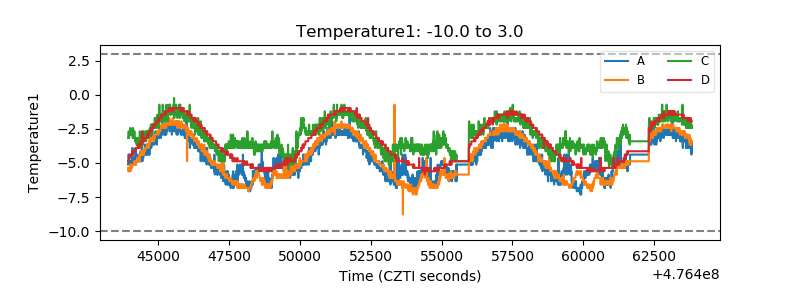 |
| Veto HV Monitor | 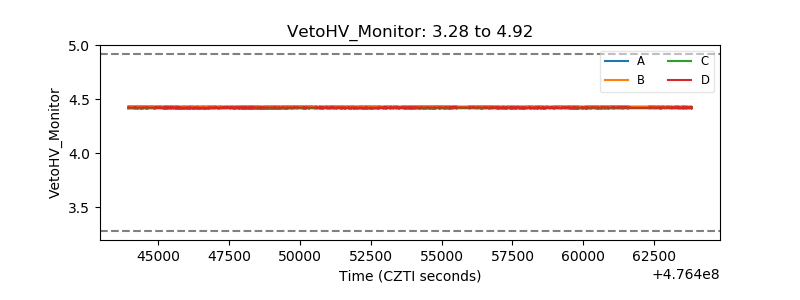 |
| Veto LLD | 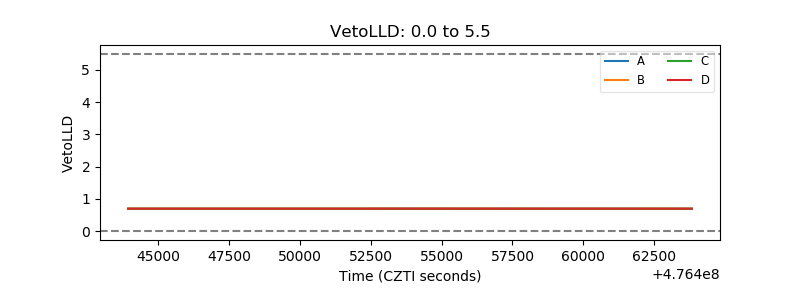 |
| Alpha Counter | 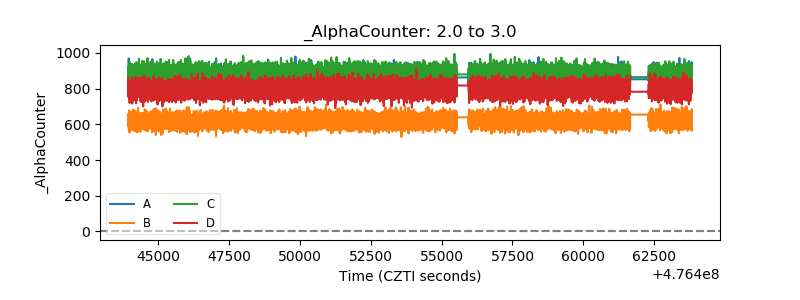 |
| _CPM_Rate | 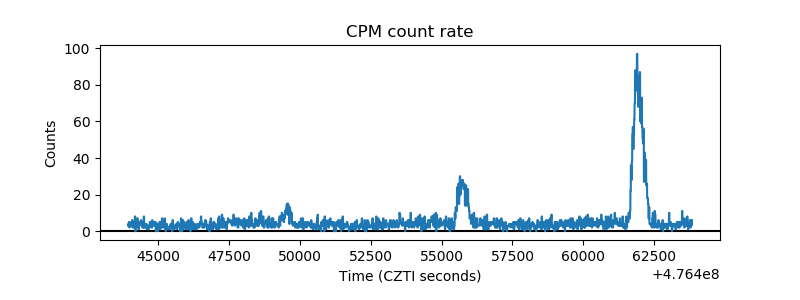 |
| CZT Counter | 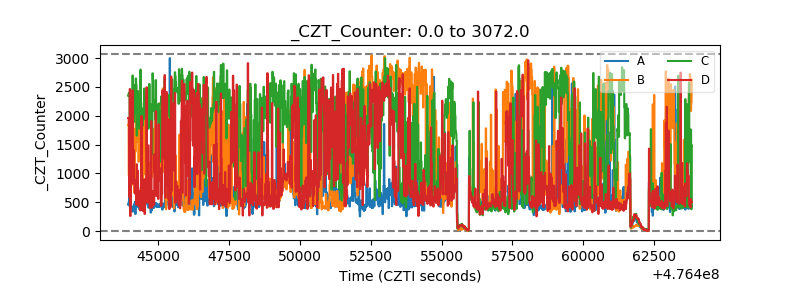 |
| +2.5 Volts monitor |  |
| +5 Volts monitor | 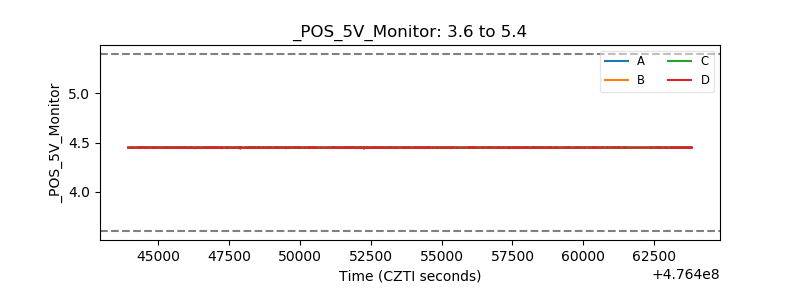 |
| _ROLL_ROT | 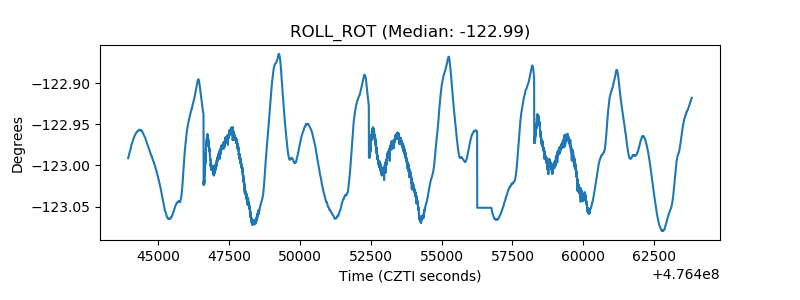 |
| _Roll_DEC | 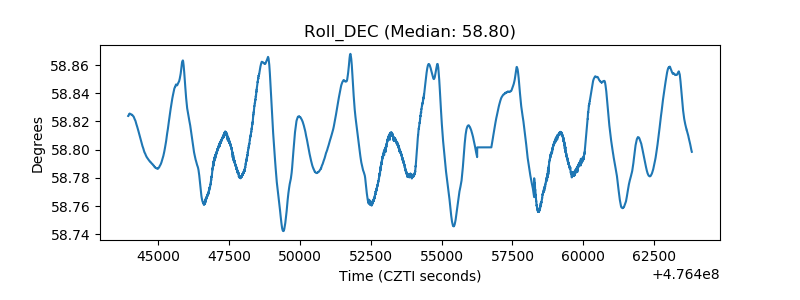 |
| _Roll_RA | 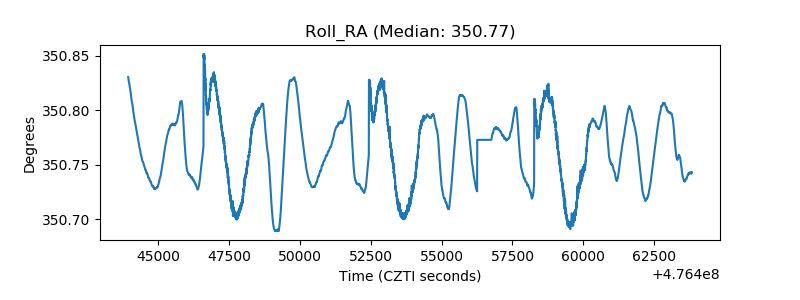 |
| Veto Counter | 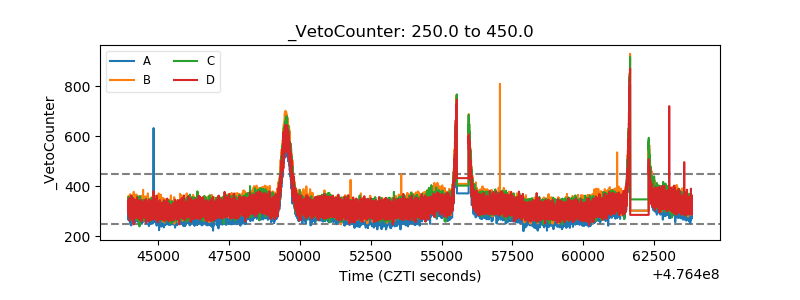 |