| Param | Original file | Final file |
|---|---|---|
| Filename | modeM0/AS1T05_239T01_9000006444_50619cztM0_level2.fits | modeM0/AS1T05_239T01_9000006444_50619cztM0_level2_quad_clean.evt |
| Size (bytes) | 591,275,520 | 82,437,120 |
| Size | 563.9 MB | 78.6 MB |
| Events in quadrant A | 3,945,862 | 565,105 |
| Events in quadrant B | 8,463,493 | 467,732 |
| Events in quadrant C | 4,622,538 | 519,433 |
| Events in quadrant D | 4,373,109 | 509,791 |
| Mode M0 | |||
|---|---|---|---|
| Quadrant | BADHDUFLAG | Total packets | Discarded packets |
| A | 0 | 16072 | 1 |
| B | 0 | 29427 | 1 |
| C | 0 | 18112 | 5 |
| D | 0 | 17385 | 1 |
| Mode M9 | |||
|---|---|---|---|
| Quadrant | BADHDUFLAG | Total packets | Discarded packets |
| A | 0 | 9 | 0 |
| B | 0 | 9 | 0 |
| C | 0 | 9 | 0 |
| D | 0 | 9 | 0 |
| Mode SS | |||
|---|---|---|---|
| Quadrant | BADHDUFLAG | Total packets | Discarded packets |
| A | 0 | 126 | 0 |
| B | 0 | 126 | 0 |
| C | 0 | 126 | 0 |
| D | 0 | 126 | 0 |
| Quadrant | Total seconds | Saturated seconds | Saturation percentage |
|---|---|---|---|
| A | 6216 | 266 | 4.279279% |
| B | 6216 | 1862 | 29.954955% |
| C | 6215 | 518 | 8.334674% |
| D | 6216 | 240 | 3.861004% |
Noise dominated data is calculated using 1-second bins in cleaned event files. If a bin has >2000 counts, and if more than 50% of those come from <1% of pixels, then it is considered to be noise-dominated and hence unusable.
| Quadrant | # 1 sec bins | Bins with >0 counts | Bins with >2000 counts | High rate bins dominated by noise | Noise dominated (total time) | Noise dominated (detector-on time) | Marked lightcurve |
|---|---|---|---|---|---|---|---|
| A | 7066 | 6216 | 215 | 215 | 3.04% | 3.46% | 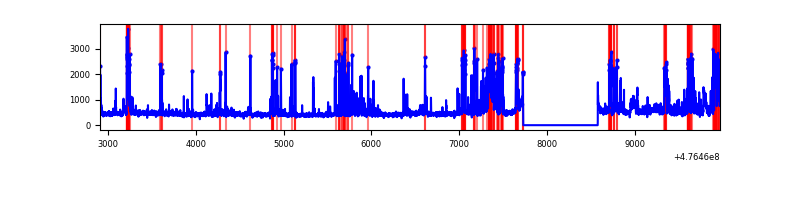 |
| B | 7066 | 6216 | 1661 | 1661 | 23.51% | 26.72% | 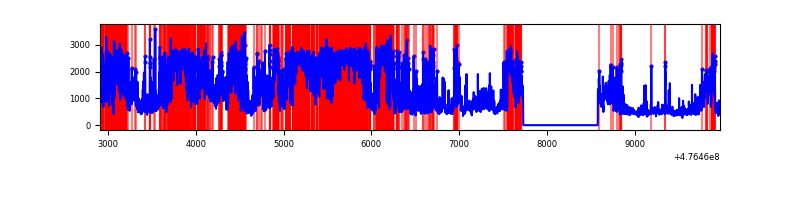 |
| C | 7064 | 6214 | 373 | 373 | 5.28% | 6.00% | 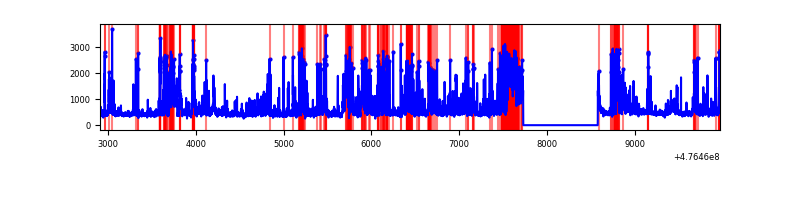 |
| D | 7066 | 6216 | 212 | 212 | 3.00% | 3.41% | 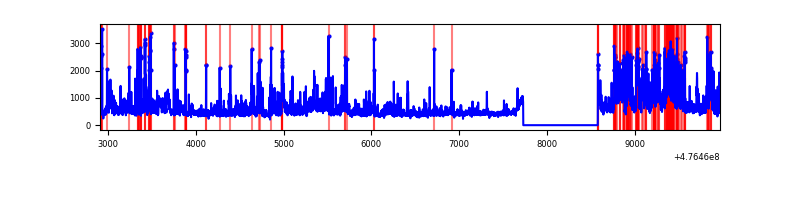 |
Top three noisy pixels from each quadrant. If the there are fewer than three noisy pixels in the level2.evt file, extra rows are filled as -1
| Pixel properties | Quadrant properties | ||||||
|---|---|---|---|---|---|---|---|
| Quadrant | DetID | PixID | Counts | Sigma | Mean | Median | Sigma |
| A | 6 | 161 | 275072 | 1706.56 | 644 | 627 | 160.8 |
| A | 8 | 247 | 216822 | 1344.35 | 644 | 627 | 160.8 |
| A | 3 | 130 | 164689 | 1020.17 | 644 | 627 | 160.8 |
| B | 3 | 249 | 3019424 | 24775.02 | 573 | 554 | 121.9 |
| B | 4 | 170 | 2164427 | 17758.3 | 573 | 554 | 121.9 |
| B | 2 | 176 | 470210 | 3854.34 | 573 | 554 | 121.9 |
| C | 15 | 158 | 584206 | 3386.21 | 619 | 613 | 172.3 |
| C | 15 | 174 | 374911 | 2171.8 | 619 | 613 | 172.3 |
| C | 15 | 147 | 198040 | 1145.54 | 619 | 613 | 172.3 |
| D | 2 | 165 | 776905 | 4474.48 | 627 | 605 | 173.5 |
| D | 2 | 249 | 148122 | 850.27 | 627 | 605 | 173.5 |
| D | 7 | 77 | 137142 | 786.98 | 627 | 605 | 173.5 |
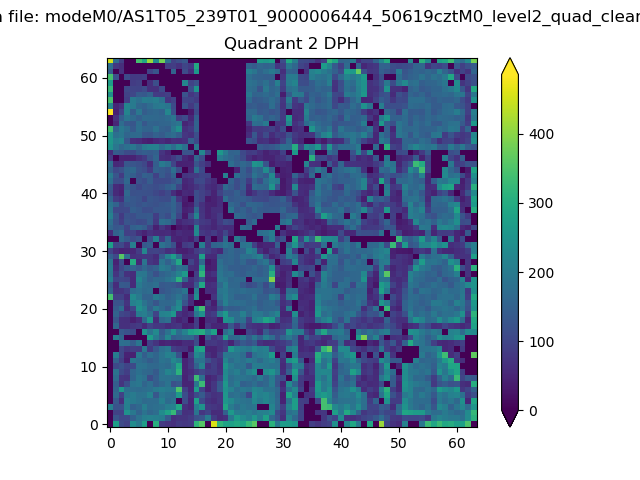
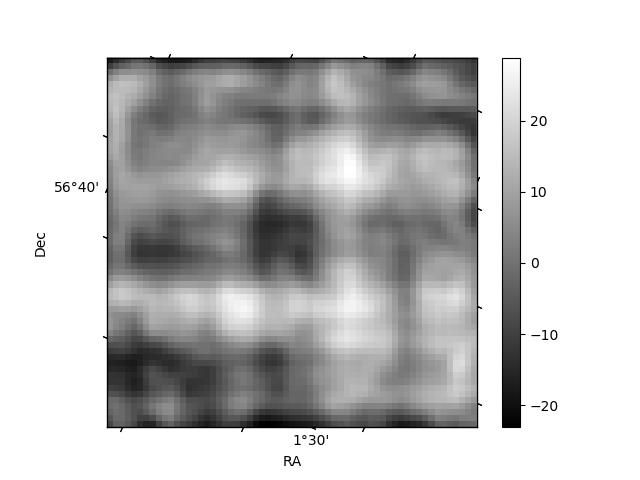
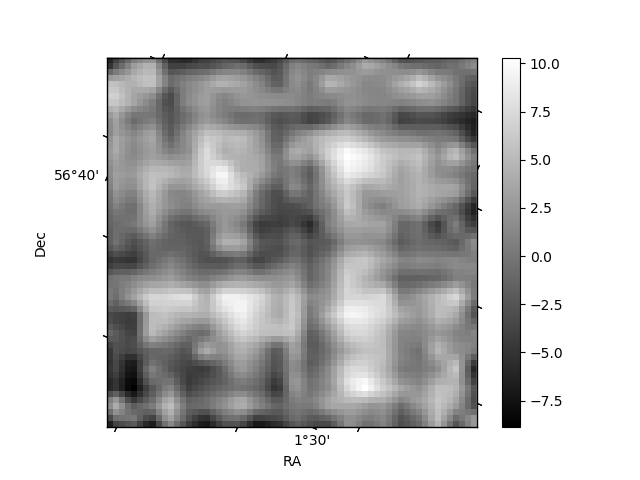
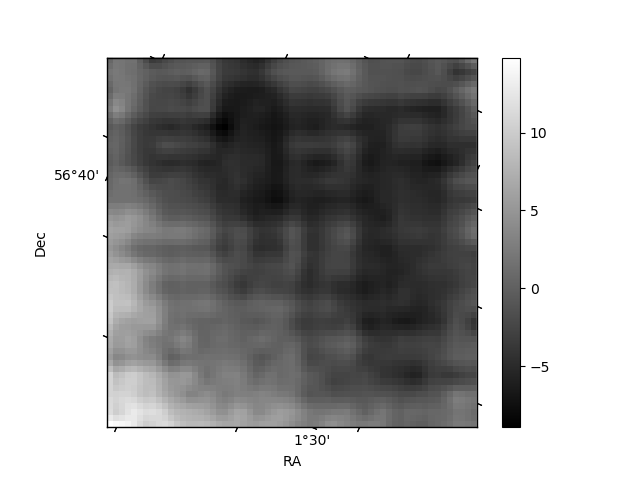
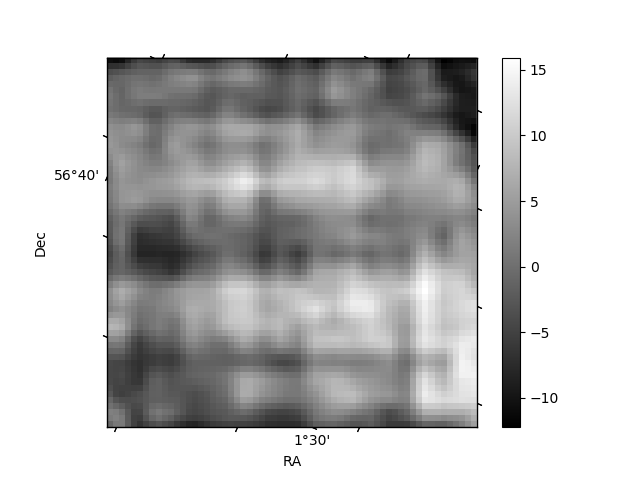
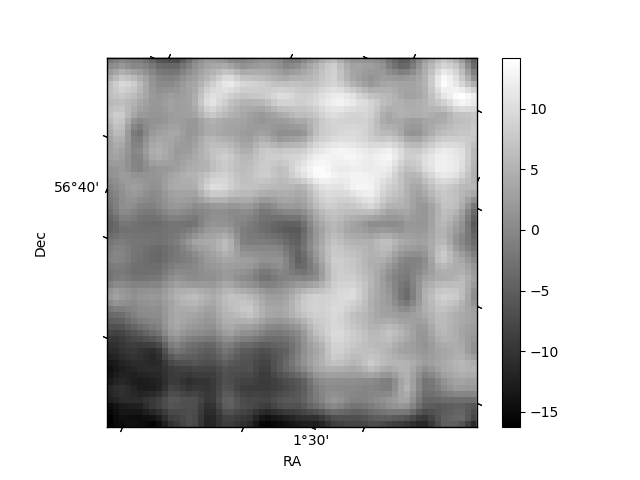
Histogram calculated using DETX and DETY for each event in the final _common_clean file
| Quadrant A | 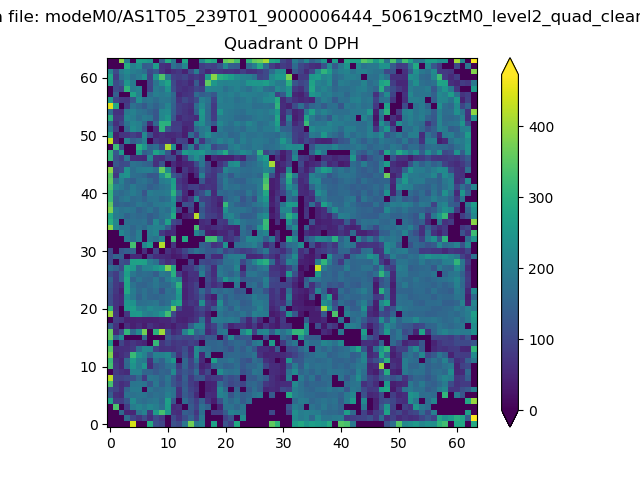 |
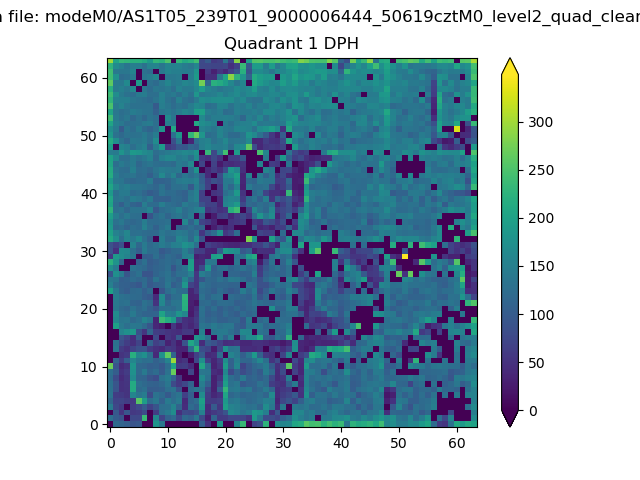 |
Quadrant B |
|---|---|---|---|
| Quadrant D | 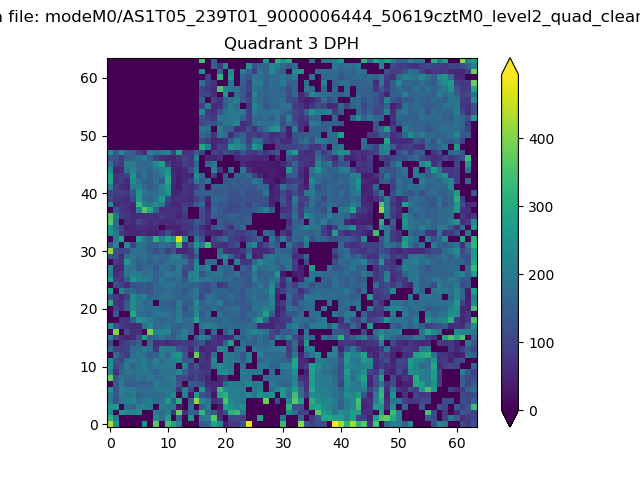 |
 |
Quadrant C |
| Plot type | Count rate plots | Images |
|---|---|---|
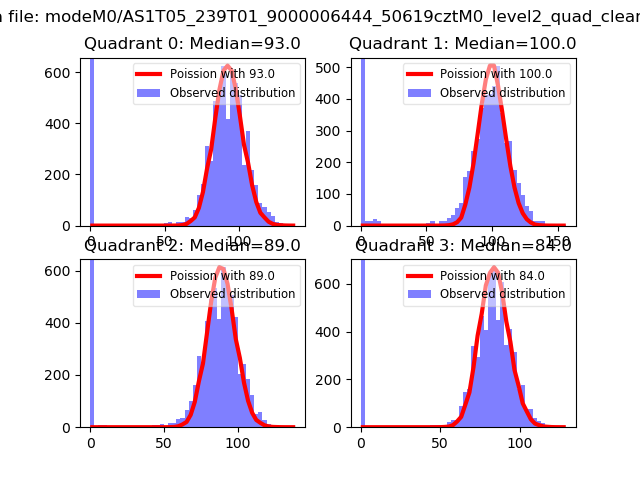
| Comparison with Poisson distribution Blue bars denote a histogram of data divided into 1 sec bins. Red curve is a Poisson curve with rate = median count rate of data. |
 |
 |
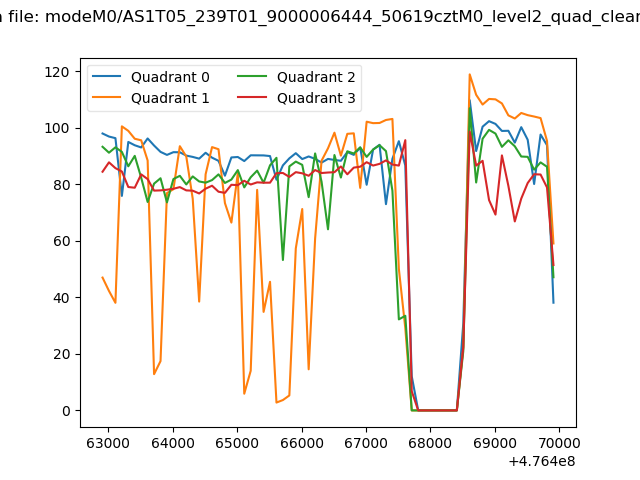
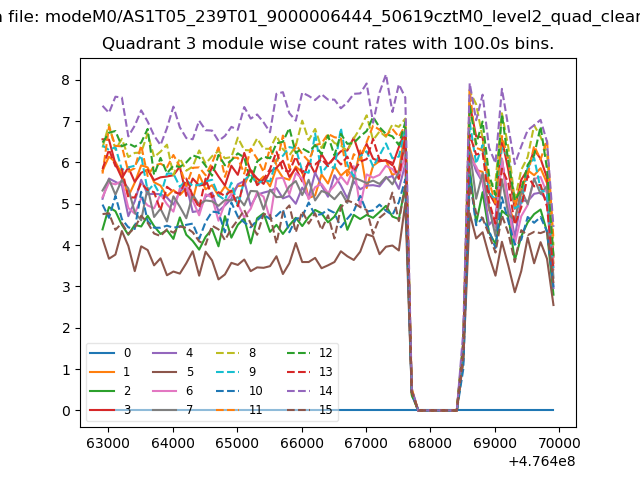
| Quadrant-wise count rates Data is divided into 100 sec bins |
 |
|
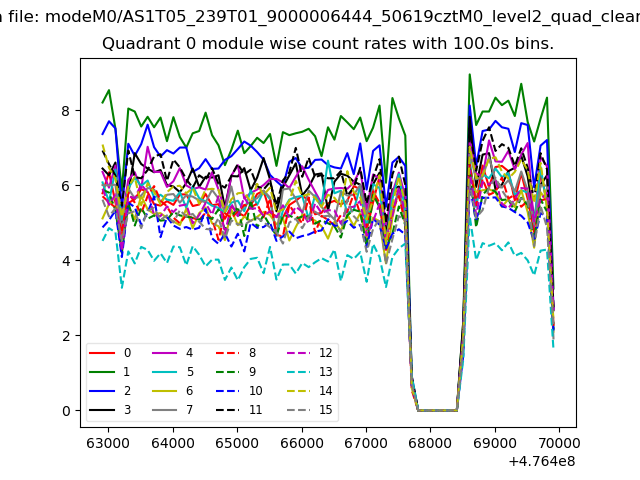
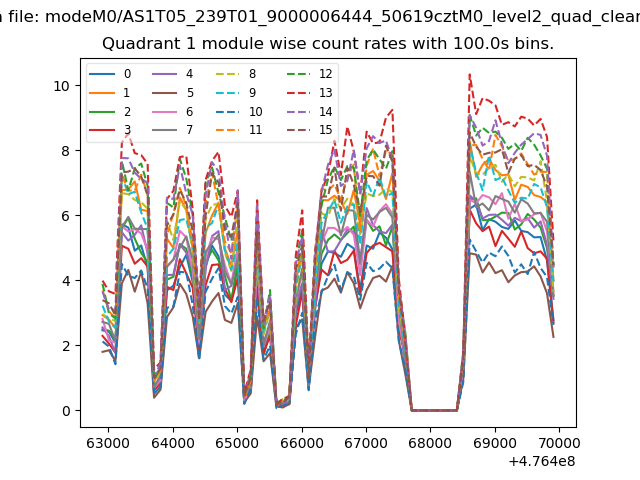
| Module-wise count rates for Quadrant A Data is divided into 100 sec bins |
 |
 |
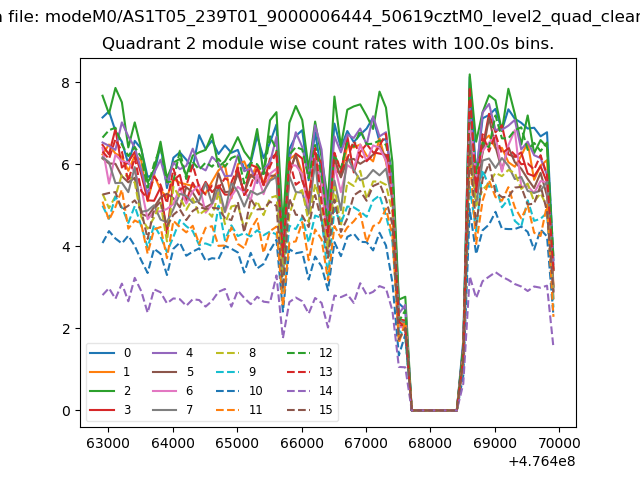
| Module-wise count rates for Quadrant B Data is divided into 100 sec bins |
 |
 |
| Module-wise count rates for Quadrant C Data is divided into 100 sec bins |
 |
 |
| Module-wise count rates for Quadrant D Data is divided into 100 sec bins |
 |
 |
| Parameter | Plot |
|---|---|
| CZT HV Monitor |  |
| D_VDD | 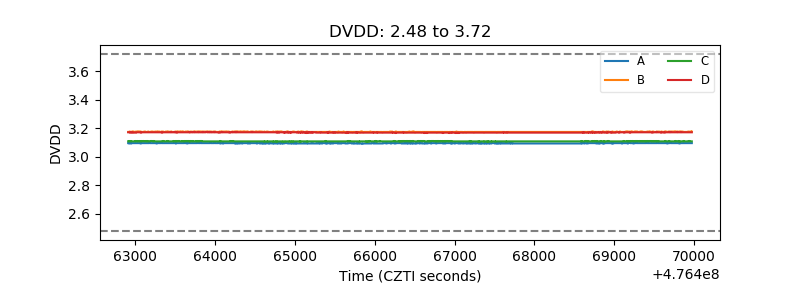 |
| Temperature 1 | 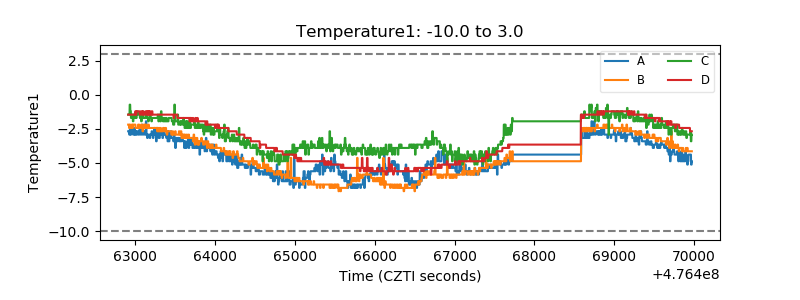 |
| Veto HV Monitor | 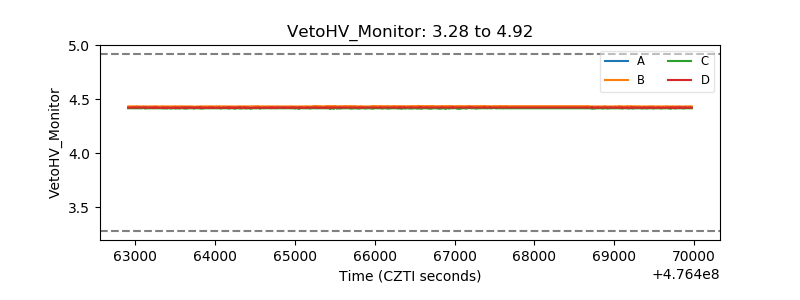 |
| Veto LLD | 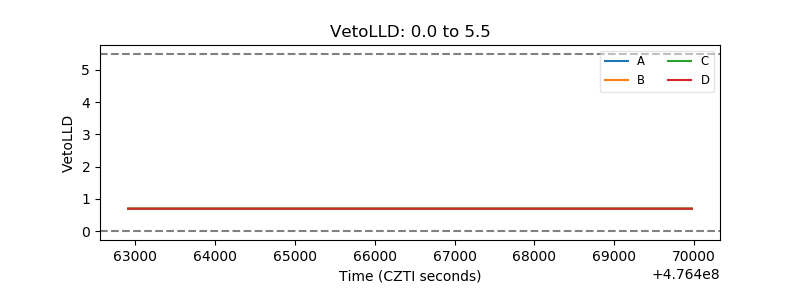 |
| Alpha Counter | 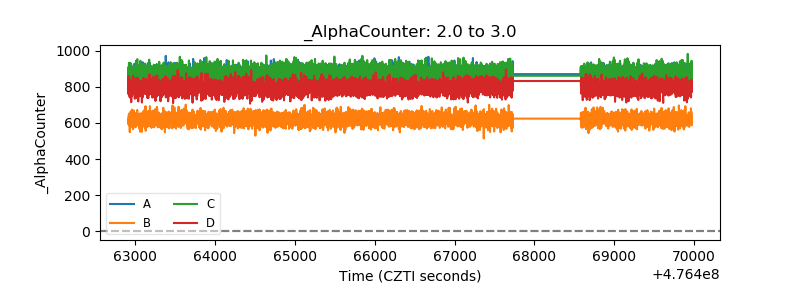 |
| _CPM_Rate | 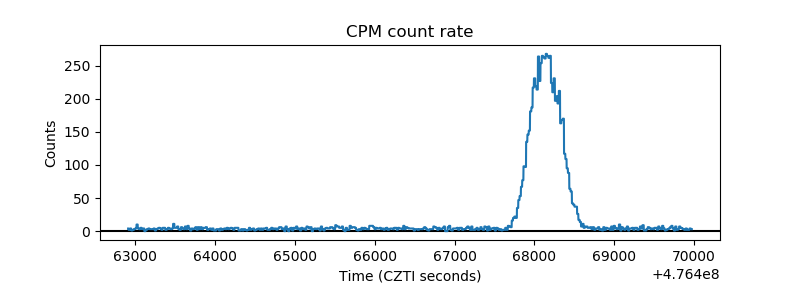 |
| CZT Counter | 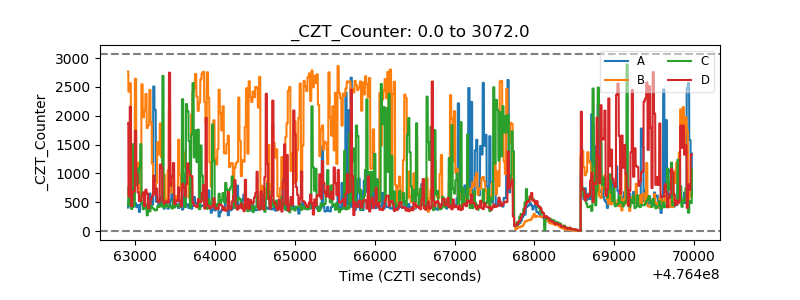 |
| +2.5 Volts monitor |  |
| +5 Volts monitor |  |
| _ROLL_ROT | 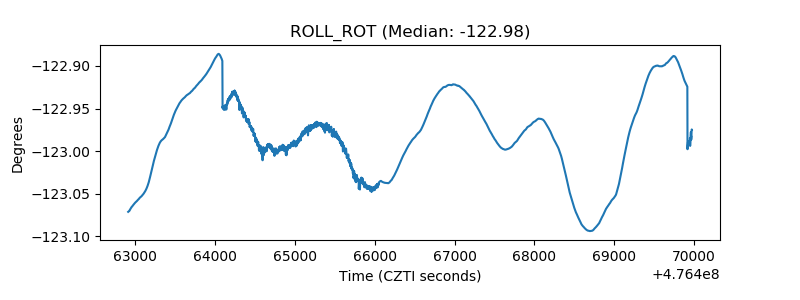 |
| _Roll_DEC | 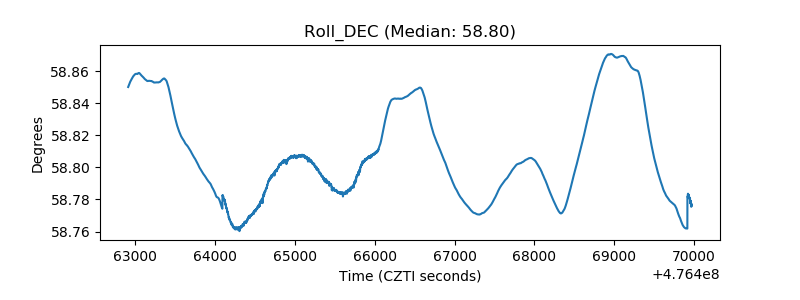 |
| _Roll_RA | 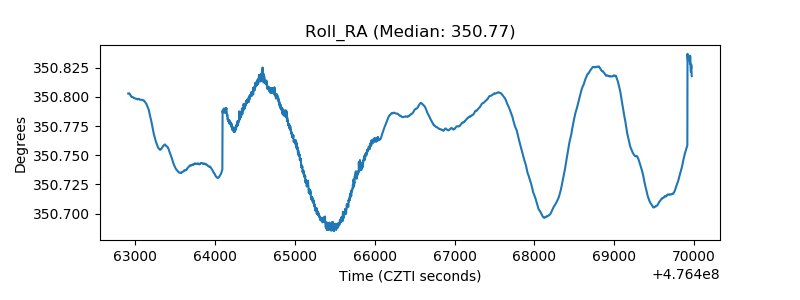 |
| Veto Counter | 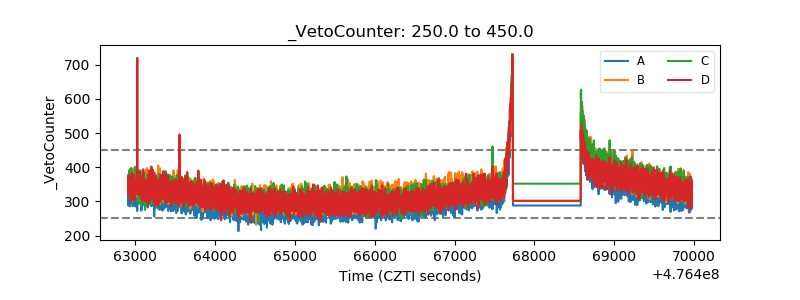 |