| Param | Original file | Final file |
|---|---|---|
| Filename | modeM0/AS1T05_239T01_9000006444_50621cztM0_level2.fits | modeM0/AS1T05_239T01_9000006444_50621cztM0_level2_quad_clean.evt |
| Size (bytes) | 562,645,440 | 94,746,240 |
| Size | 536.6 MB | 90.4 MB |
| Events in quadrant A | 4,389,642 | 621,426 |
| Events in quadrant B | 6,237,940 | 650,313 |
| Events in quadrant C | 4,226,725 | 591,394 |
| Events in quadrant D | 5,456,736 | 540,790 |
| Mode M0 | |||
|---|---|---|---|
| Quadrant | BADHDUFLAG | Total packets | Discarded packets |
| A | 0 | 17688 | 3 |
| B | 0 | 23169 | 2 |
| C | 0 | 17185 | 2 |
| D | 0 | 21056 | 2 |
| Mode M9 | |||
|---|---|---|---|
| Quadrant | BADHDUFLAG | Total packets | Discarded packets |
| A | 0 | 10 | 0 |
| B | 0 | 10 | 0 |
| C | 0 | 10 | 0 |
| D | 0 | 10 | 0 |
| Mode SS | |||
|---|---|---|---|
| Quadrant | BADHDUFLAG | Total packets | Discarded packets |
| A | 0 | 136 | 0 |
| B | 0 | 136 | 0 |
| C | 0 | 136 | 0 |
| D | 0 | 136 | 0 |
| Quadrant | Total seconds | Saturated seconds | Saturation percentage |
|---|---|---|---|
| A | 6662 | 242 | 3.632543% |
| B | 6663 | 584 | 8.764821% |
| C | 6663 | 312 | 4.682575% |
| D | 6663 | 476 | 7.143929% |
Noise dominated data is calculated using 1-second bins in cleaned event files. If a bin has >2000 counts, and if more than 50% of those come from <1% of pixels, then it is considered to be noise-dominated and hence unusable.
| Quadrant | # 1 sec bins | Bins with >0 counts | Bins with >2000 counts | High rate bins dominated by noise | Noise dominated (total time) | Noise dominated (detector-on time) | Marked lightcurve |
|---|---|---|---|---|---|---|---|
| A | 7657 | 6663 | 192 | 192 | 2.51% | 2.88% | 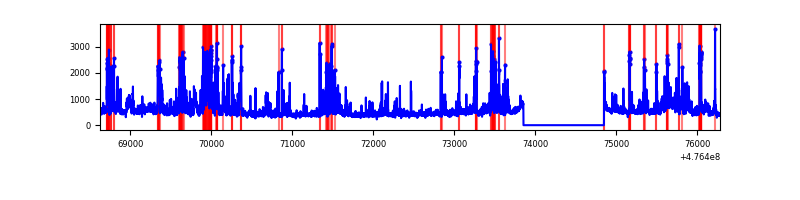 |
| B | 7658 | 6663 | 424 | 424 | 5.54% | 6.36% | 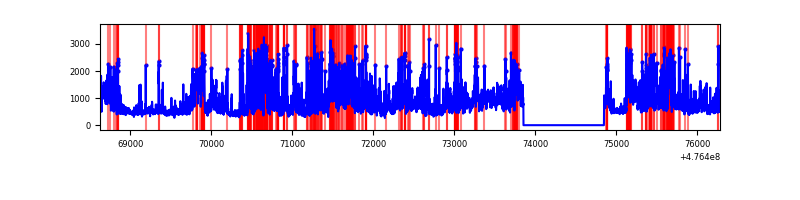 |
| C | 7658 | 6663 | 267 | 267 | 3.49% | 4.01% | 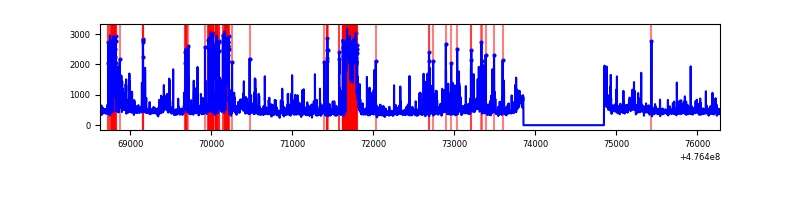 |
| D | 7658 | 6663 | 424 | 424 | 5.54% | 6.36% | 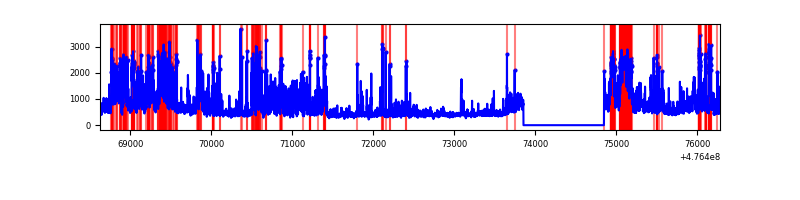 |
Top three noisy pixels from each quadrant. If the there are fewer than three noisy pixels in the level2.evt file, extra rows are filled as -1
| Pixel properties | Quadrant properties | ||||||
|---|---|---|---|---|---|---|---|
| Quadrant | DetID | PixID | Counts | Sigma | Mean | Median | Sigma |
| A | 8 | 247 | 432316 | 2494.18 | 701 | 683 | 173.1 |
| A | 9 | 96 | 213951 | 1232.36 | 701 | 683 | 173.1 |
| A | 3 | 130 | 201612 | 1161.06 | 701 | 683 | 173.1 |
| B | 4 | 170 | 1776094 | 12178.41 | 687 | 663 | 145.8 |
| B | 2 | 176 | 550549 | 3771.89 | 687 | 663 | 145.8 |
| B | 3 | 249 | 472126 | 3233.96 | 687 | 663 | 145.8 |
| C | 15 | 199 | 347841 | 1795.22 | 690 | 682 | 193.4 |
| C | 0 | 177 | 338705 | 1747.97 | 690 | 682 | 193.4 |
| C | 15 | 174 | 136370 | 701.66 | 690 | 682 | 193.4 |
| D | 2 | 165 | 1047636 | 5636.38 | 676 | 656 | 185.8 |
| D | 8 | 246 | 442153 | 2376.78 | 676 | 656 | 185.8 |
| D | 6 | 42 | 202405 | 1086.11 | 676 | 656 | 185.8 |
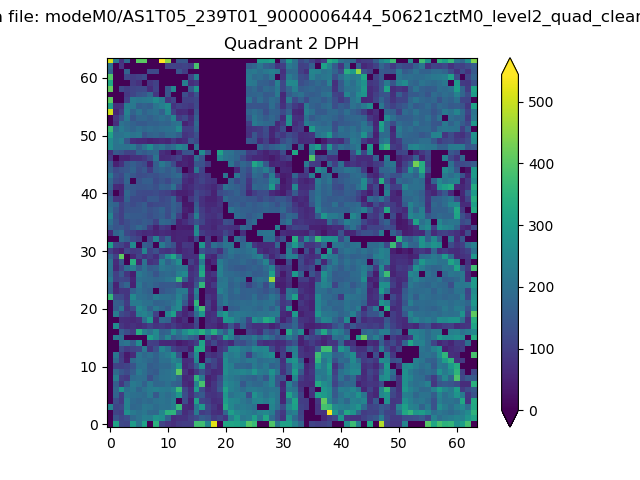
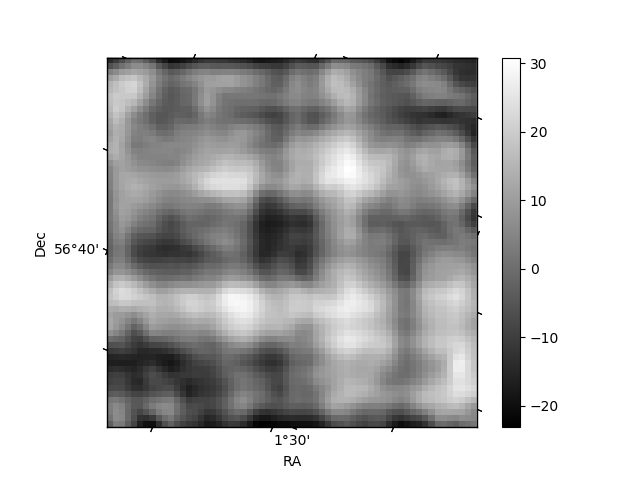
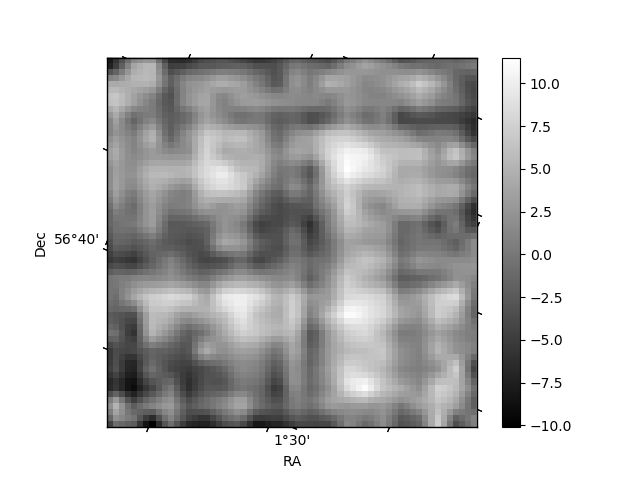
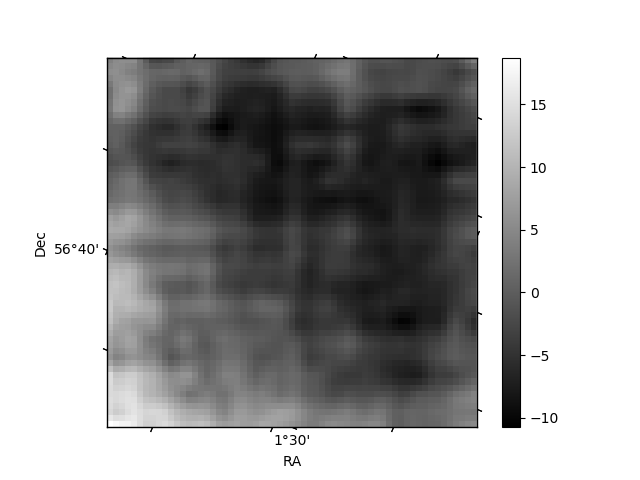
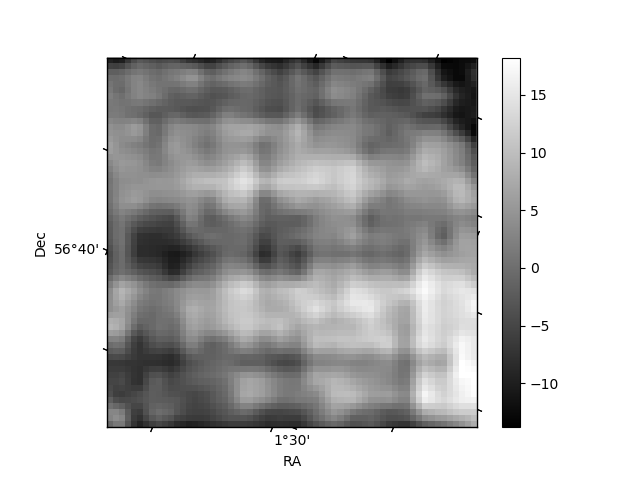
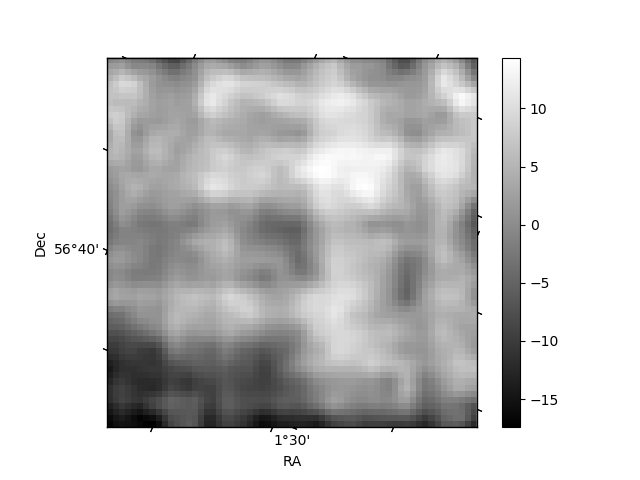
Histogram calculated using DETX and DETY for each event in the final _common_clean file
| Quadrant A | 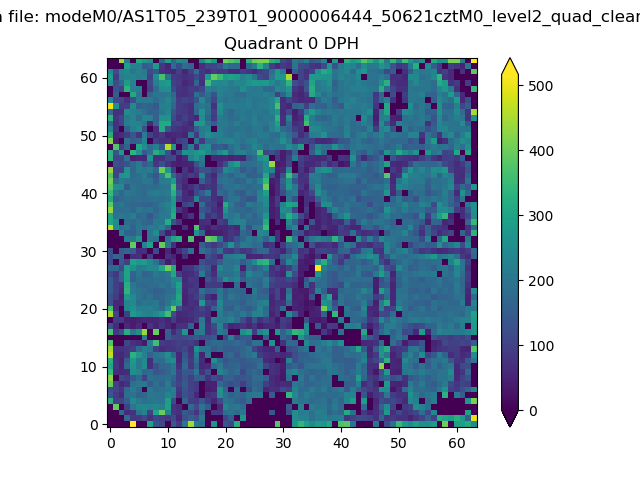 |
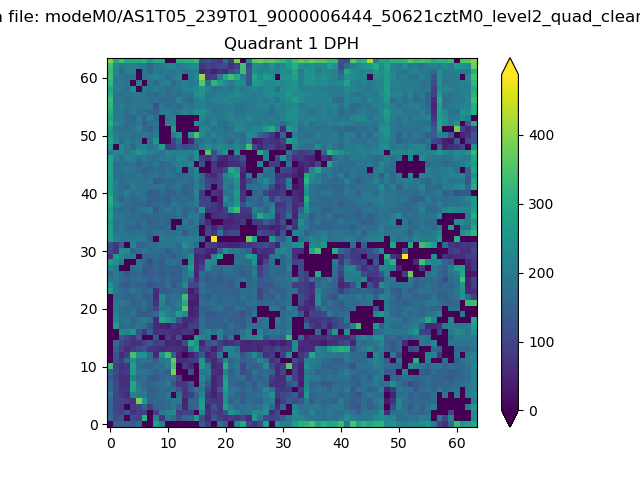 |
Quadrant B |
|---|---|---|---|
| Quadrant D | 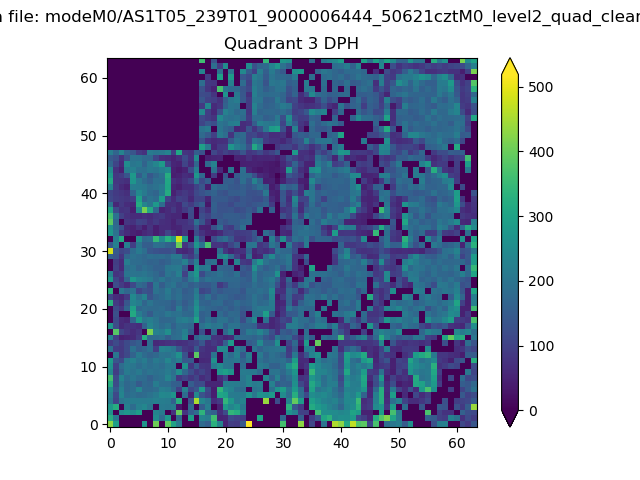 |
 |
Quadrant C |
| Plot type | Count rate plots | Images |
|---|---|---|
| Comparison with Poisson distribution Blue bars denote a histogram of data divided into 1 sec bins. Red curve is a Poisson curve with rate = median count rate of data. |
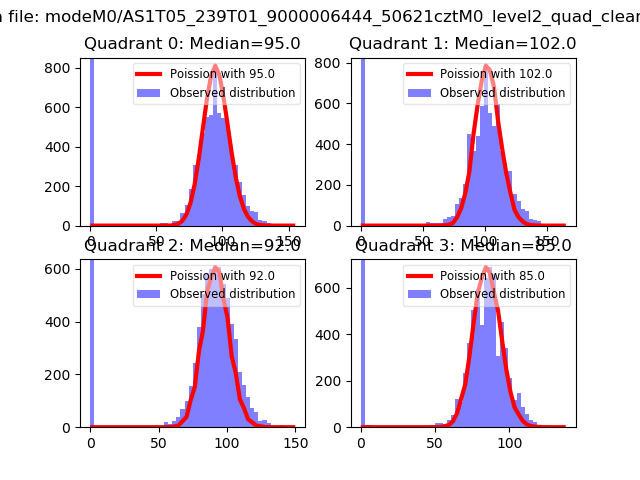 |
 |
| Quadrant-wise count rates Data is divided into 100 sec bins |
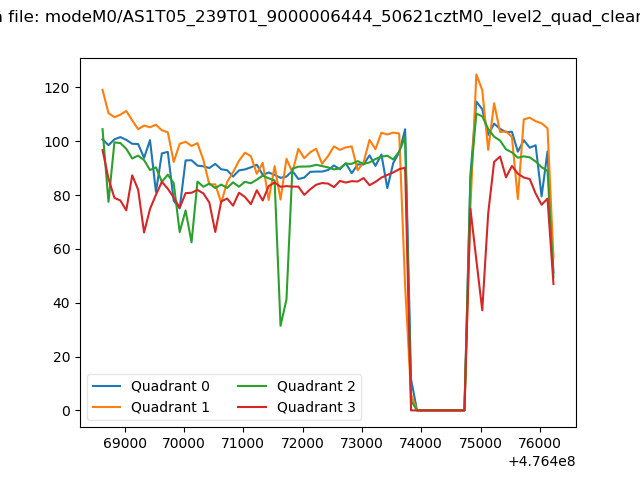 |
|
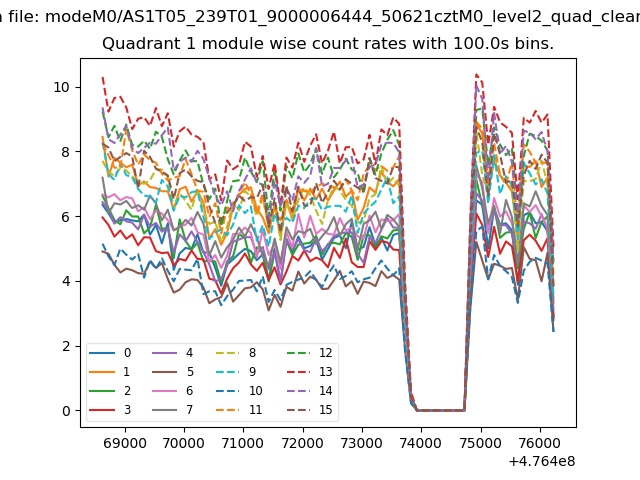
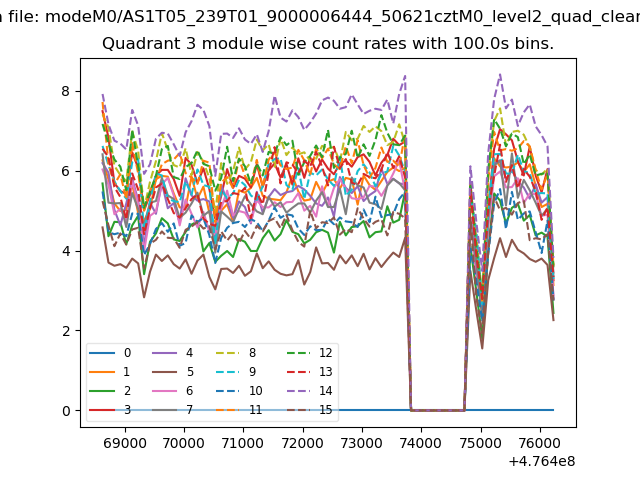
| Module-wise count rates for Quadrant A Data is divided into 100 sec bins |
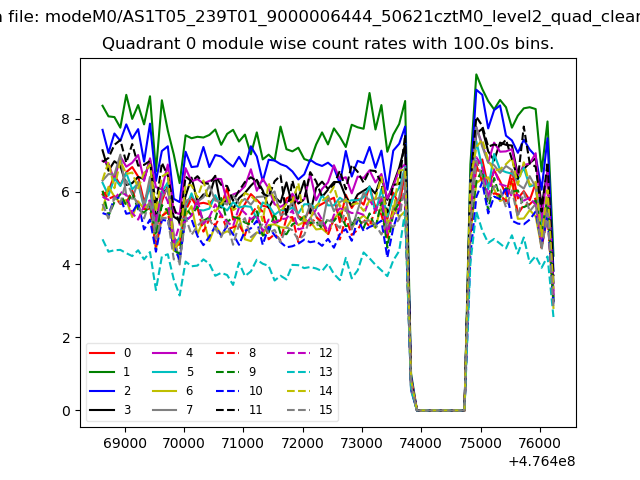 |
 |
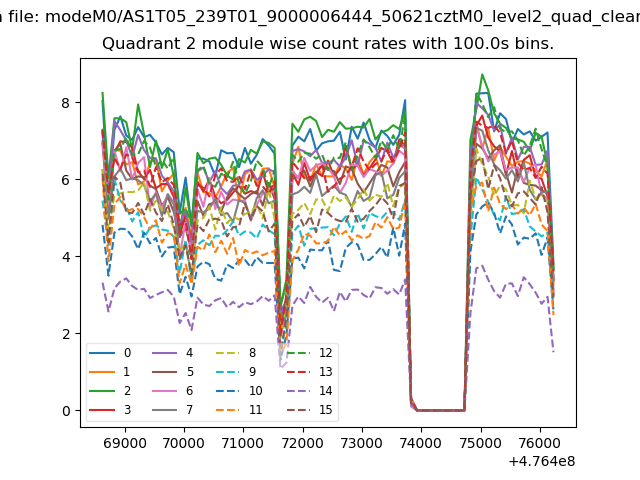
| Module-wise count rates for Quadrant B Data is divided into 100 sec bins |
 |
 |
| Module-wise count rates for Quadrant C Data is divided into 100 sec bins |
 |
 |
| Module-wise count rates for Quadrant D Data is divided into 100 sec bins |
 |
 |
| Parameter | Plot |
|---|---|
| CZT HV Monitor | 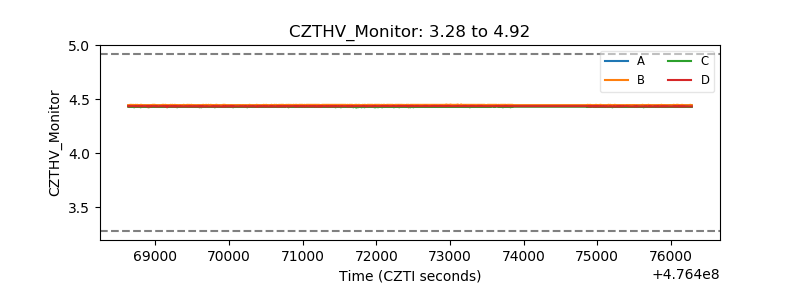 |
| D_VDD | 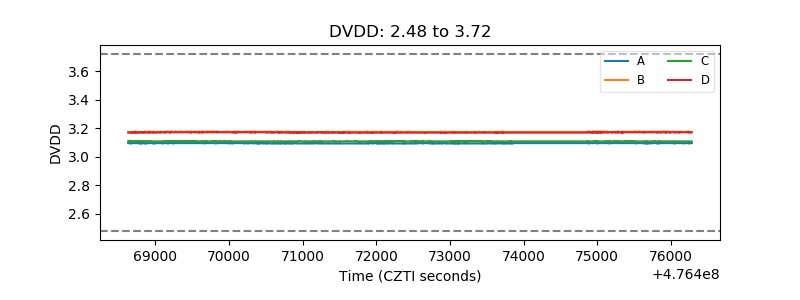 |
| Temperature 1 | 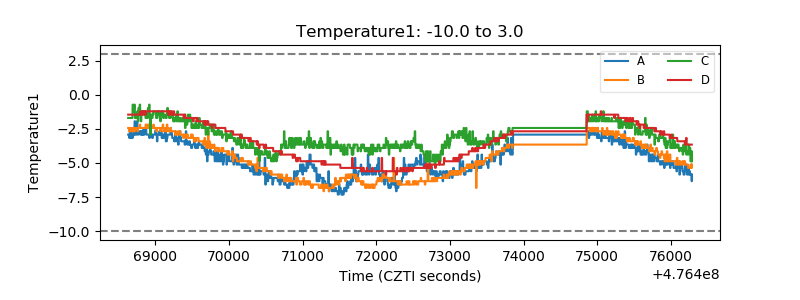 |
| Veto HV Monitor | 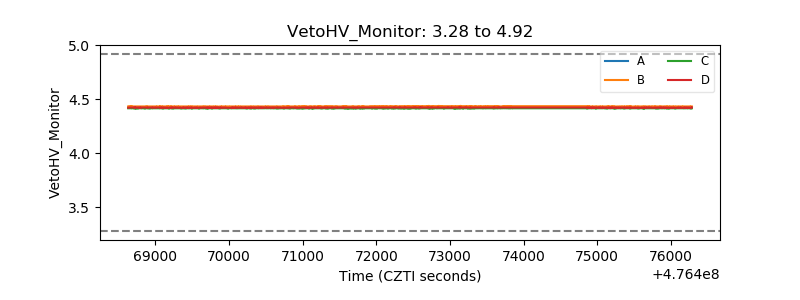 |
| Veto LLD | 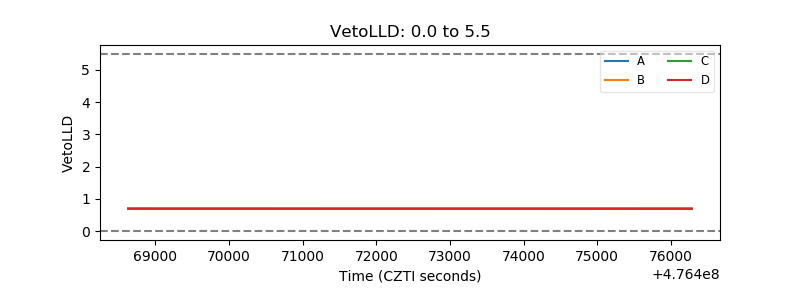 |
| Alpha Counter | 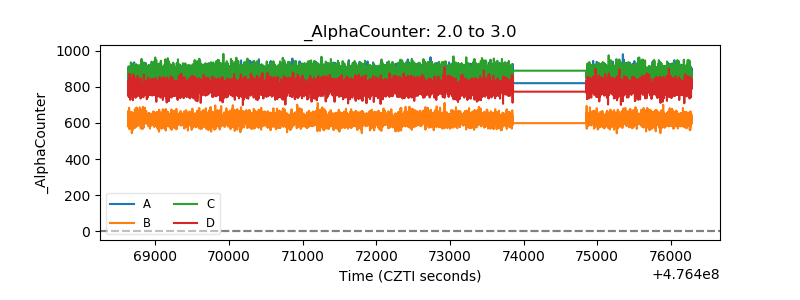 |
| _CPM_Rate | 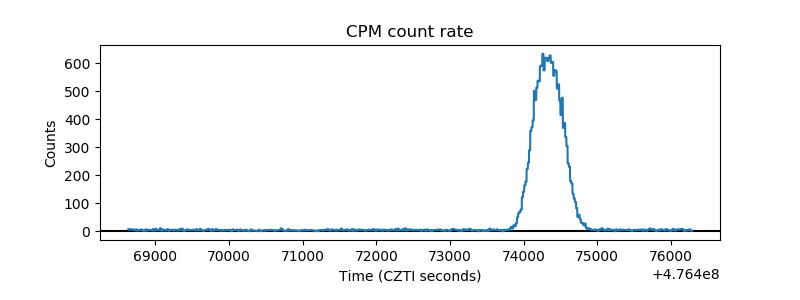 |
| CZT Counter | 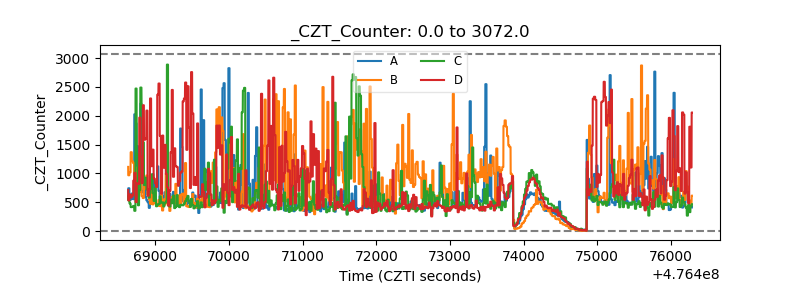 |
| +2.5 Volts monitor |  |
| +5 Volts monitor |  |
| _ROLL_ROT | 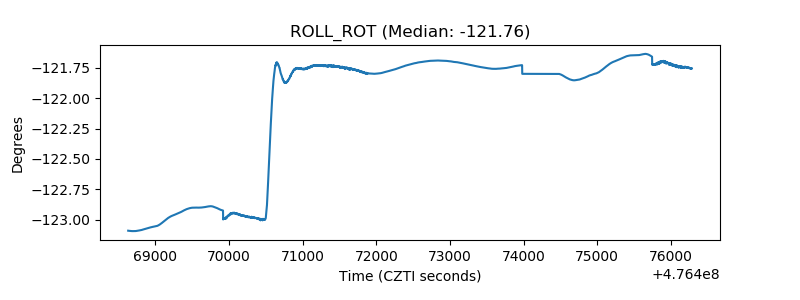 |
| _Roll_DEC | 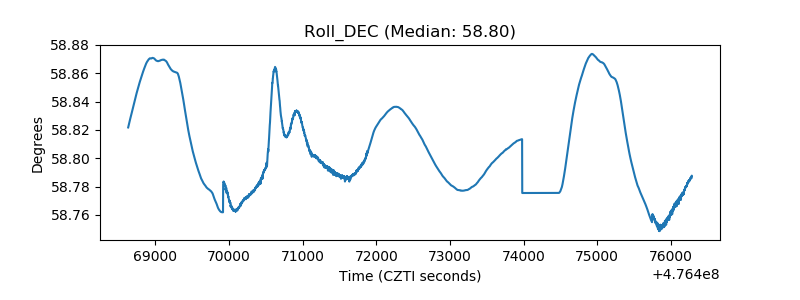 |
| _Roll_RA | 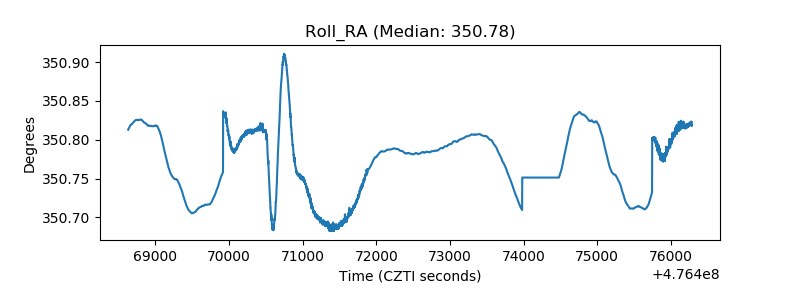 |
| Veto Counter | 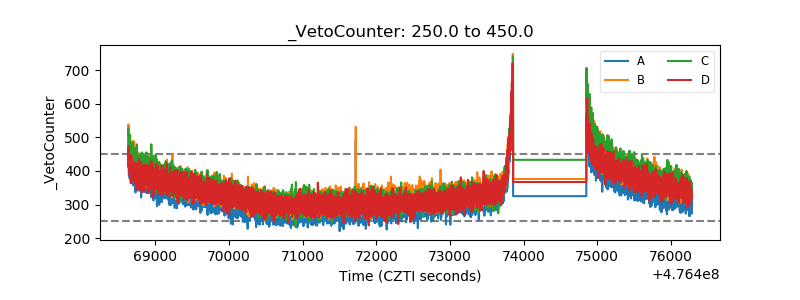 |