| Param | Original file | Final file |
|---|---|---|
| Filename | modeM0/AS1T05_239T01_9000006444_50622cztM0_level2.fits | modeM0/AS1T05_239T01_9000006444_50622cztM0_level2_quad_clean.evt |
| Size (bytes) | 531,812,160 | 93,813,120 |
| Size | 507.2 MB | 89.5 MB |
| Events in quadrant A | 3,802,278 | 619,109 |
| Events in quadrant B | 7,054,093 | 621,924 |
| Events in quadrant C | 3,517,442 | 605,768 |
| Events in quadrant D | 4,809,938 | 542,311 |
| Mode M0 | |||
|---|---|---|---|
| Quadrant | BADHDUFLAG | Total packets | Discarded packets |
| A | 0 | 15843 | 2 |
| B | 0 | 25385 | 2 |
| C | 0 | 15099 | 2 |
| D | 0 | 18922 | 2 |
| Mode M9 | |||
|---|---|---|---|
| Quadrant | BADHDUFLAG | Total packets | Discarded packets |
| A | 0 | 14 | 0 |
| B | 0 | 15 | 0 |
| C | 0 | 15 | 0 |
| D | 0 | 15 | 0 |
| Mode SS | |||
|---|---|---|---|
| Quadrant | BADHDUFLAG | Total packets | Discarded packets |
| A | 0 | 132 | 0 |
| B | 0 | 132 | 0 |
| C | 0 | 132 | 0 |
| D | 0 | 132 | 0 |
| Quadrant | Total seconds | Saturated seconds | Saturation percentage |
|---|---|---|---|
| A | 6470 | 197 | 3.044822% |
| B | 6470 | 900 | 13.910355% |
| C | 6470 | 117 | 1.808346% |
| D | 6470 | 390 | 6.027821% |
Noise dominated data is calculated using 1-second bins in cleaned event files. If a bin has >2000 counts, and if more than 50% of those come from <1% of pixels, then it is considered to be noise-dominated and hence unusable.
| Quadrant | # 1 sec bins | Bins with >0 counts | Bins with >2000 counts | High rate bins dominated by noise | Noise dominated (total time) | Noise dominated (detector-on time) | Marked lightcurve |
|---|---|---|---|---|---|---|---|
| A | 7610 | 6470 | 163 | 163 | 2.14% | 2.52% | 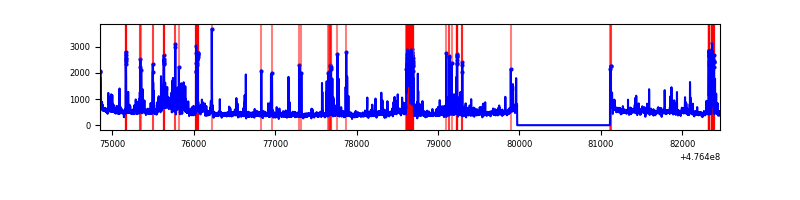 |
| B | 7610 | 6470 | 745 | 745 | 9.79% | 11.51% | 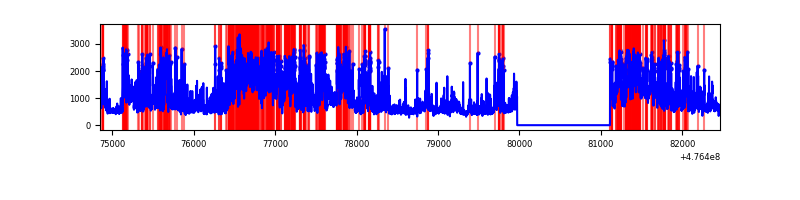 |
| C | 7610 | 6471 | 90 | 90 | 1.18% | 1.39% | 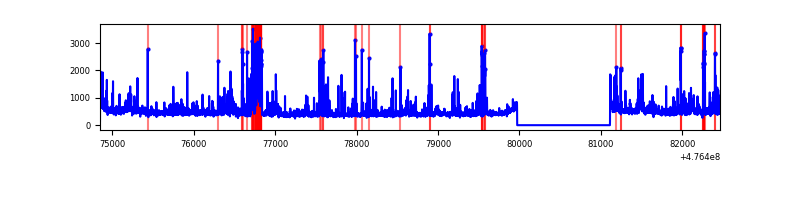 |
| D | 7610 | 6470 | 357 | 357 | 4.69% | 5.52% | 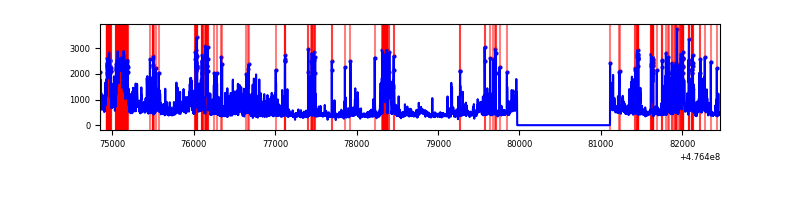 |
Top three noisy pixels from each quadrant. If the there are fewer than three noisy pixels in the level2.evt file, extra rows are filled as -1
| Pixel properties | Quadrant properties | ||||||
|---|---|---|---|---|---|---|---|
| Quadrant | DetID | PixID | Counts | Sigma | Mean | Median | Sigma |
| A | 6 | 161 | 218920 | 1283.07 | 688 | 673 | 170.1 |
| A | 9 | 96 | 217517 | 1274.82 | 688 | 673 | 170.1 |
| A | 8 | 38 | 107846 | 630.07 | 688 | 673 | 170.1 |
| B | 4 | 170 | 2498300 | 17647.41 | 668 | 645 | 141.5 |
| B | 7 | 0 | 507231 | 3579.33 | 668 | 645 | 141.5 |
| B | 3 | 249 | 245184 | 1727.81 | 668 | 645 | 141.5 |
| C | 15 | 199 | 213019 | 1113.06 | 686 | 679 | 190.8 |
| C | 13 | 3 | 152136 | 793.92 | 686 | 679 | 190.8 |
| C | 1 | 13 | 78467 | 407.75 | 686 | 679 | 190.8 |
| D | 6 | 42 | 445133 | 2426.92 | 665 | 644 | 183.1 |
| D | 8 | 246 | 319484 | 1740.87 | 665 | 644 | 183.1 |
| D | 2 | 165 | 293136 | 1597.01 | 665 | 644 | 183.1 |
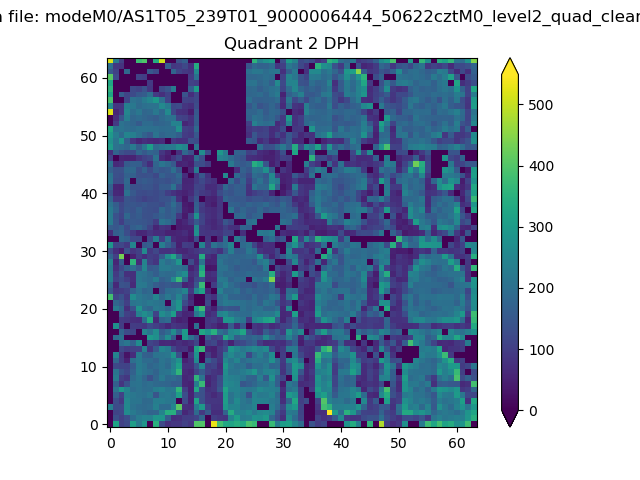
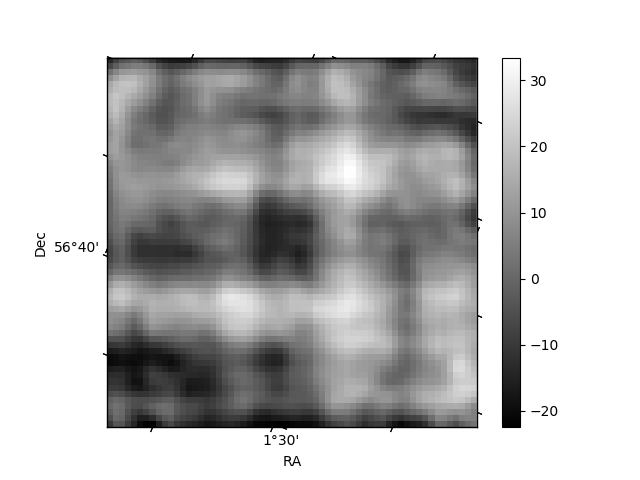
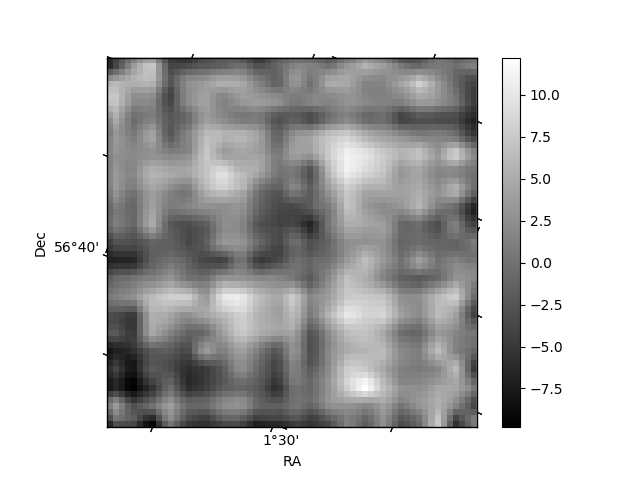
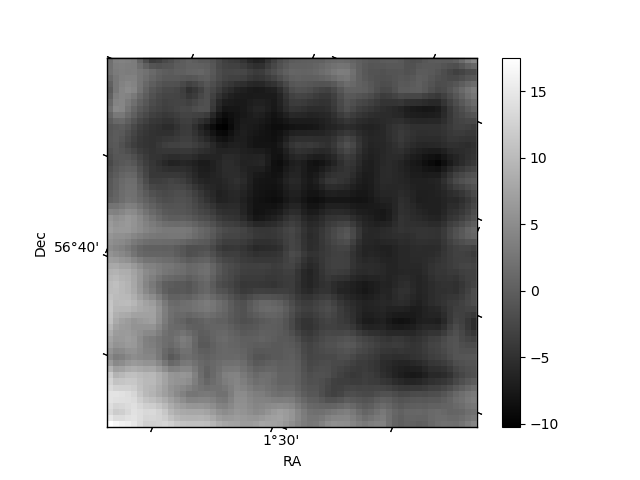
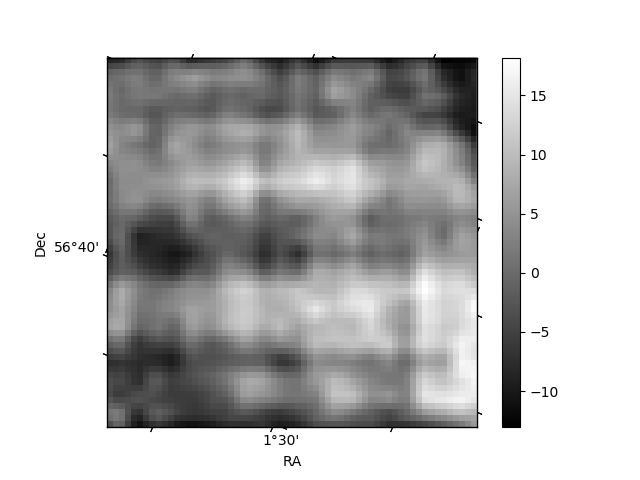
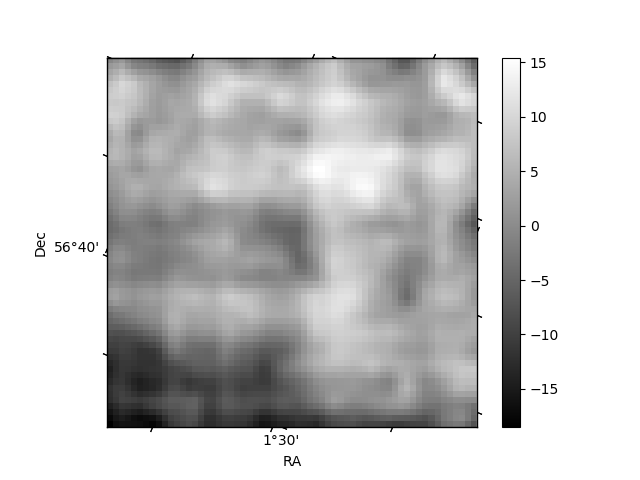
Histogram calculated using DETX and DETY for each event in the final _common_clean file
| Quadrant A | 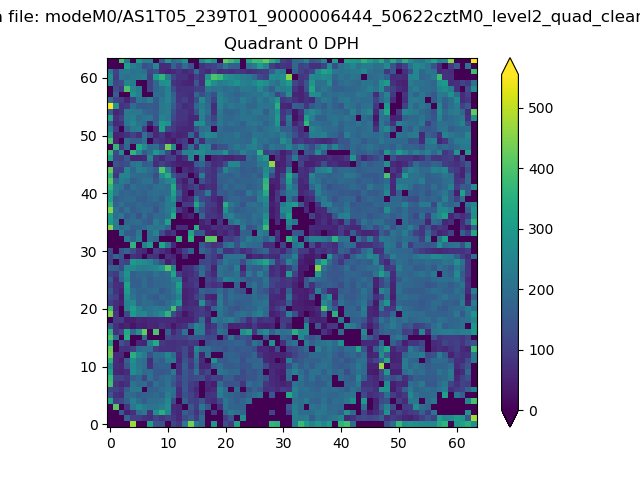 |
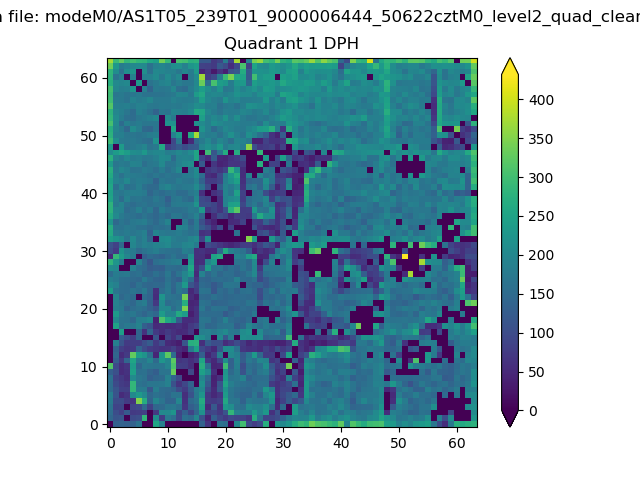 |
Quadrant B |
|---|---|---|---|
| Quadrant D | 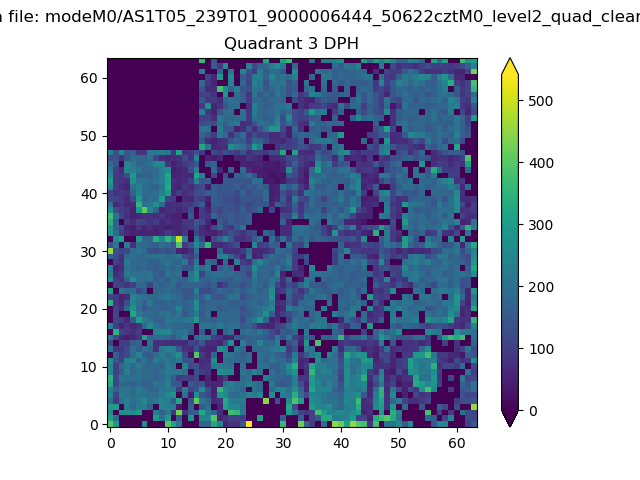 |
 |
Quadrant C |
| Plot type | Count rate plots | Images |
|---|---|---|
| Comparison with Poisson distribution Blue bars denote a histogram of data divided into 1 sec bins. Red curve is a Poisson curve with rate = median count rate of data. |
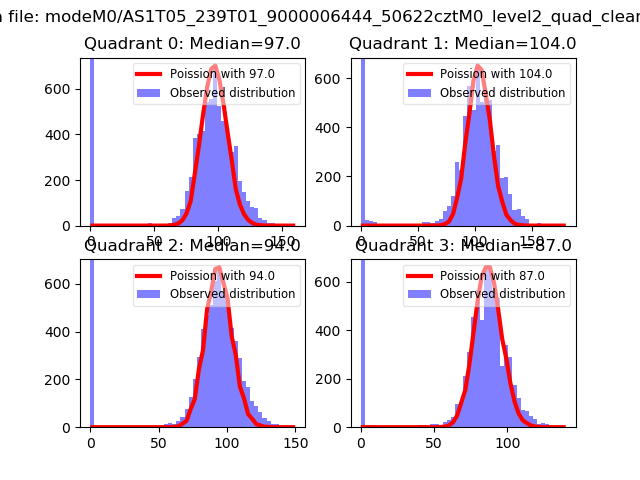 |
 |
| Quadrant-wise count rates Data is divided into 100 sec bins |
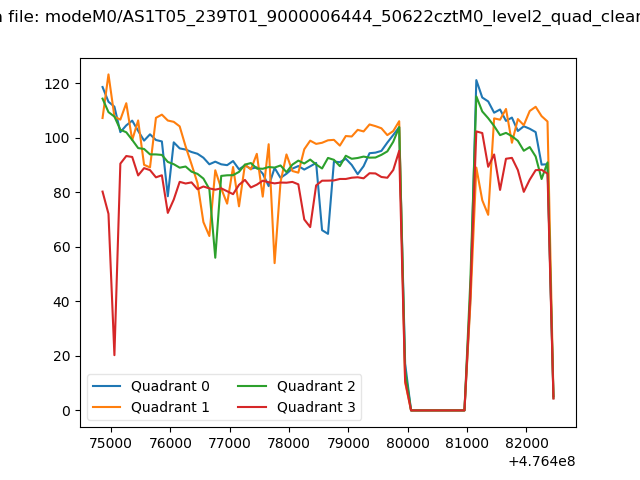 |
|
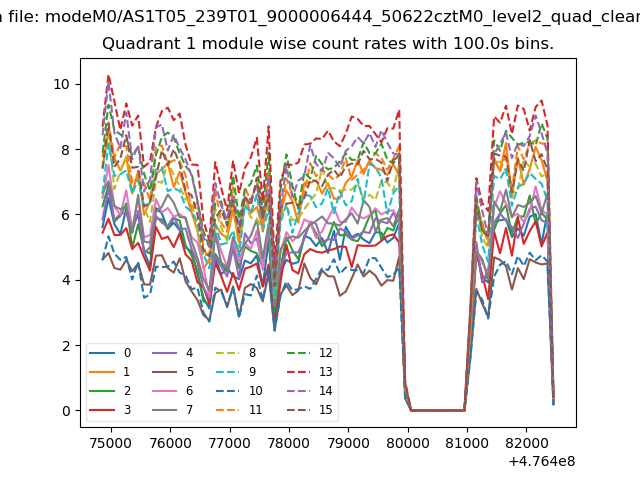
| Module-wise count rates for Quadrant A Data is divided into 100 sec bins |
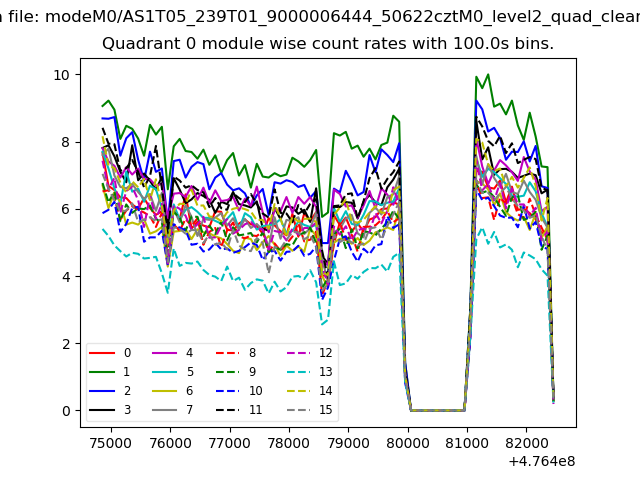 |
 |
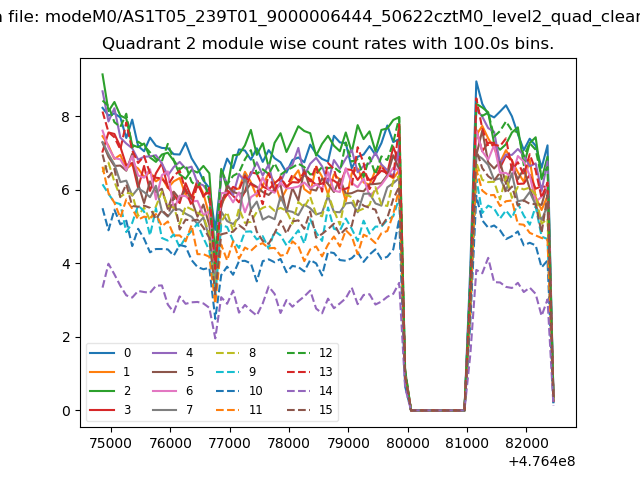
| Module-wise count rates for Quadrant B Data is divided into 100 sec bins |
 |
 |
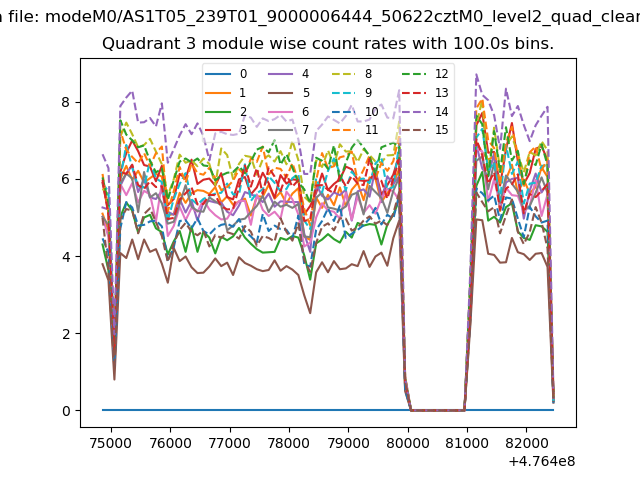
| Module-wise count rates for Quadrant C Data is divided into 100 sec bins |
 |
 |
| Module-wise count rates for Quadrant D Data is divided into 100 sec bins |
 |
 |
| Parameter | Plot |
|---|---|
| CZT HV Monitor | 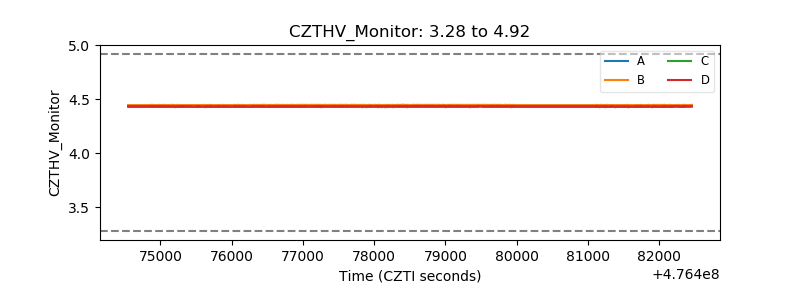 |
| D_VDD | 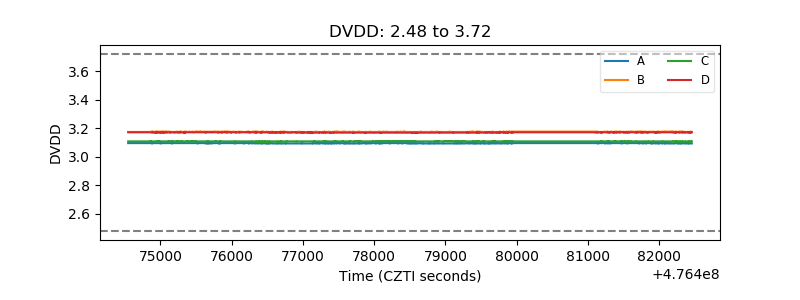 |
| Temperature 1 | 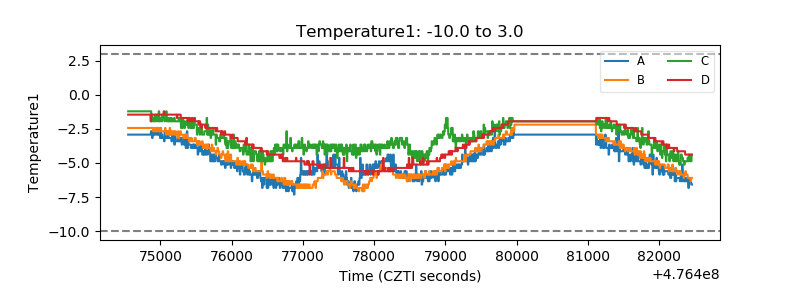 |
| Veto HV Monitor | 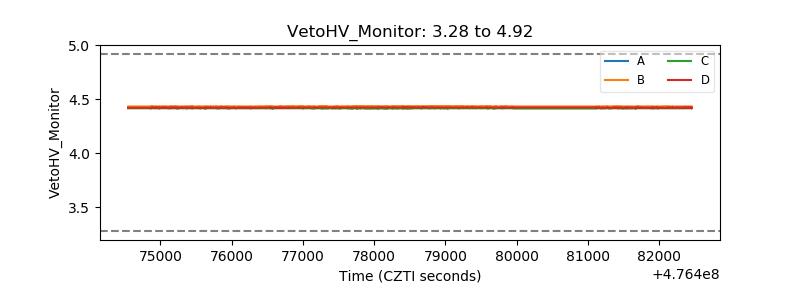 |
| Veto LLD | 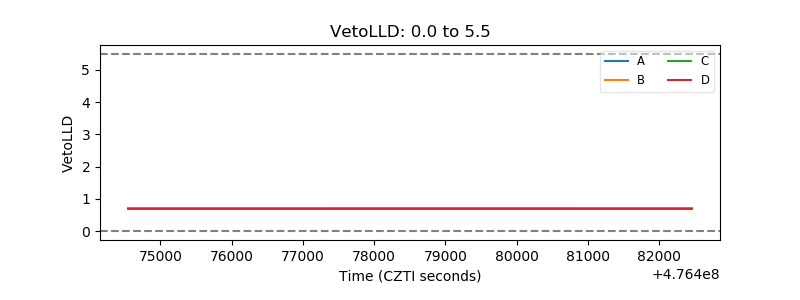 |
| Alpha Counter | 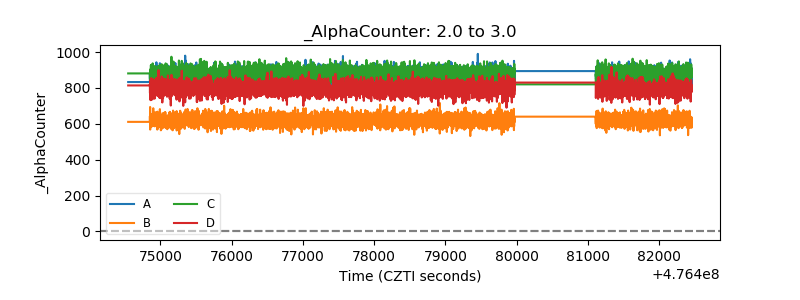 |
| _CPM_Rate | 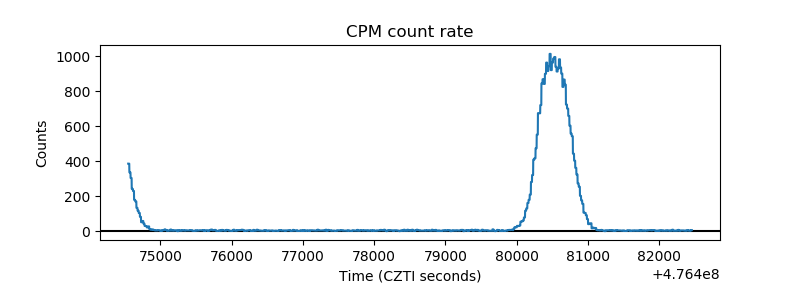 |
| CZT Counter | 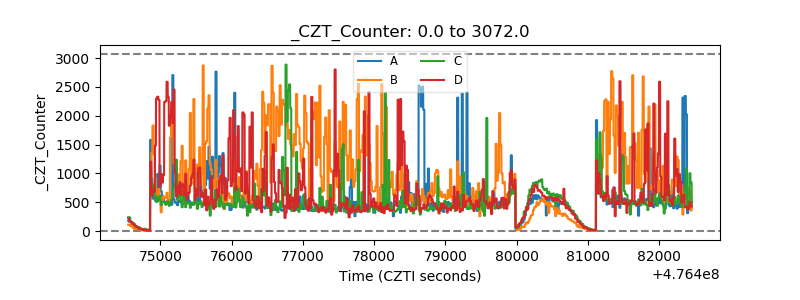 |
| +2.5 Volts monitor | 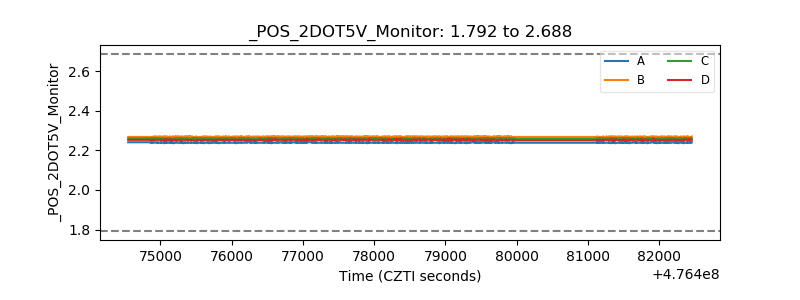 |
| +5 Volts monitor | 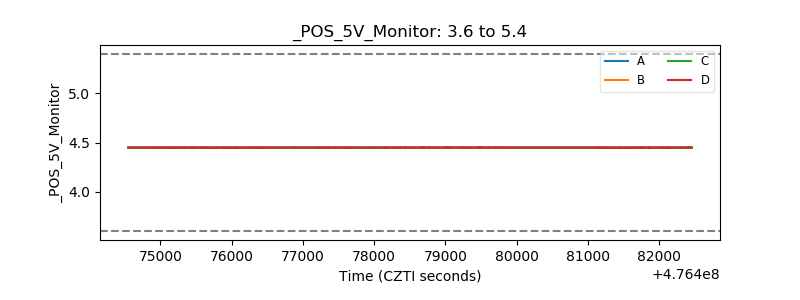 |
| _ROLL_ROT | 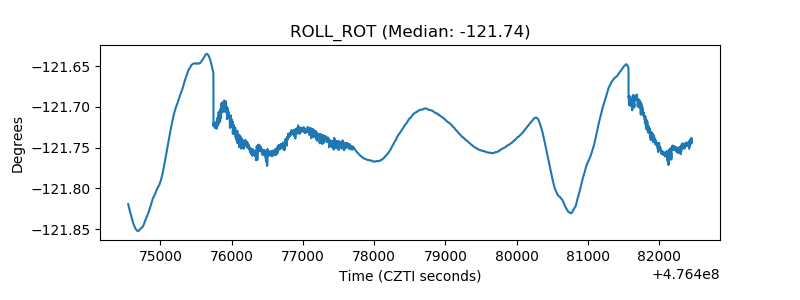 |
| _Roll_DEC | 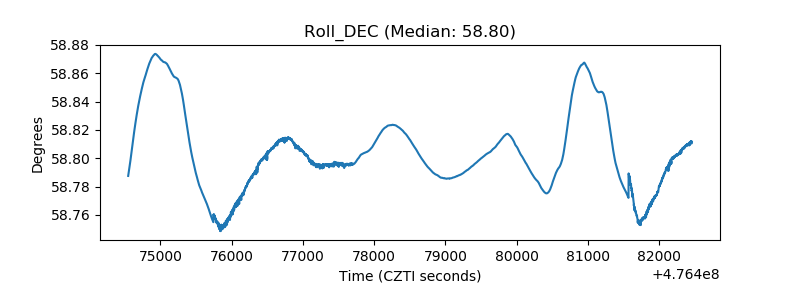 |
| _Roll_RA | 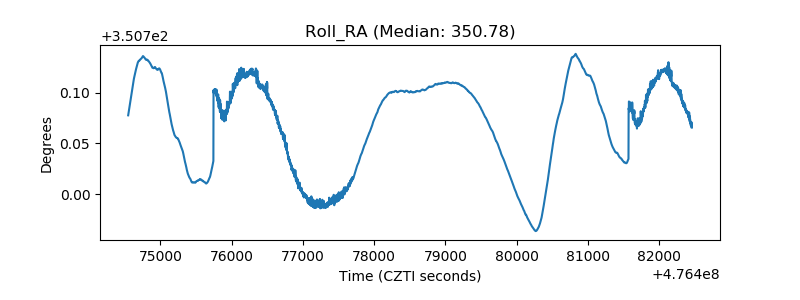 |
| Veto Counter | 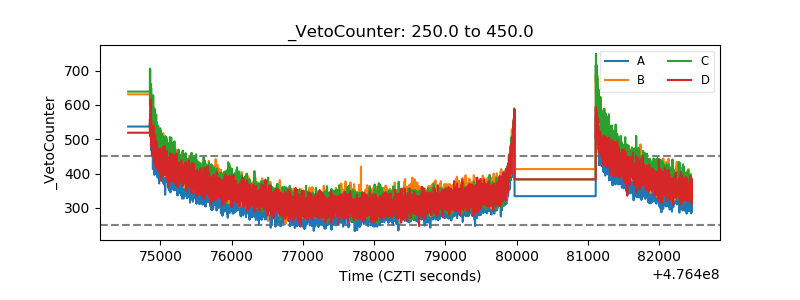 |