| Param | Original file | Final file |
|---|---|---|
| Filename | modeM0/AS1T05_239T01_9000006444_50623cztM0_level2.fits | modeM0/AS1T05_239T01_9000006444_50623cztM0_level2_quad_clean.evt |
| Size (bytes) | 563,696,640 | 90,907,200 |
| Size | 537.6 MB | 86.7 MB |
| Events in quadrant A | 3,541,418 | 626,630 |
| Events in quadrant B | 7,468,631 | 546,124 |
| Events in quadrant C | 3,918,801 | 614,459 |
| Events in quadrant D | 5,439,404 | 517,695 |
| Mode M0 | |||
|---|---|---|---|
| Quadrant | BADHDUFLAG | Total packets | Discarded packets |
| A | 0 | 15004 | 2 |
| B | 0 | 26672 | 2 |
| C | 0 | 16115 | 2 |
| D | 0 | 20782 | 2 |
| Mode M9 | |||
|---|---|---|---|
| Quadrant | BADHDUFLAG | Total packets | Discarded packets |
| A | 0 | 17 | 0 |
| B | 0 | 18 | 0 |
| C | 0 | 18 | 0 |
| D | 0 | 18 | 0 |
| Mode SS | |||
|---|---|---|---|
| Quadrant | BADHDUFLAG | Total packets | Discarded packets |
| A | 0 | 130 | 0 |
| B | 0 | 130 | 0 |
| C | 0 | 130 | 0 |
| D | 0 | 130 | 0 |
| Quadrant | Total seconds | Saturated seconds | Saturation percentage |
|---|---|---|---|
| A | 6414 | 169 | 2.634861% |
| B | 6413 | 1504 | 23.452362% |
| C | 6413 | 149 | 2.323406% |
| D | 6413 | 802 | 12.505847% |
Noise dominated data is calculated using 1-second bins in cleaned event files. If a bin has >2000 counts, and if more than 50% of those come from <1% of pixels, then it is considered to be noise-dominated and hence unusable.
| Quadrant | # 1 sec bins | Bins with >0 counts | Bins with >2000 counts | High rate bins dominated by noise | Noise dominated (total time) | Noise dominated (detector-on time) | Marked lightcurve |
|---|---|---|---|---|---|---|---|
| A | 7599 | 6415 | 98 | 98 | 1.29% | 1.53% | 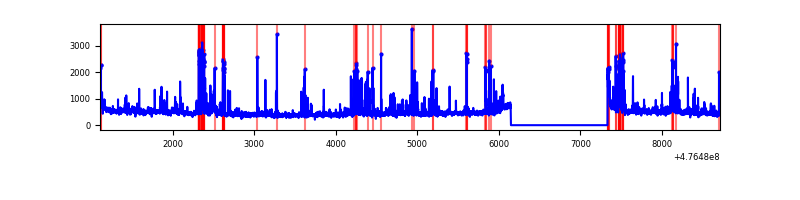 |
| B | 7597 | 6412 | 1235 | 1235 | 16.26% | 19.26% | 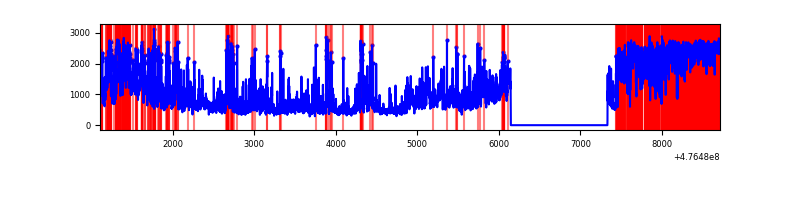 |
| C | 7598 | 6413 | 100 | 100 | 1.32% | 1.56% | 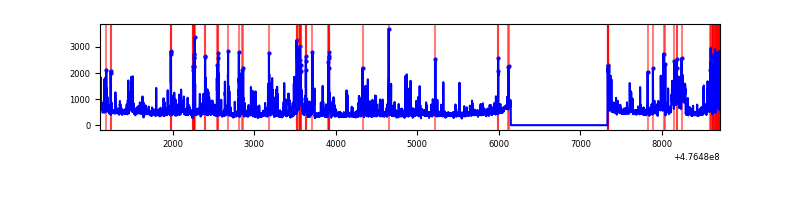 |
| D | 7598 | 6413 | 747 | 747 | 9.83% | 11.65% | 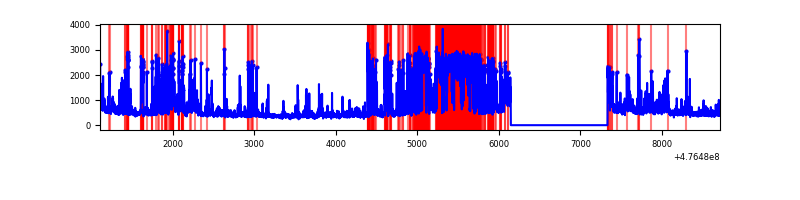 |
Top three noisy pixels from each quadrant. If the there are fewer than three noisy pixels in the level2.evt file, extra rows are filled as -1
| Pixel properties | Quadrant properties | ||||||
|---|---|---|---|---|---|---|---|
| Quadrant | DetID | PixID | Counts | Sigma | Mean | Median | Sigma |
| A | 8 | 247 | 140486 | 802.56 | 691 | 672 | 174.2 |
| A | 6 | 161 | 117432 | 670.22 | 691 | 672 | 174.2 |
| A | 4 | 3 | 111901 | 638.47 | 691 | 672 | 174.2 |
| B | 4 | 170 | 2569258 | 19194.02 | 632 | 610 | 133.8 |
| B | 5 | 172 | 840112 | 6273.11 | 632 | 610 | 133.8 |
| B | 7 | 0 | 497785 | 3715.1 | 632 | 610 | 133.8 |
| C | 15 | 232 | 320014 | 1662.1 | 688 | 680 | 192.1 |
| C | 13 | 3 | 119319 | 617.5 | 688 | 680 | 192.1 |
| C | 15 | 199 | 93489 | 483.06 | 688 | 680 | 192.1 |
| D | 1 | 47 | 1825651 | 10164.99 | 644 | 621 | 179.5 |
| D | 2 | 249 | 203305 | 1128.9 | 644 | 621 | 179.5 |
| D | 8 | 176 | 129480 | 717.71 | 644 | 621 | 179.5 |
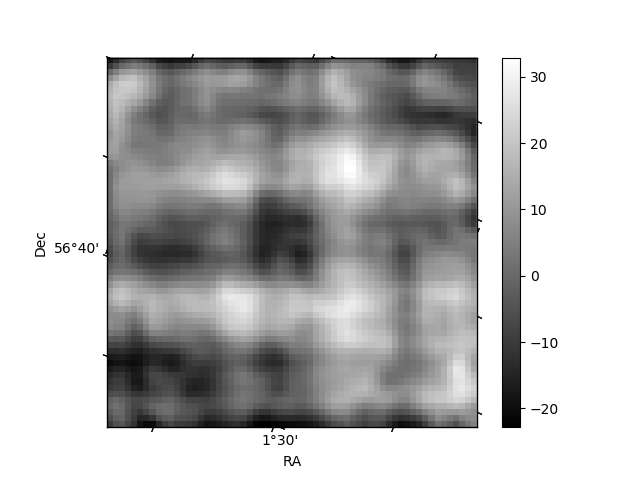
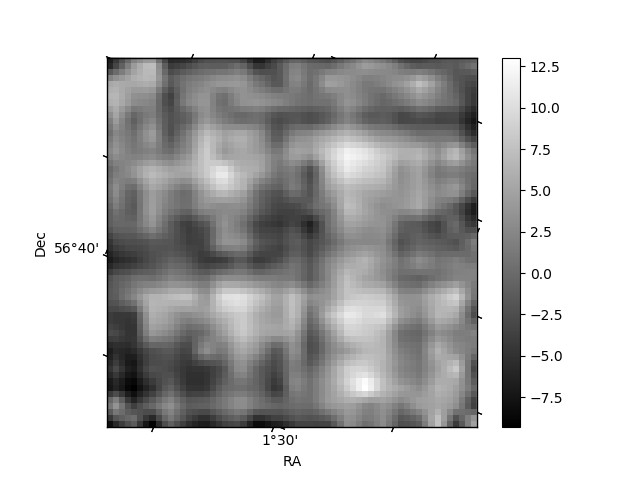
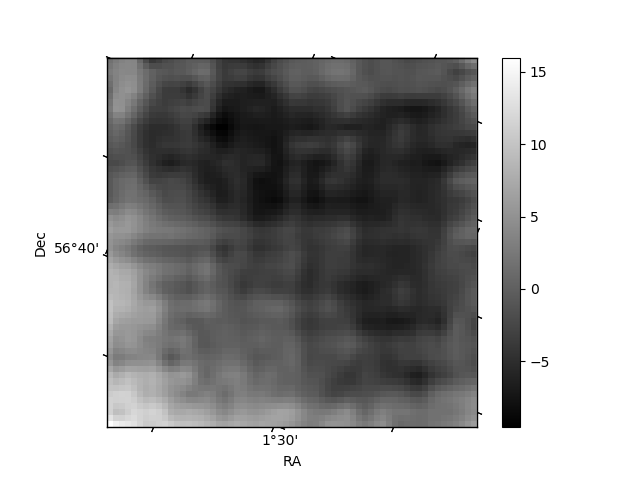
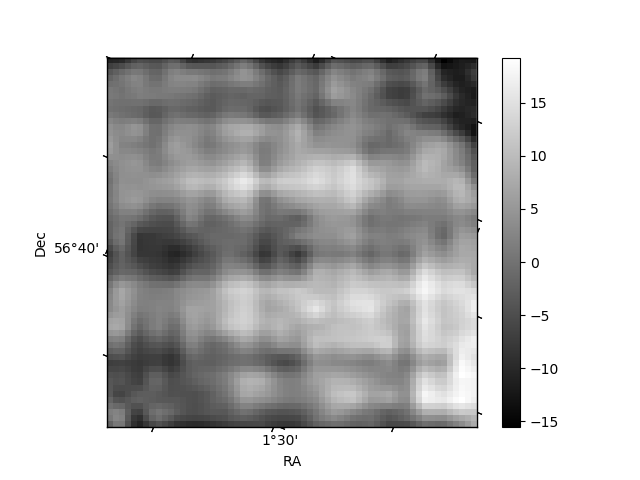
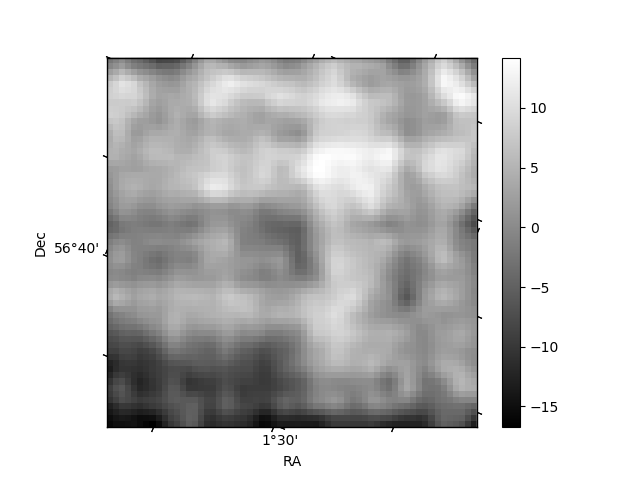
Histogram calculated using DETX and DETY for each event in the final _common_clean file
| Quadrant A | 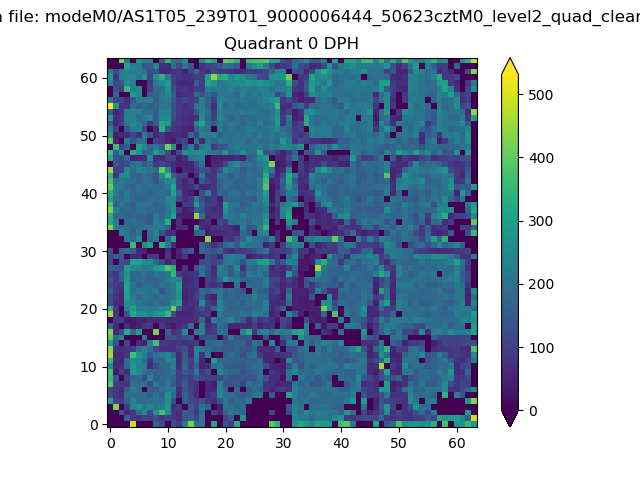 |
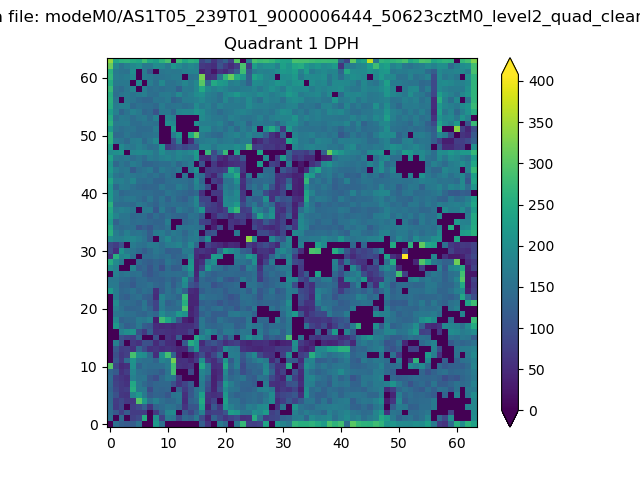 |
Quadrant B |
|---|---|---|---|
| Quadrant D | 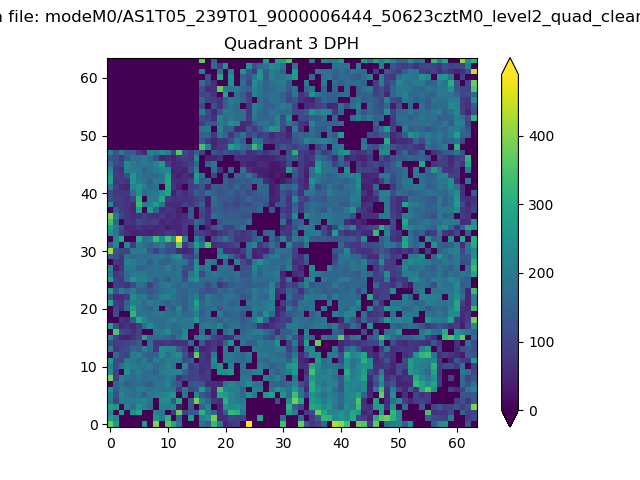 |
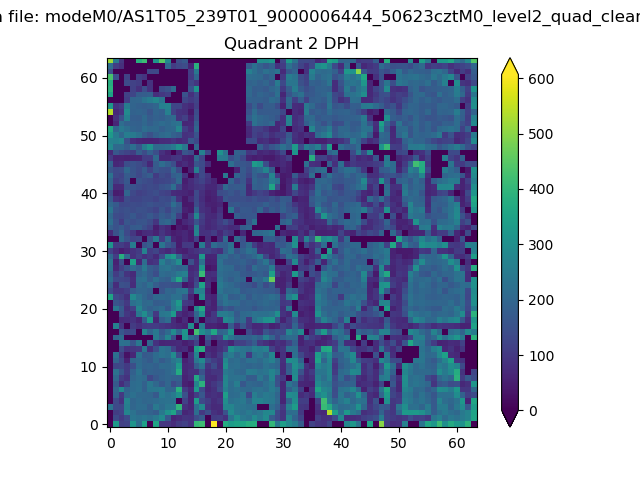 |
Quadrant C |
| Plot type | Count rate plots | Images |
|---|---|---|
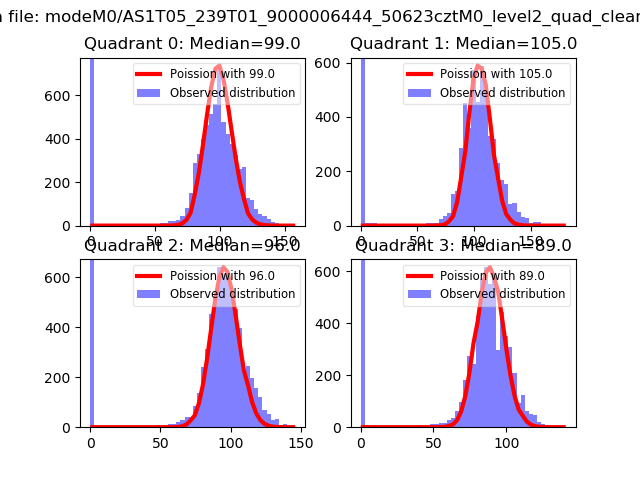
| Comparison with Poisson distribution Blue bars denote a histogram of data divided into 1 sec bins. Red curve is a Poisson curve with rate = median count rate of data. |
 |
 |
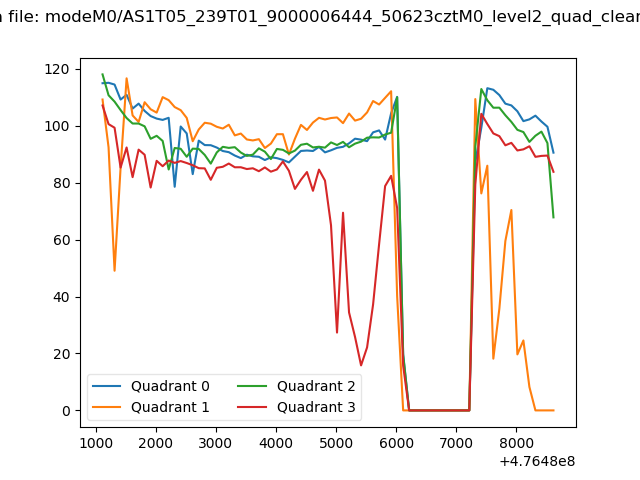
| Quadrant-wise count rates Data is divided into 100 sec bins |
 |
|
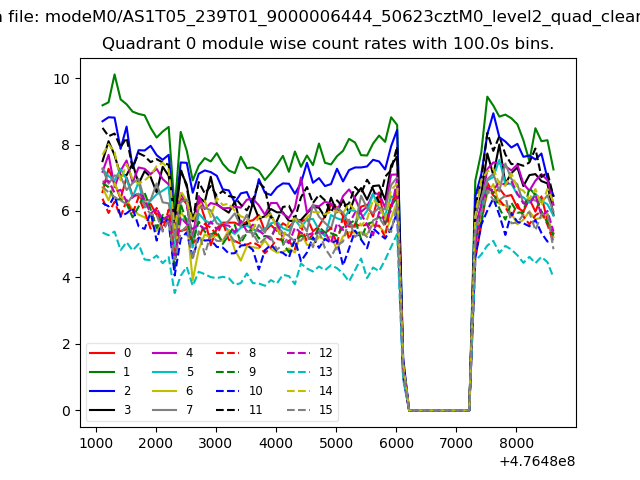
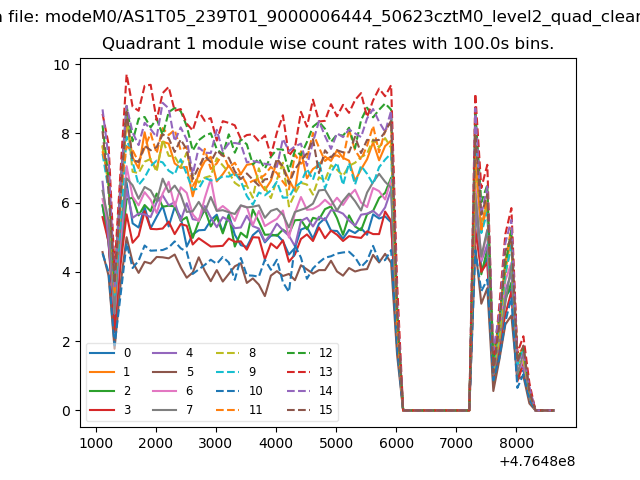
| Module-wise count rates for Quadrant A Data is divided into 100 sec bins |
 |
 |
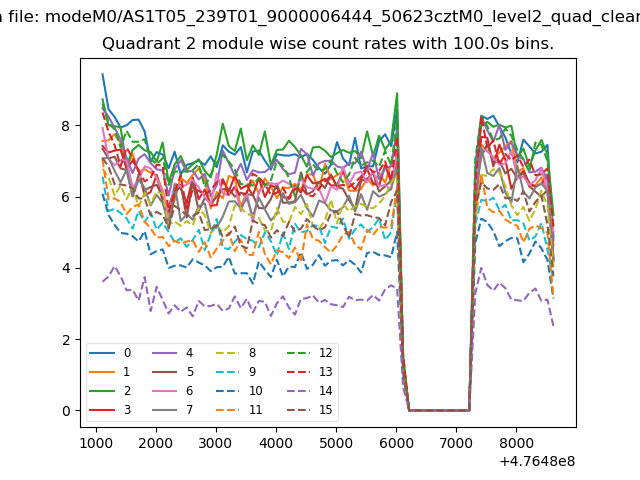
| Module-wise count rates for Quadrant B Data is divided into 100 sec bins |
 |
 |
| Module-wise count rates for Quadrant C Data is divided into 100 sec bins |
 |
 |
| Module-wise count rates for Quadrant D Data is divided into 100 sec bins |
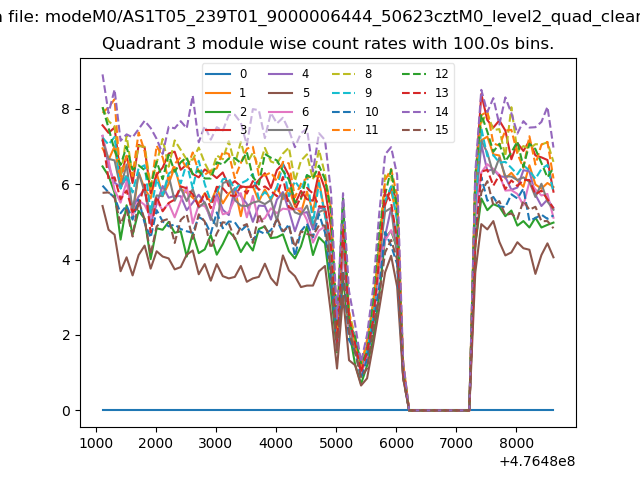 |
 |
| Parameter | Plot |
|---|---|
| CZT HV Monitor | 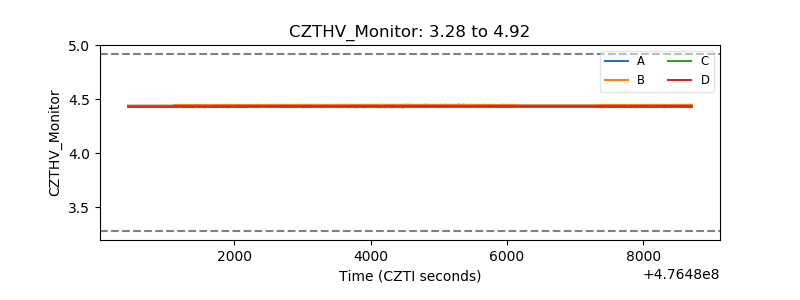 |
| D_VDD | 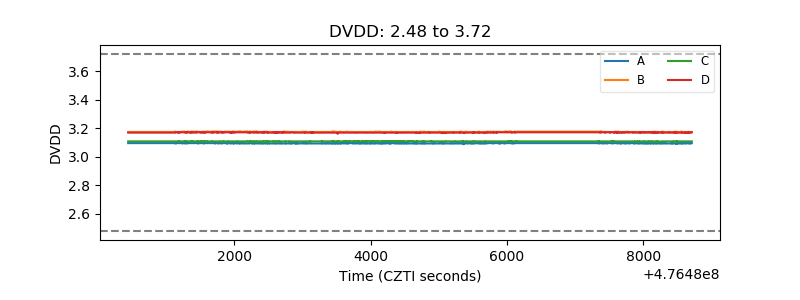 |
| Temperature 1 | 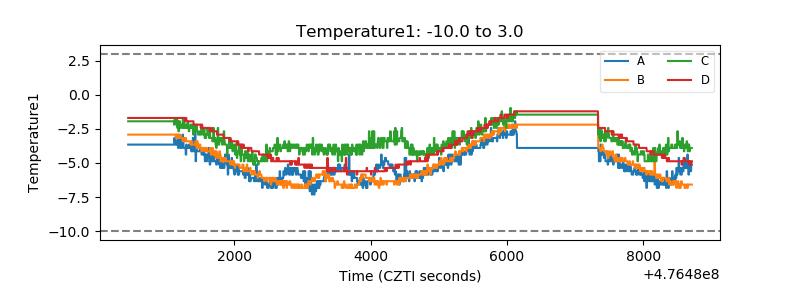 |
| Veto HV Monitor |  |
| Veto LLD | 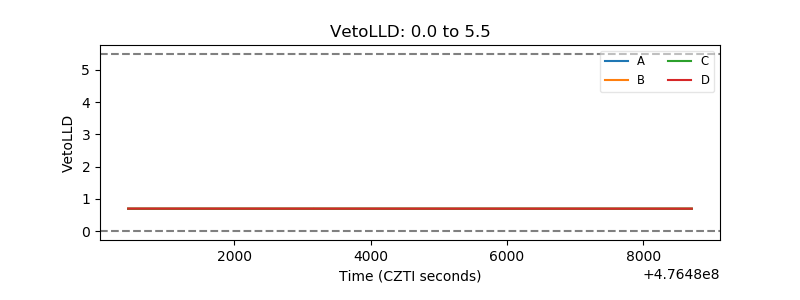 |
| Alpha Counter | 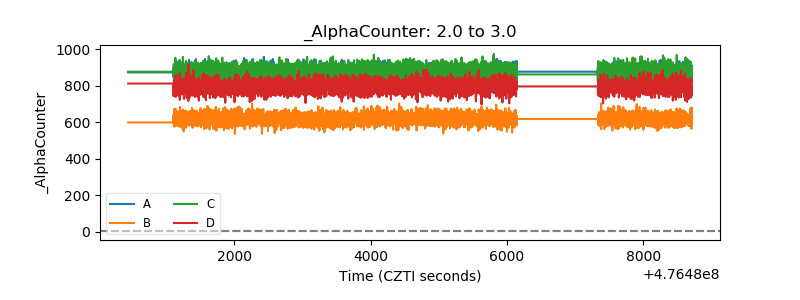 |
| _CPM_Rate | 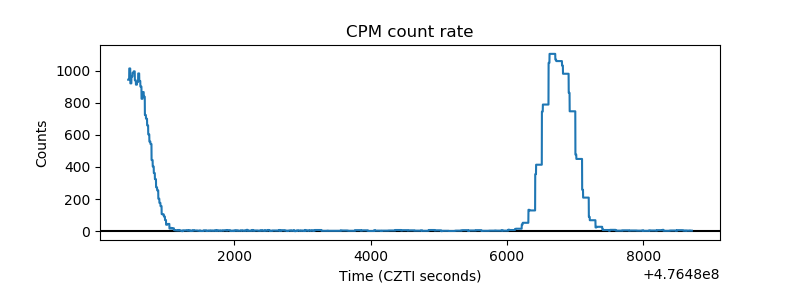 |
| CZT Counter | 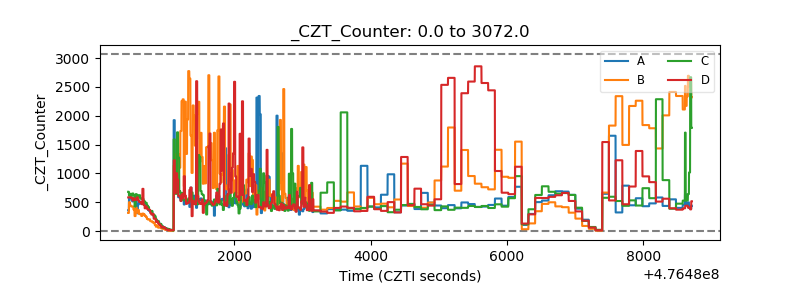 |
| +2.5 Volts monitor | 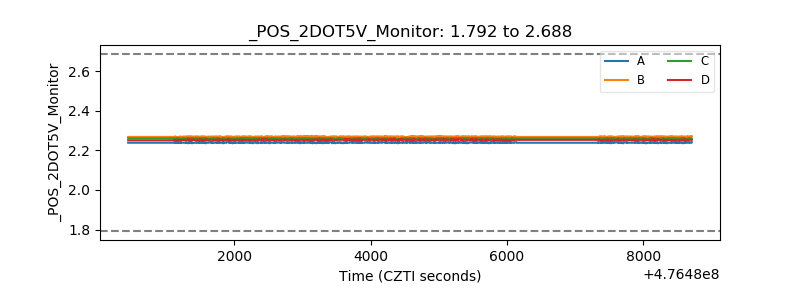 |
| +5 Volts monitor | 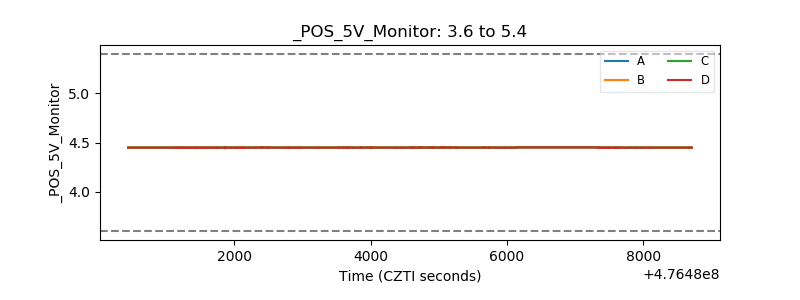 |
| _ROLL_ROT | 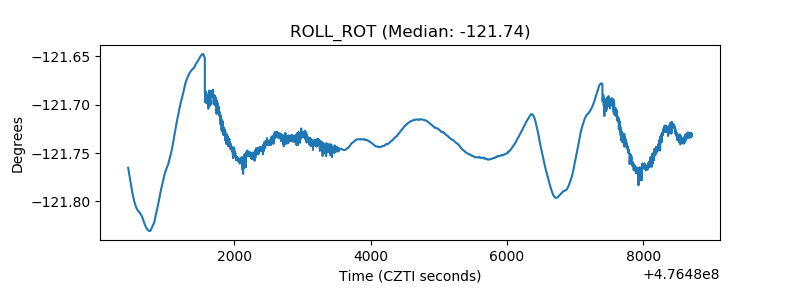 |
| _Roll_DEC | 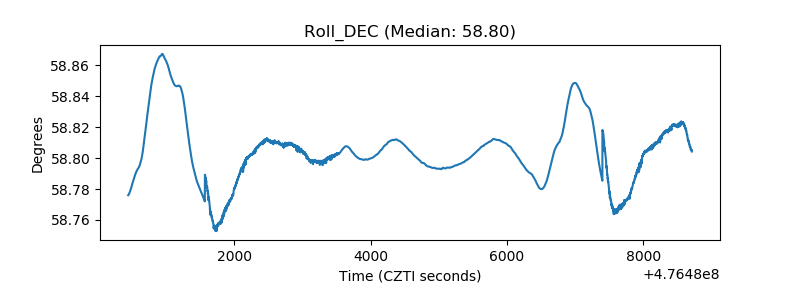 |
| _Roll_RA | 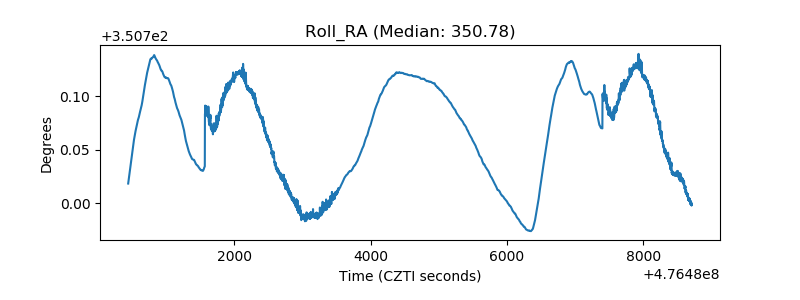 |
| Veto Counter | 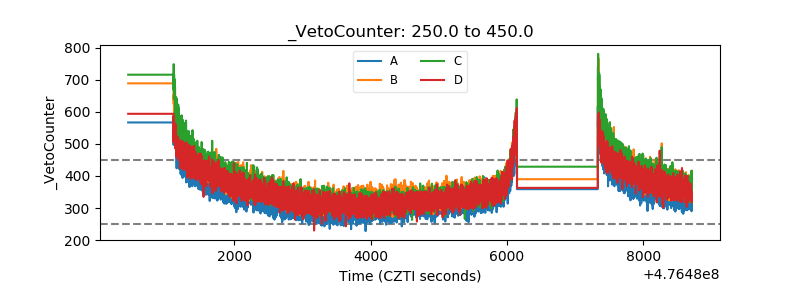 |