| Param | Original file | Final file |
|---|---|---|
| Filename | modeM0/AS1T05_239T01_9000006444_50624cztM0_level2.fits | modeM0/AS1T05_239T01_9000006444_50624cztM0_level2_quad_clean.evt |
| Size (bytes) | 648,155,520 | 88,156,800 |
| Size | 618.1 MB | 84.1 MB |
| Events in quadrant A | 3,756,589 | 633,581 |
| Events in quadrant B | 11,053,433 | 397,522 |
| Events in quadrant C | 4,377,129 | 611,051 |
| Events in quadrant D | 4,300,668 | 573,536 |
| Mode M0 | |||
|---|---|---|---|
| Quadrant | BADHDUFLAG | Total packets | Discarded packets |
| A | 0 | 15529 | 2 |
| B | 0 | 37321 | 3 |
| C | 0 | 17567 | 2 |
| D | 0 | 17576 | 2 |
| Mode M9 | |||
|---|---|---|---|
| Quadrant | BADHDUFLAG | Total packets | Discarded packets |
| A | 0 | 22 | 0 |
| B | 0 | 23 | 0 |
| C | 0 | 23 | 0 |
| D | 0 | 23 | 0 |
| Mode SS | |||
|---|---|---|---|
| Quadrant | BADHDUFLAG | Total packets | Discarded packets |
| A | 0 | 132 | 0 |
| B | 0 | 132 | 0 |
| C | 0 | 132 | 0 |
| D | 0 | 132 | 0 |
| Quadrant | Total seconds | Saturated seconds | Saturation percentage |
|---|---|---|---|
| A | 6505 | 181 | 2.782475% |
| B | 6504 | 3128 | 48.093481% |
| C | 6504 | 326 | 5.012300% |
| D | 6504 | 289 | 4.443419% |
Noise dominated data is calculated using 1-second bins in cleaned event files. If a bin has >2000 counts, and if more than 50% of those come from <1% of pixels, then it is considered to be noise-dominated and hence unusable.
| Quadrant | # 1 sec bins | Bins with >0 counts | Bins with >2000 counts | High rate bins dominated by noise | Noise dominated (total time) | Noise dominated (detector-on time) | Marked lightcurve |
|---|---|---|---|---|---|---|---|
| A | 7740 | 6506 | 124 | 124 | 1.60% | 1.91% | 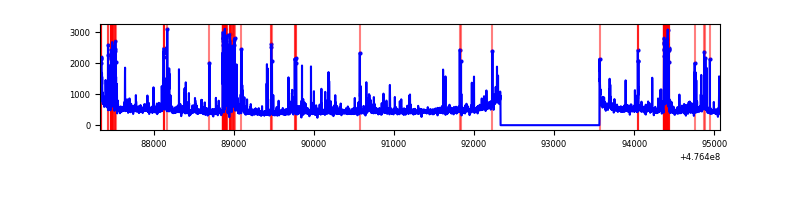 |
| B | 7739 | 6504 | 2808 | 2808 | 36.28% | 43.17% | 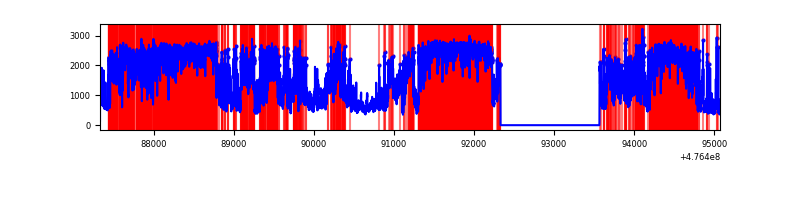 |
| C | 7739 | 6505 | 301 | 301 | 3.89% | 4.63% | 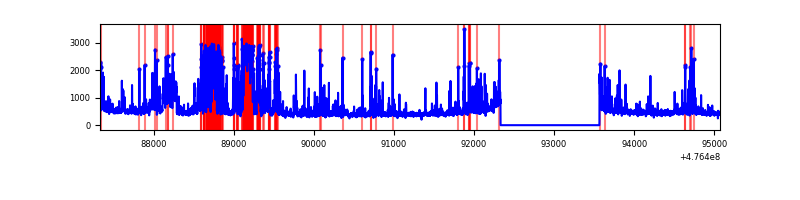 |
| D | 7739 | 6505 | 230 | 230 | 2.97% | 3.54% | 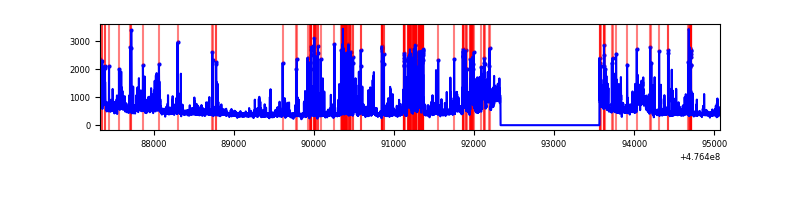 |
Top three noisy pixels from each quadrant. If the there are fewer than three noisy pixels in the level2.evt file, extra rows are filled as -1
| Pixel properties | Quadrant properties | ||||||
|---|---|---|---|---|---|---|---|
| Quadrant | DetID | PixID | Counts | Sigma | Mean | Median | Sigma |
| A | 8 | 38 | 190923 | 1096.84 | 699 | 681 | 173.4 |
| A | 4 | 3 | 181722 | 1043.79 | 699 | 681 | 173.4 |
| A | 6 | 161 | 145506 | 834.99 | 699 | 681 | 173.4 |
| B | 4 | 170 | 4509235 | 38229.79 | 551 | 532 | 117.9 |
| B | 5 | 172 | 3131643 | 26549.04 | 551 | 532 | 117.9 |
| B | 7 | 0 | 336471 | 2848.46 | 551 | 532 | 117.9 |
| C | 15 | 232 | 872653 | 4551.24 | 686 | 681 | 191.6 |
| C | 13 | 3 | 205454 | 1068.81 | 686 | 681 | 191.6 |
| C | 14 | 247 | 152869 | 794.34 | 686 | 681 | 191.6 |
| D | 2 | 249 | 725407 | 3877.41 | 673 | 650 | 186.9 |
| D | 8 | 246 | 221802 | 1183.15 | 673 | 650 | 186.9 |
| D | 8 | 176 | 151460 | 806.82 | 673 | 650 | 186.9 |
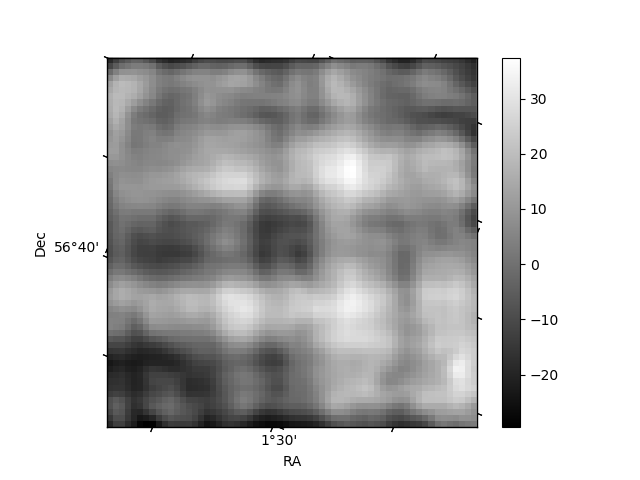
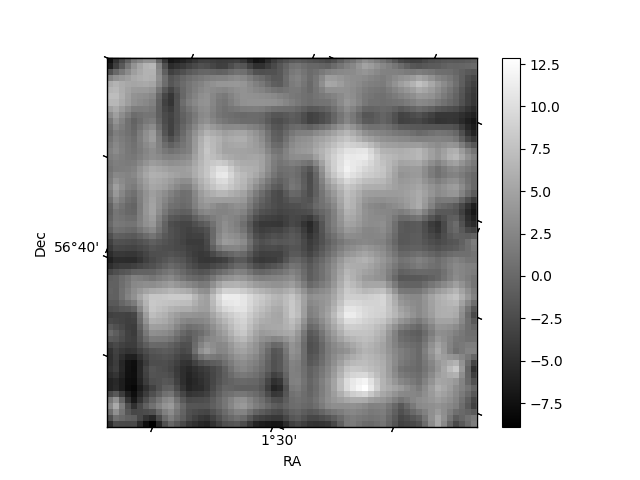
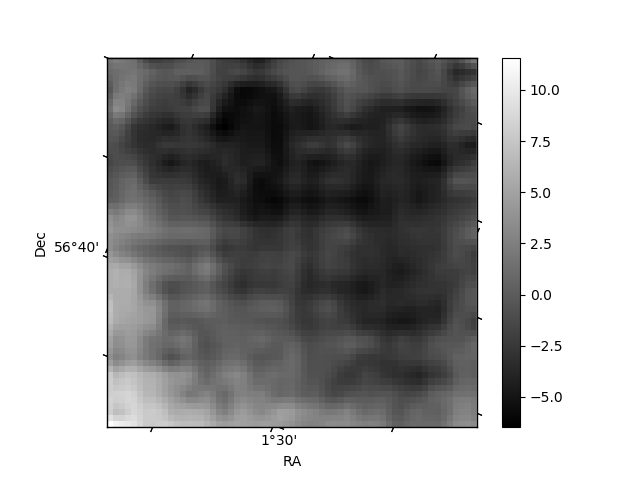
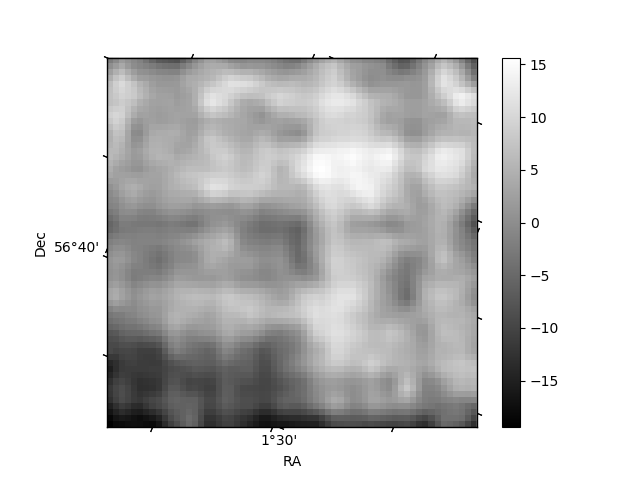
Histogram calculated using DETX and DETY for each event in the final _common_clean file
| Quadrant A | 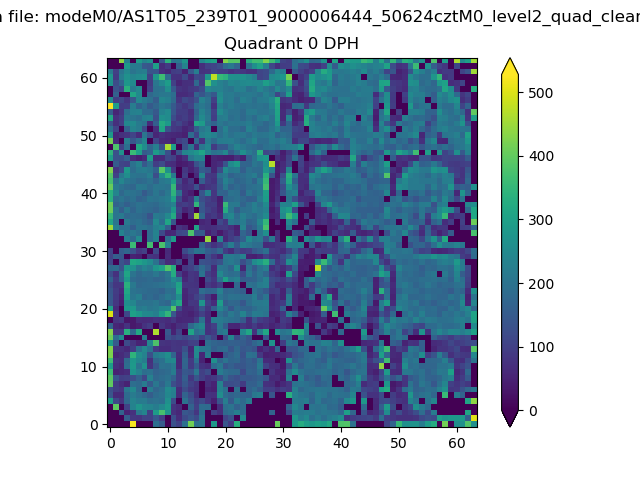 |
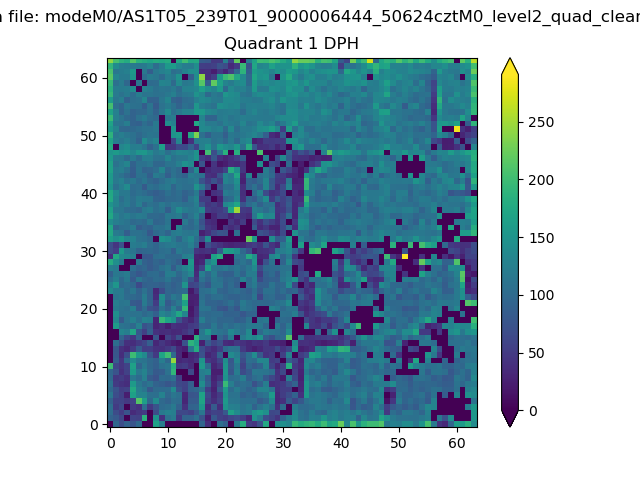 |
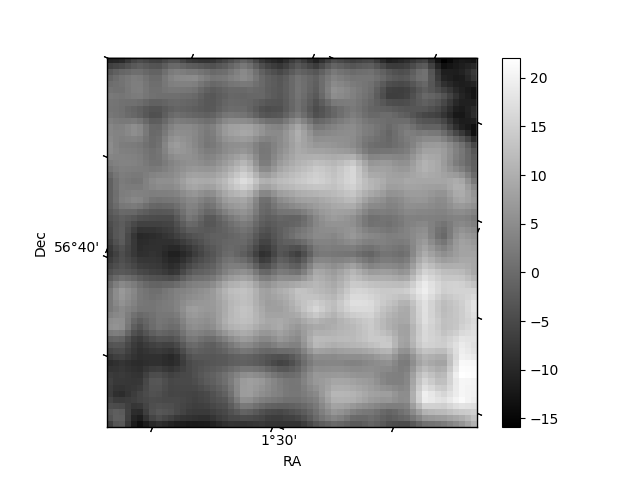
Quadrant B |
|---|---|---|---|
| Quadrant D | 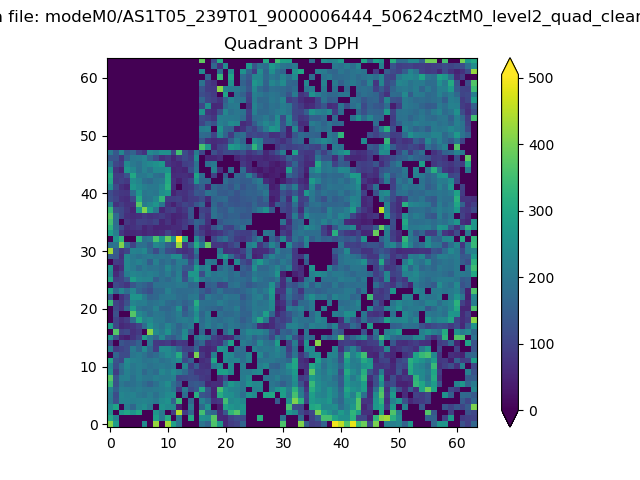 |
 |
Quadrant C |
| Plot type | Count rate plots | Images |
|---|---|---|
| Comparison with Poisson distribution Blue bars denote a histogram of data divided into 1 sec bins. Red curve is a Poisson curve with rate = median count rate of data. |
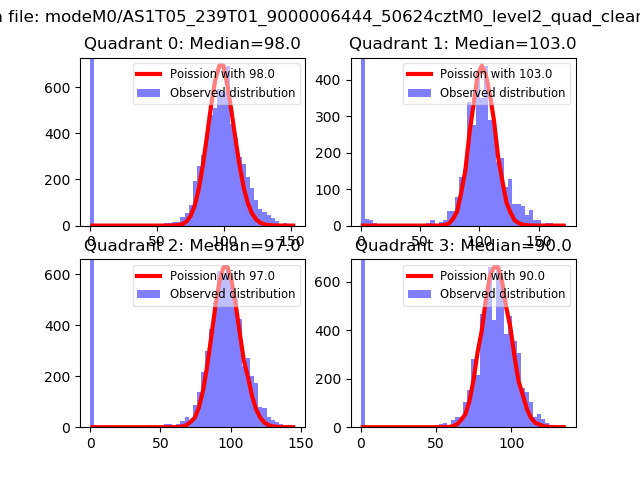 |
 |
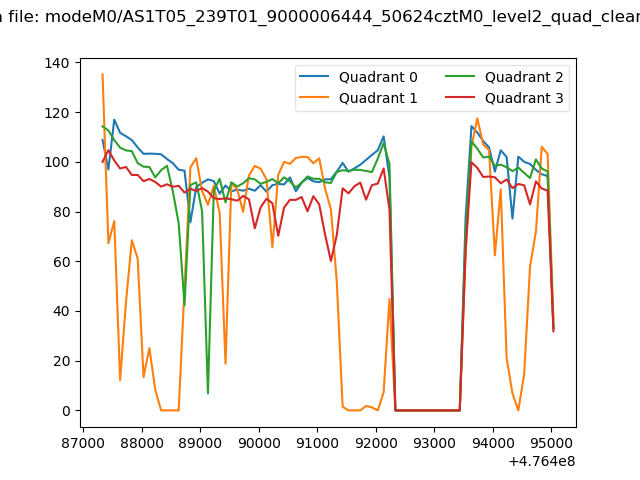
| Quadrant-wise count rates Data is divided into 100 sec bins |
 |
|
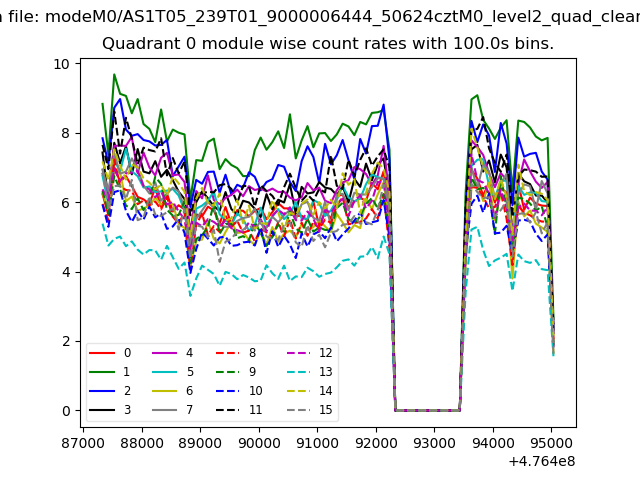
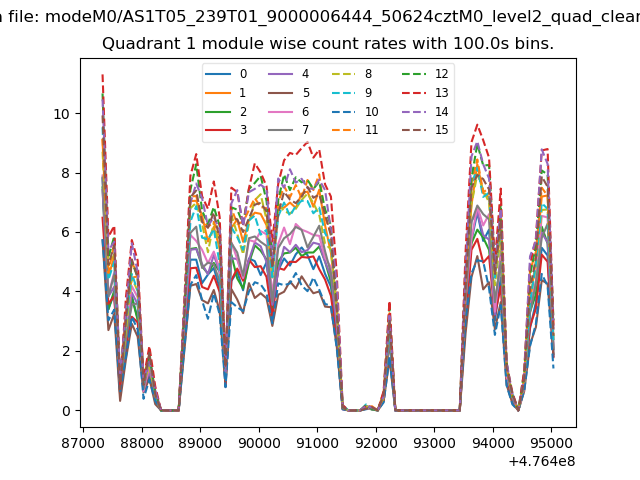
| Module-wise count rates for Quadrant A Data is divided into 100 sec bins |
 |
 |
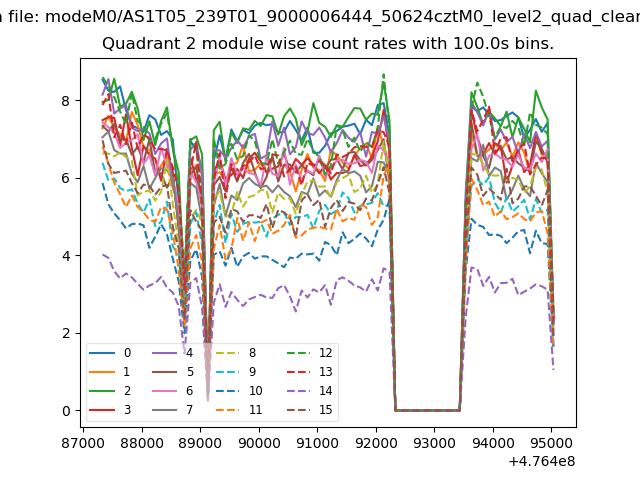
| Module-wise count rates for Quadrant B Data is divided into 100 sec bins |
 |
 |
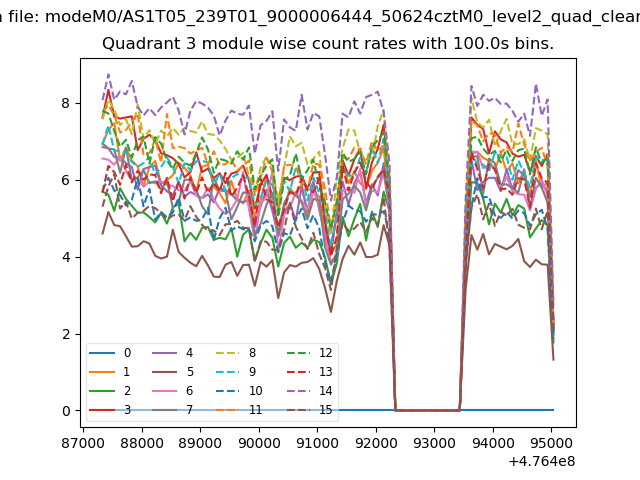
| Module-wise count rates for Quadrant C Data is divided into 100 sec bins |
 |
 |
| Module-wise count rates for Quadrant D Data is divided into 100 sec bins |
 |
 |
| Parameter | Plot |
|---|---|
| CZT HV Monitor | 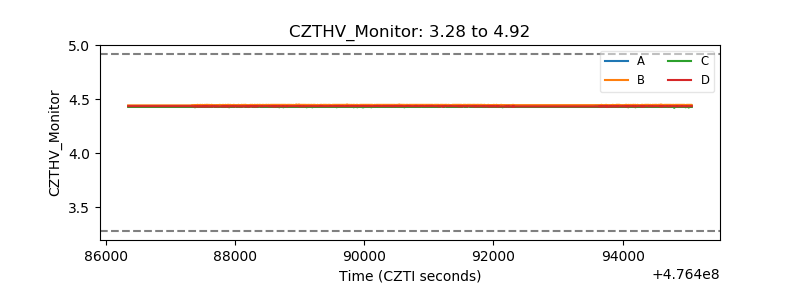 |
| D_VDD | 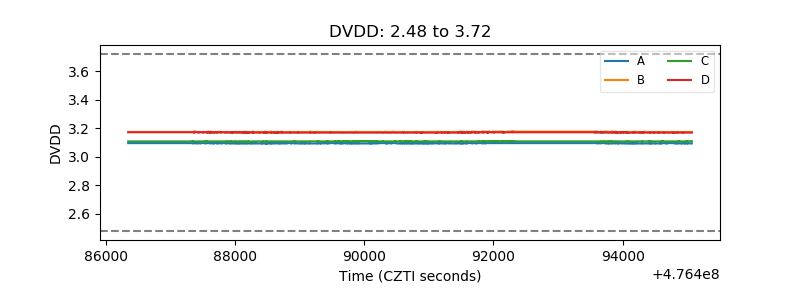 |
| Temperature 1 | 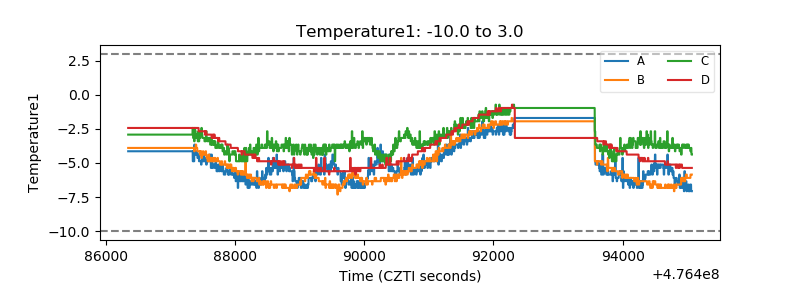 |
| Veto HV Monitor | 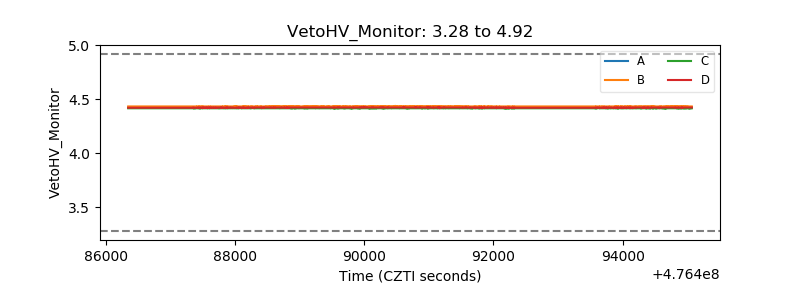 |
| Veto LLD | 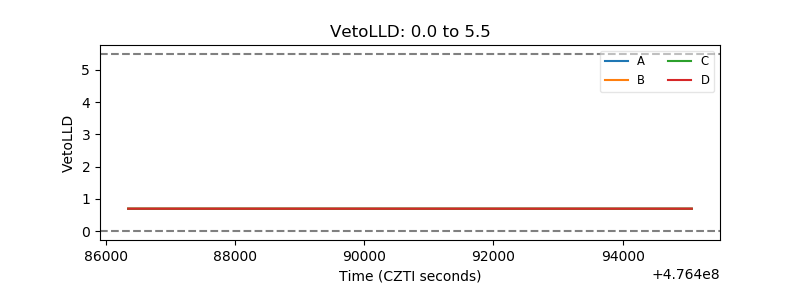 |
| Alpha Counter | 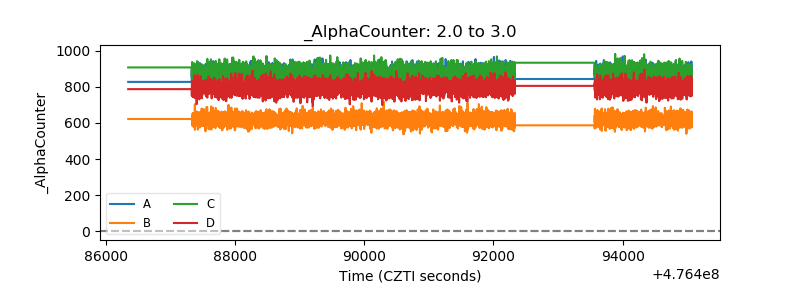 |
| _CPM_Rate | 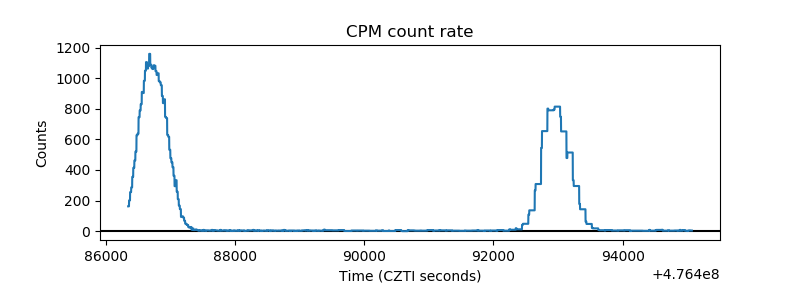 |
| CZT Counter | 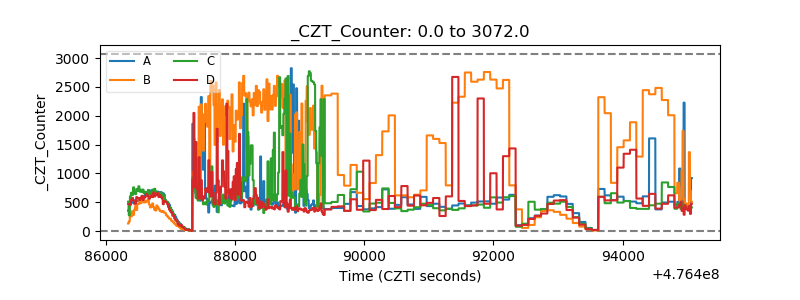 |
| +2.5 Volts monitor | 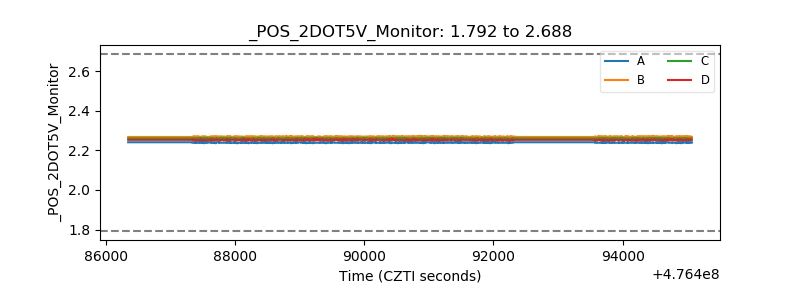 |
| +5 Volts monitor | 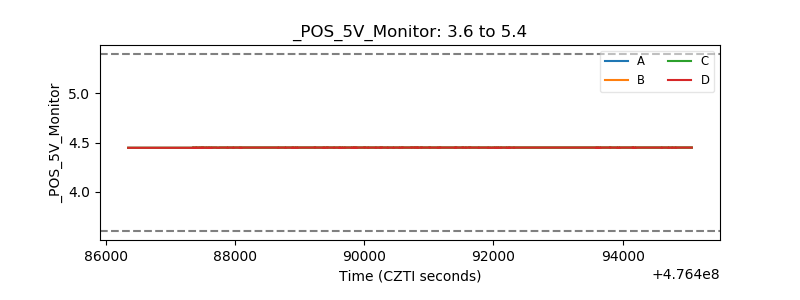 |
| _ROLL_ROT | 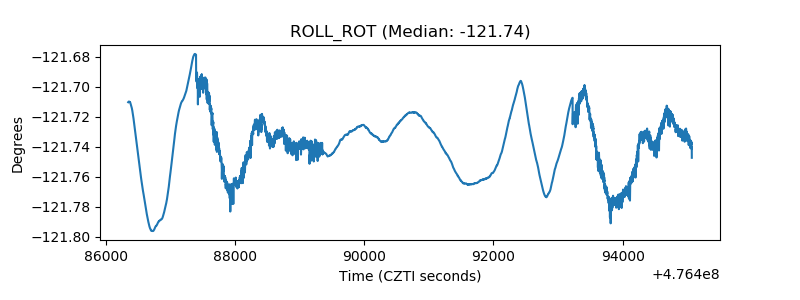 |
| _Roll_DEC | 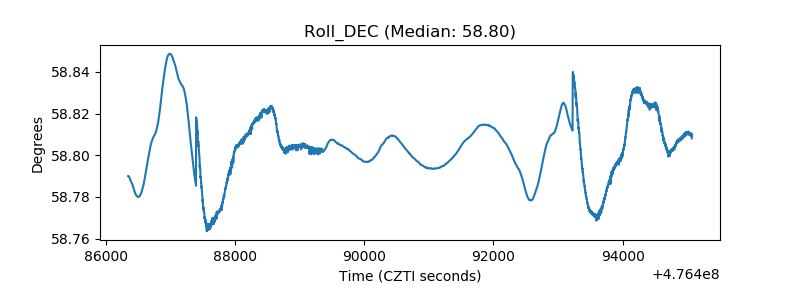 |
| _Roll_RA | 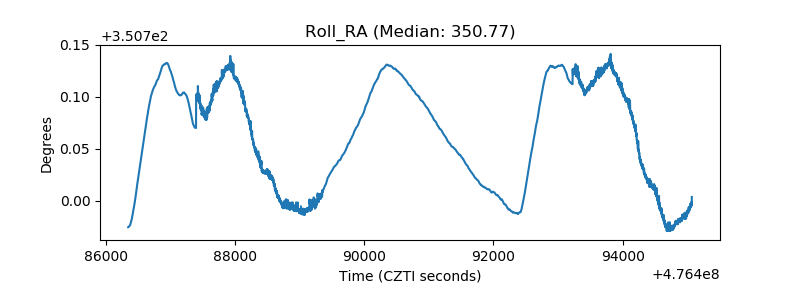 |
| Veto Counter | 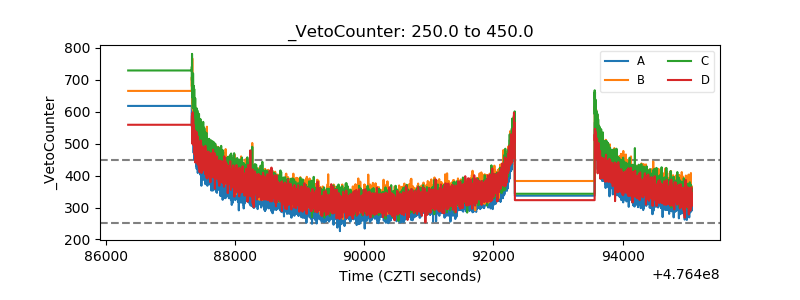 |