| Param | Original file | Final file |
|---|---|---|
| Filename | modeM0/AS1T05_239T01_9000006444_50625cztM0_level2.fits | modeM0/AS1T05_239T01_9000006444_50625cztM0_level2_quad_clean.evt |
| Size (bytes) | 614,033,280 | 91,327,680 |
| Size | 585.6 MB | 87.1 MB |
| Events in quadrant A | 3,810,883 | 629,852 |
| Events in quadrant B | 10,330,226 | 466,341 |
| Events in quadrant C | 3,786,743 | 628,485 |
| Events in quadrant D | 4,285,123 | 576,851 |
| Mode M0 | |||
|---|---|---|---|
| Quadrant | BADHDUFLAG | Total packets | Discarded packets |
| A | 0 | 15822 | 2 |
| B | 0 | 35233 | 2 |
| C | 0 | 16027 | 2 |
| D | 0 | 17621 | 2 |
| Mode M9 | |||
|---|---|---|---|
| Quadrant | BADHDUFLAG | Total packets | Discarded packets |
| A | 0 | 17 | 0 |
| B | 0 | 18 | 0 |
| C | 0 | 18 | 0 |
| D | 0 | 18 | 0 |
| Mode SS | |||
|---|---|---|---|
| Quadrant | BADHDUFLAG | Total packets | Discarded packets |
| A | 0 | 134 | 0 |
| B | 0 | 134 | 0 |
| C | 0 | 134 | 0 |
| D | 0 | 134 | 0 |
| Quadrant | Total seconds | Saturated seconds | Saturation percentage |
|---|---|---|---|
| A | 6652 | 192 | 2.886350% |
| B | 6652 | 2666 | 40.078172% |
| C | 6652 | 152 | 2.285027% |
| D | 6652 | 279 | 4.194227% |
Noise dominated data is calculated using 1-second bins in cleaned event files. If a bin has >2000 counts, and if more than 50% of those come from <1% of pixels, then it is considered to be noise-dominated and hence unusable.
| Quadrant | # 1 sec bins | Bins with >0 counts | Bins with >2000 counts | High rate bins dominated by noise | Noise dominated (total time) | Noise dominated (detector-on time) | Marked lightcurve |
|---|---|---|---|---|---|---|---|
| A | 7802 | 6652 | 107 | 107 | 1.37% | 1.61% | 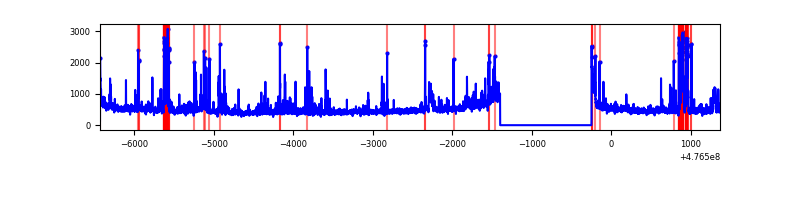 |
| B | 7801 | 6651 | 2253 | 2253 | 28.88% | 33.87% | 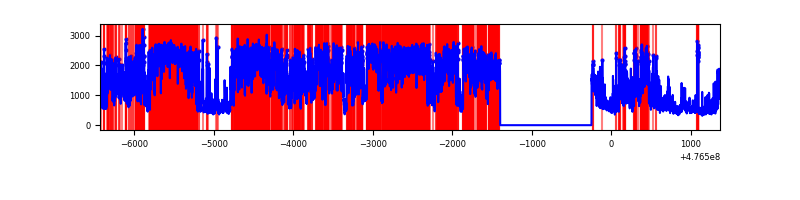 |
| C | 7802 | 6653 | 139 | 139 | 1.78% | 2.09% | 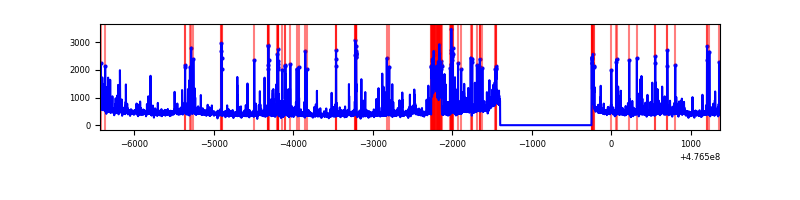 |
| D | 7802 | 6652 | 211 | 211 | 2.70% | 3.17% | 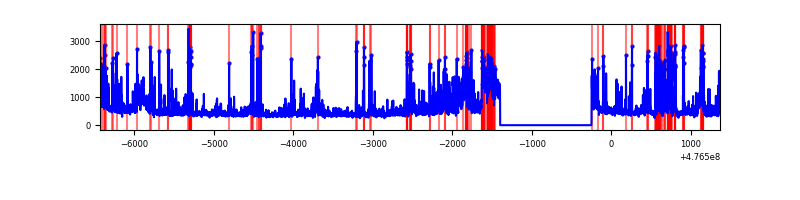 |
Top three noisy pixels from each quadrant. If the there are fewer than three noisy pixels in the level2.evt file, extra rows are filled as -1
| Pixel properties | Quadrant properties | ||||||
|---|---|---|---|---|---|---|---|
| Quadrant | DetID | PixID | Counts | Sigma | Mean | Median | Sigma |
| A | 4 | 3 | 195771 | 1114.0 | 709 | 689 | 175.1 |
| A | 8 | 38 | 194652 | 1107.61 | 709 | 689 | 175.1 |
| A | 8 | 247 | 84212 | 476.95 | 709 | 689 | 175.1 |
| B | 4 | 170 | 4762678 | 35960.47 | 624 | 603 | 132.4 |
| B | 7 | 0 | 1116369 | 8425.63 | 624 | 603 | 132.4 |
| B | 5 | 172 | 909146 | 6860.8 | 624 | 603 | 132.4 |
| C | 13 | 3 | 250987 | 1299.22 | 697 | 693 | 192.6 |
| C | 10 | 69 | 173381 | 896.39 | 697 | 693 | 192.6 |
| C | 0 | 224 | 109239 | 563.44 | 697 | 693 | 192.6 |
| D | 11 | 245 | 236271 | 1242.68 | 680 | 654 | 189.6 |
| D | 2 | 249 | 233500 | 1228.07 | 680 | 654 | 189.6 |
| D | 1 | 47 | 168519 | 885.35 | 680 | 654 | 189.6 |
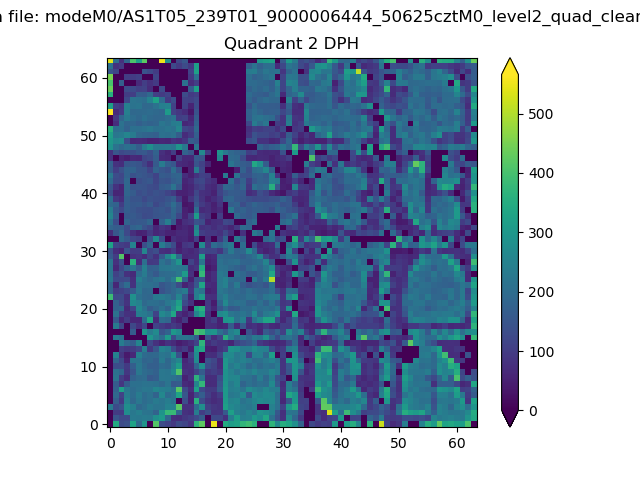
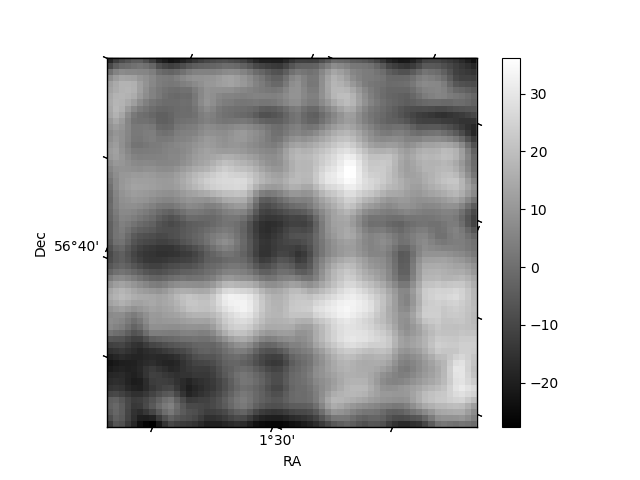
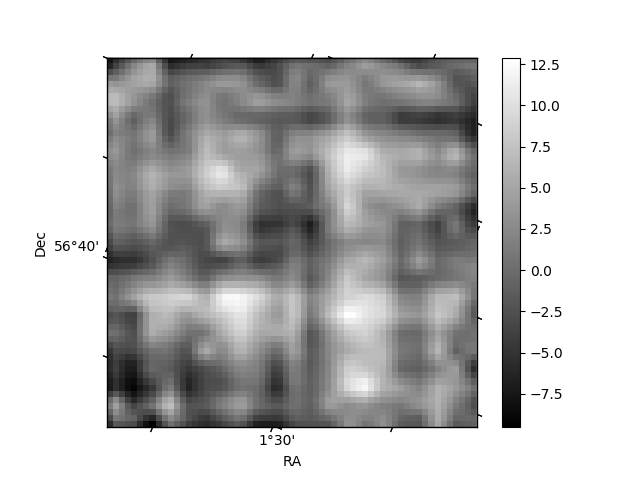
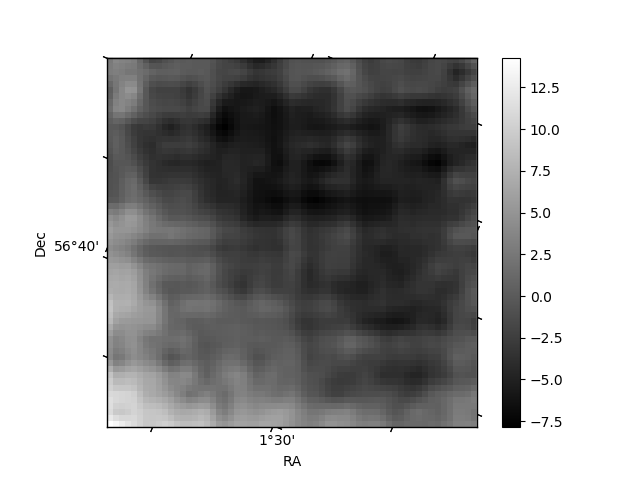
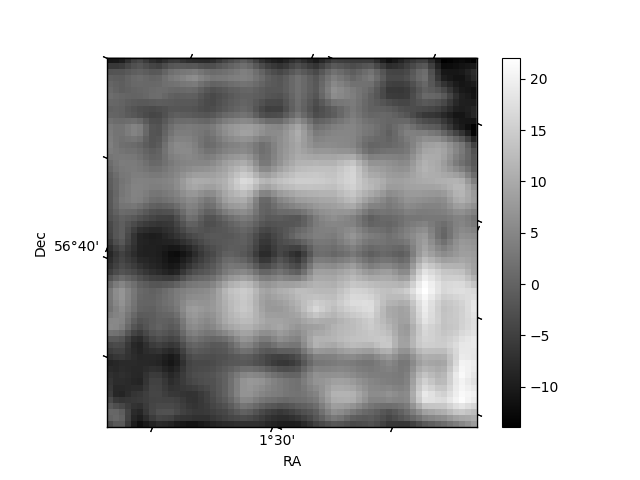
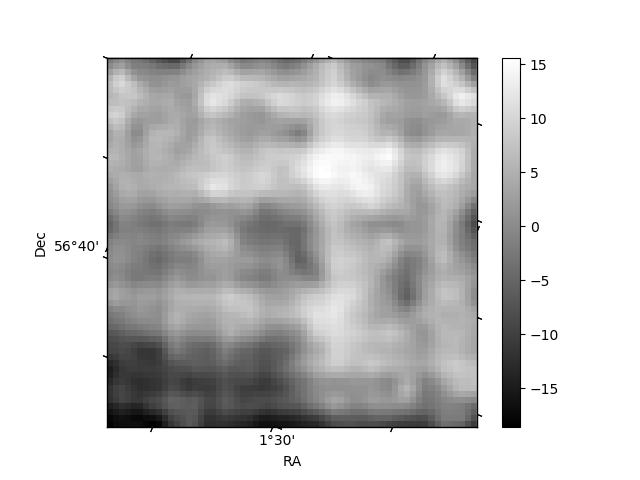
Histogram calculated using DETX and DETY for each event in the final _common_clean file
| Quadrant A | 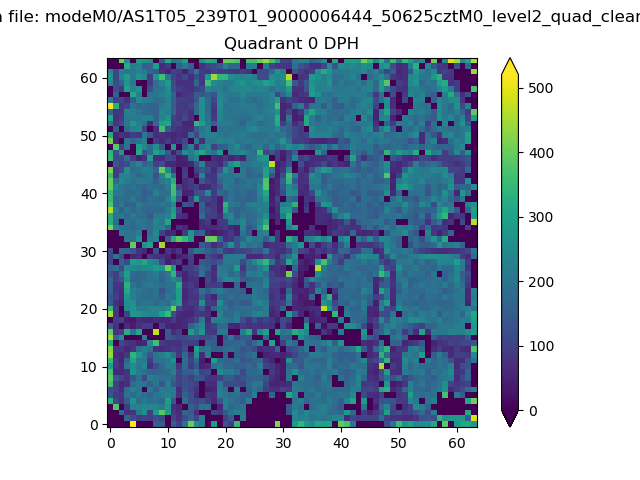 |
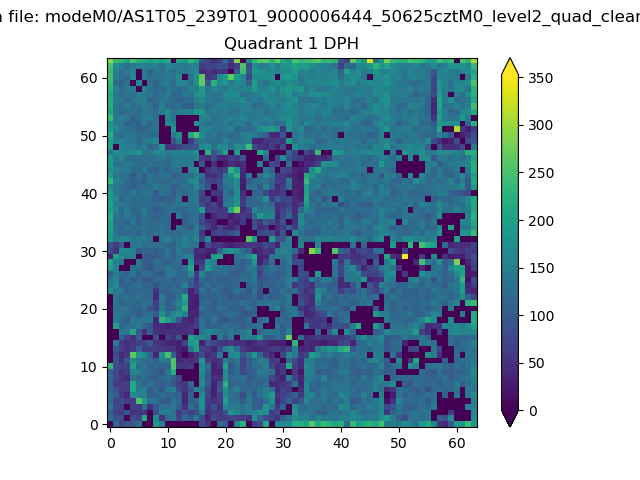 |
Quadrant B |
|---|---|---|---|
| Quadrant D | 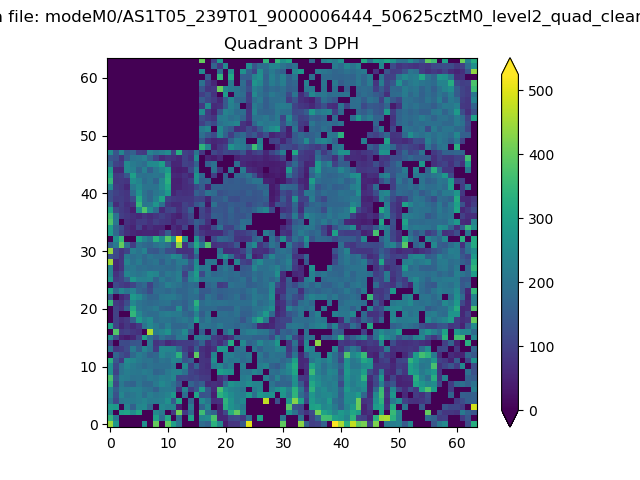 |
 |
Quadrant C |
| Plot type | Count rate plots | Images |
|---|---|---|
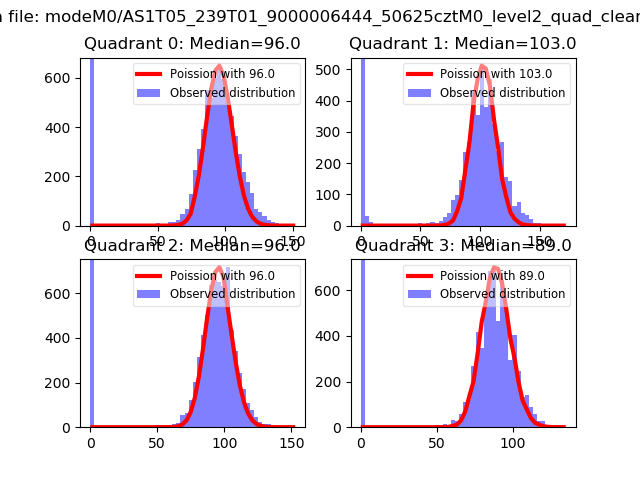
| Comparison with Poisson distribution Blue bars denote a histogram of data divided into 1 sec bins. Red curve is a Poisson curve with rate = median count rate of data. |
 |
 |
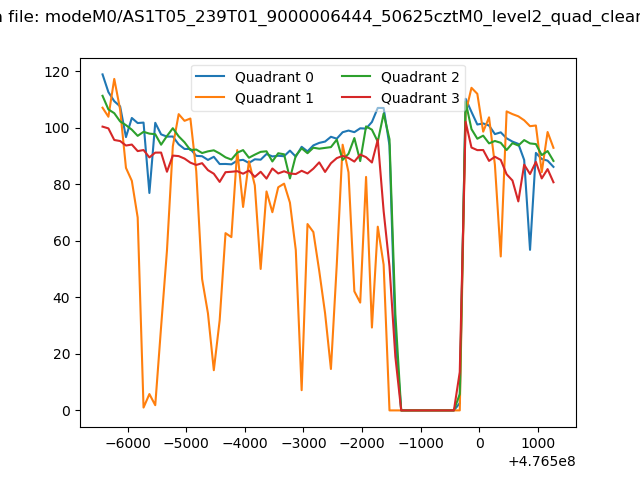
| Quadrant-wise count rates Data is divided into 100 sec bins |
 |
|
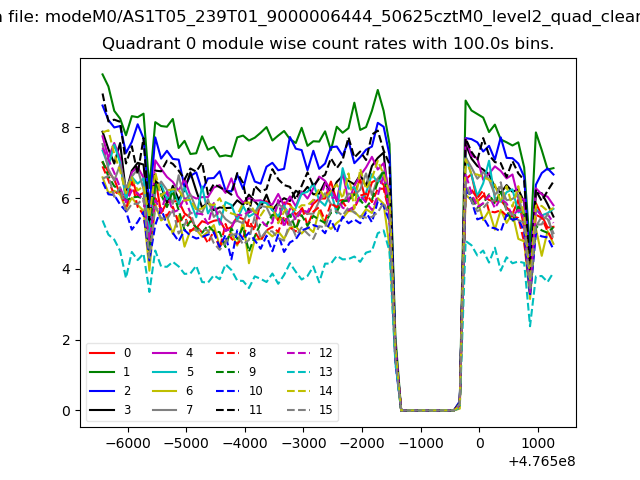
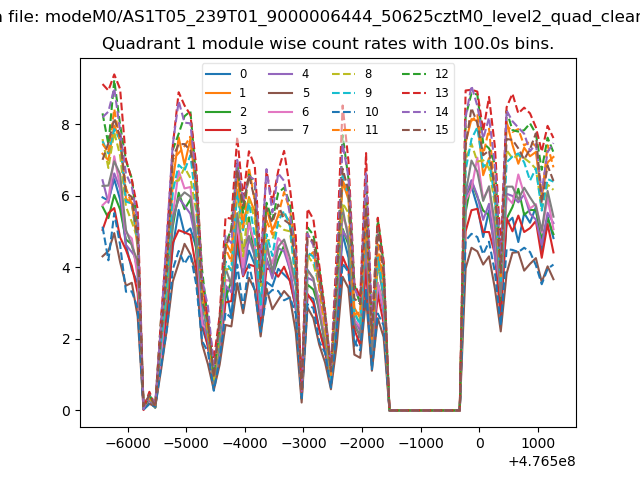
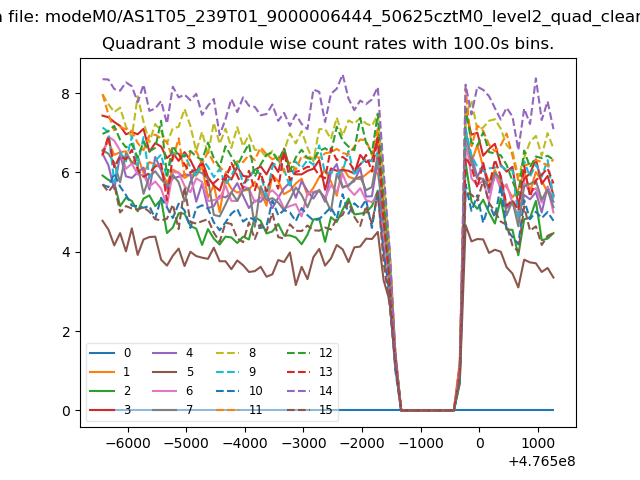
| Module-wise count rates for Quadrant A Data is divided into 100 sec bins |
 |
 |
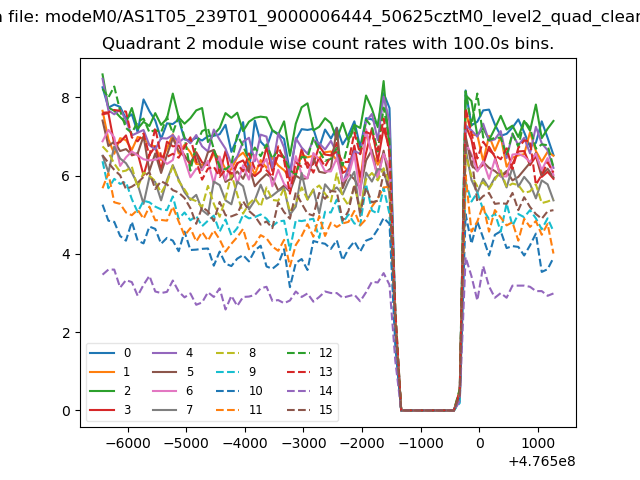
| Module-wise count rates for Quadrant B Data is divided into 100 sec bins |
 |
 |
| Module-wise count rates for Quadrant C Data is divided into 100 sec bins |
 |
 |
| Module-wise count rates for Quadrant D Data is divided into 100 sec bins |
 |
 |
| Parameter | Plot |
|---|---|
| CZT HV Monitor | 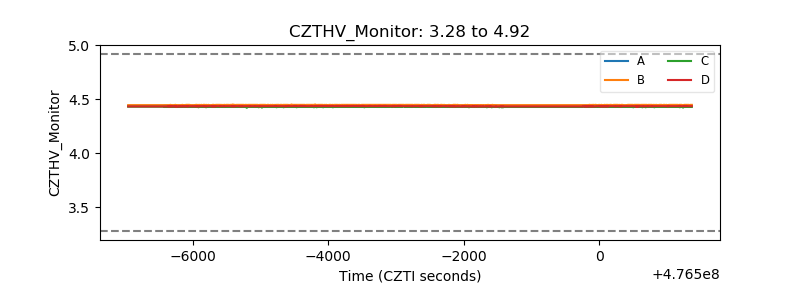 |
| D_VDD | 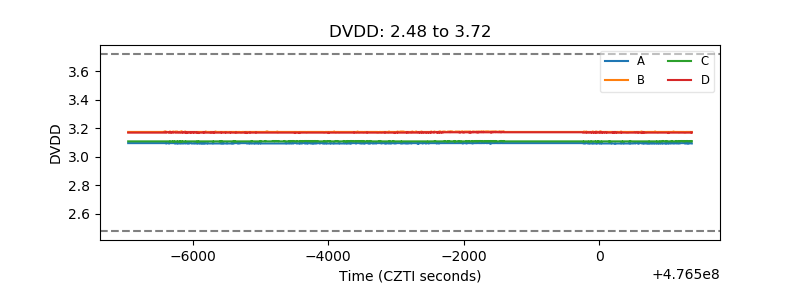 |
| Temperature 1 | 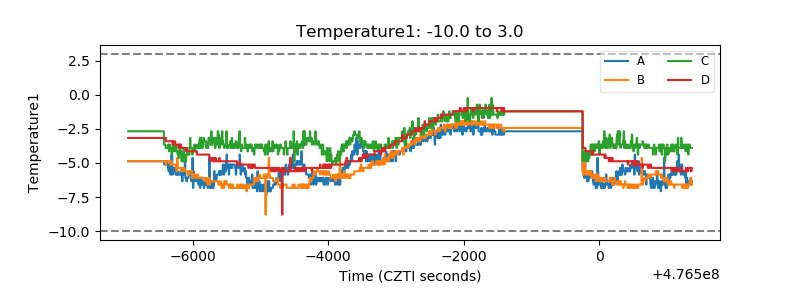 |
| Veto HV Monitor | 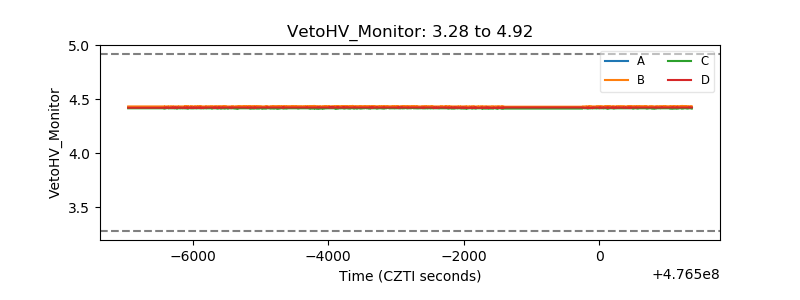 |
| Veto LLD | 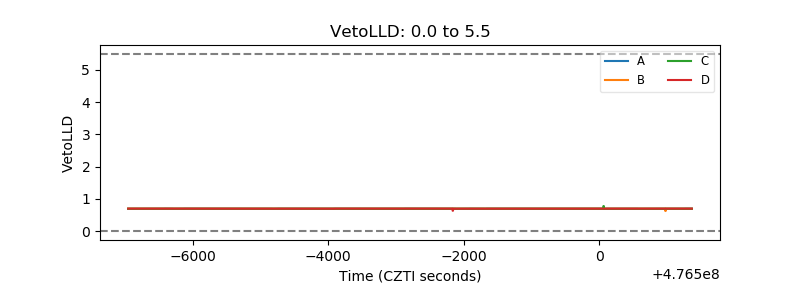 |
| Alpha Counter | 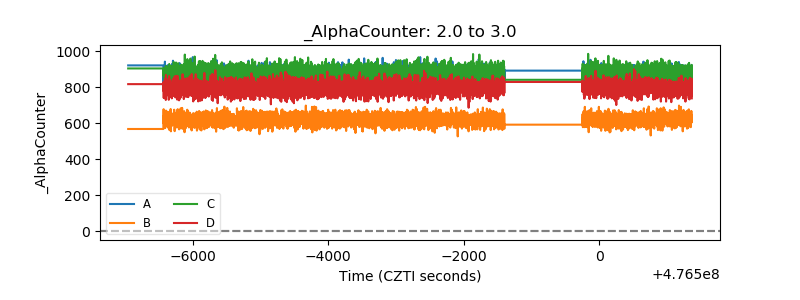 |
| _CPM_Rate | 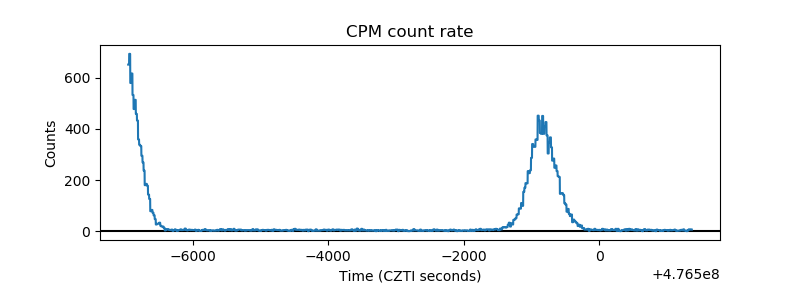 |
| CZT Counter | 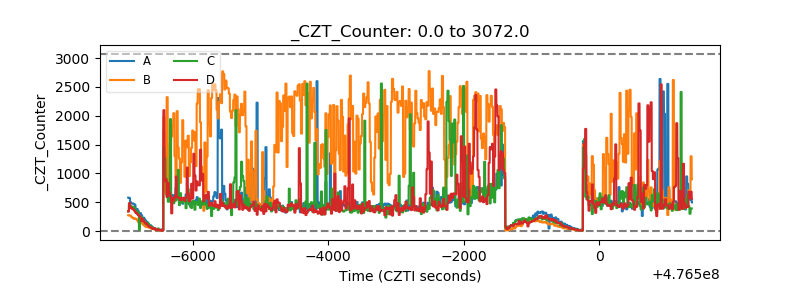 |
| +2.5 Volts monitor | 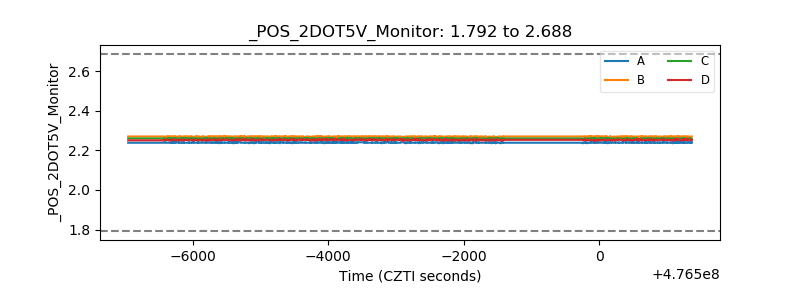 |
| +5 Volts monitor | 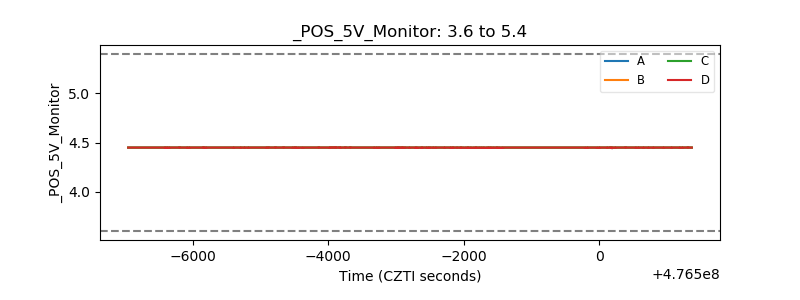 |
| _ROLL_ROT | 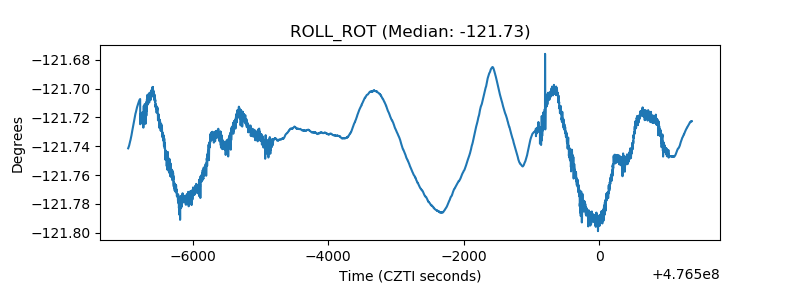 |
| _Roll_DEC | 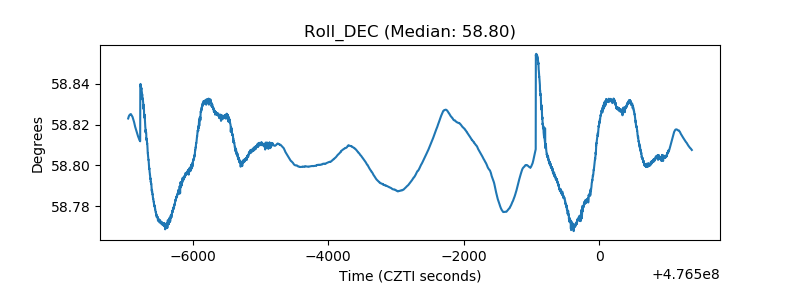 |
| _Roll_RA | 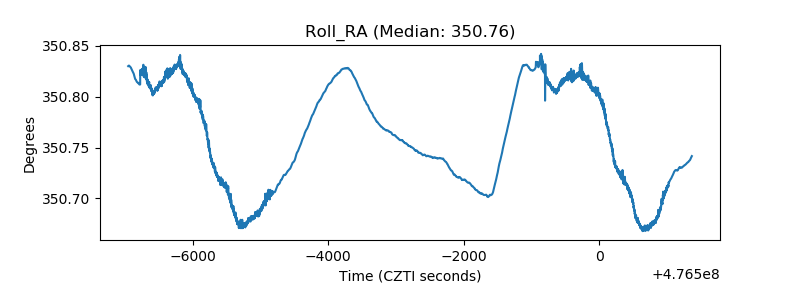 |
| Veto Counter | 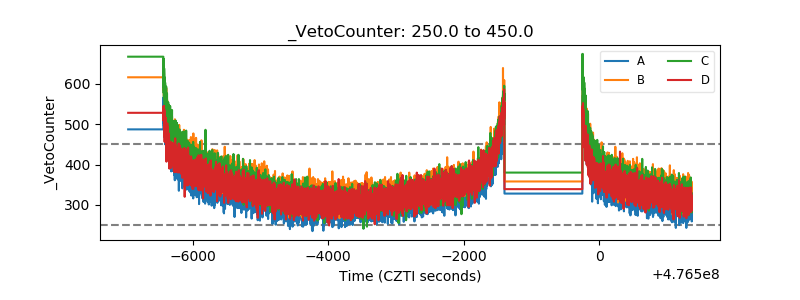 |