| Param | Original file | Final file |
|---|---|---|
| Filename | modeM0/AS1T05_239T01_9000006444_50626cztM0_level2.fits | modeM0/AS1T05_239T01_9000006444_50626cztM0_level2_quad_clean.evt |
| Size (bytes) | 595,440,000 | 95,241,600 |
| Size | 567.9 MB | 90.8 MB |
| Events in quadrant A | 4,174,382 | 641,096 |
| Events in quadrant B | 7,822,443 | 572,768 |
| Events in quadrant C | 4,385,792 | 616,869 |
| Events in quadrant D | 5,121,564 | 571,399 |
| Mode M0 | |||
|---|---|---|---|
| Quadrant | BADHDUFLAG | Total packets | Discarded packets |
| A | 0 | 17094 | 1 |
| B | 0 | 28027 | 1 |
| C | 0 | 18025 | 11 |
| D | 0 | 20292 | 1 |
| Mode M9 | |||
|---|---|---|---|
| Quadrant | BADHDUFLAG | Total packets | Discarded packets |
| A | 0 | 21 | 0 |
| B | 0 | 22 | 0 |
| C | 0 | 22 | 0 |
| D | 0 | 22 | 0 |
| Mode SS | |||
|---|---|---|---|
| Quadrant | BADHDUFLAG | Total packets | Discarded packets |
| A | 0 | 140 | 0 |
| B | 0 | 140 | 0 |
| C | 0 | 140 | 0 |
| D | 0 | 140 | 0 |
| Quadrant | Total seconds | Saturated seconds | Saturation percentage |
|---|---|---|---|
| A | 6921 | 213 | 3.077590% |
| B | 6921 | 1594 | 23.031354% |
| C | 6919 | 363 | 5.246423% |
| D | 6921 | 480 | 6.935414% |
Noise dominated data is calculated using 1-second bins in cleaned event files. If a bin has >2000 counts, and if more than 50% of those come from <1% of pixels, then it is considered to be noise-dominated and hence unusable.
| Quadrant | # 1 sec bins | Bins with >0 counts | Bins with >2000 counts | High rate bins dominated by noise | Noise dominated (total time) | Noise dominated (detector-on time) | Marked lightcurve |
|---|---|---|---|---|---|---|---|
| A | 7831 | 6921 | 106 | 106 | 1.35% | 1.53% | 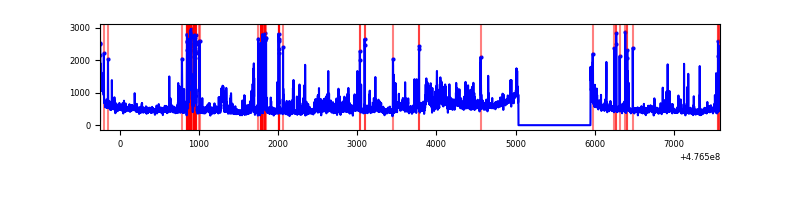 |
| B | 7831 | 6921 | 1230 | 1230 | 15.71% | 17.77% | 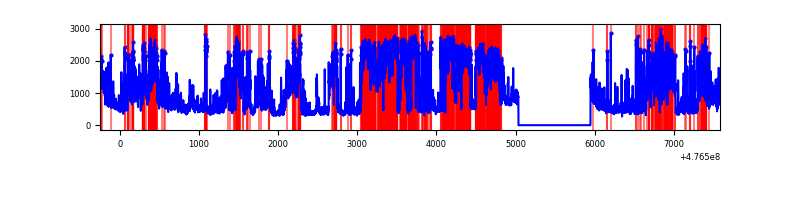 |
| C | 7831 | 6919 | 257 | 257 | 3.28% | 3.71% | 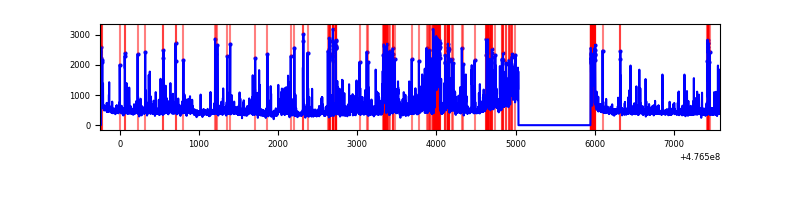 |
| D | 7831 | 6921 | 442 | 442 | 5.64% | 6.39% | 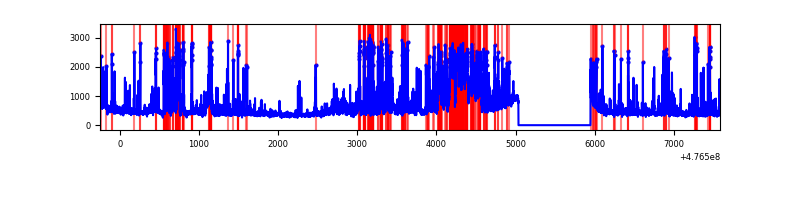 |
Top three noisy pixels from each quadrant. If the there are fewer than three noisy pixels in the level2.evt file, extra rows are filled as -1
| Pixel properties | Quadrant properties | ||||||
|---|---|---|---|---|---|---|---|
| Quadrant | DetID | PixID | Counts | Sigma | Mean | Median | Sigma |
| A | 4 | 3 | 261509 | 1450.14 | 730 | 715 | 179.8 |
| A | 9 | 96 | 144278 | 798.28 | 730 | 715 | 179.8 |
| A | 8 | 38 | 110837 | 612.33 | 730 | 715 | 179.8 |
| B | 4 | 170 | 3577881 | 24673.02 | 684 | 661 | 145.0 |
| B | 7 | 0 | 520432 | 3585.0 | 684 | 661 | 145.0 |
| B | 5 | 185 | 252325 | 1735.79 | 684 | 661 | 145.0 |
| C | 4 | 5 | 297702 | 1531.31 | 706 | 701 | 194.0 |
| C | 15 | 232 | 265779 | 1366.72 | 706 | 701 | 194.0 |
| C | 15 | 174 | 191048 | 981.41 | 706 | 701 | 194.0 |
| D | 11 | 245 | 603464 | 3074.33 | 697 | 670 | 196.1 |
| D | 8 | 246 | 354134 | 1802.72 | 697 | 670 | 196.1 |
| D | 2 | 249 | 199431 | 1013.71 | 697 | 670 | 196.1 |
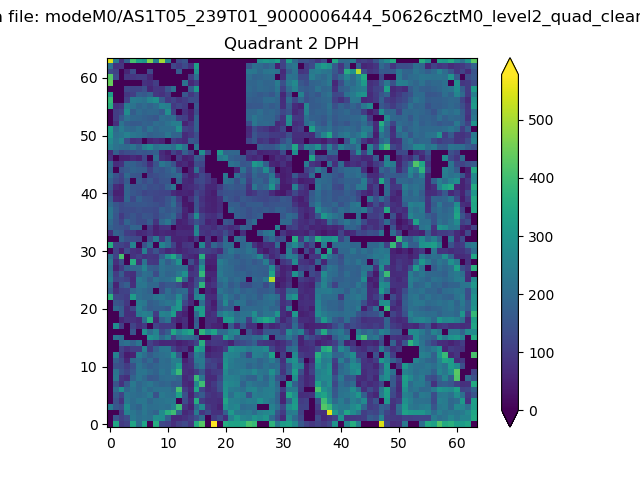
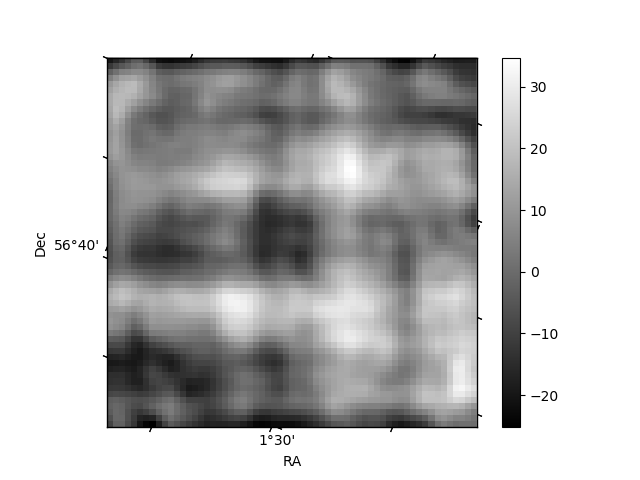
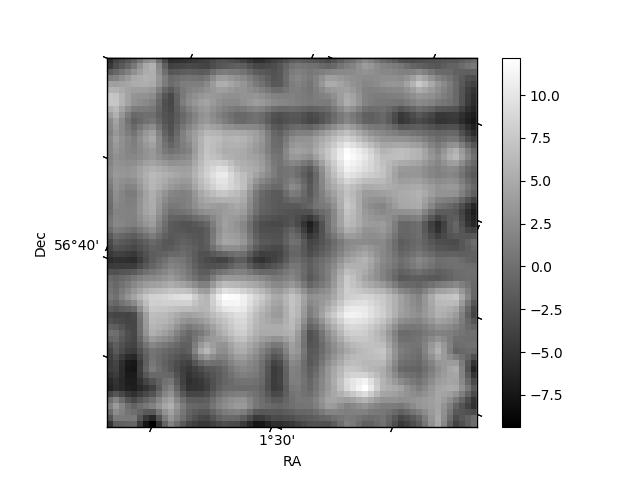
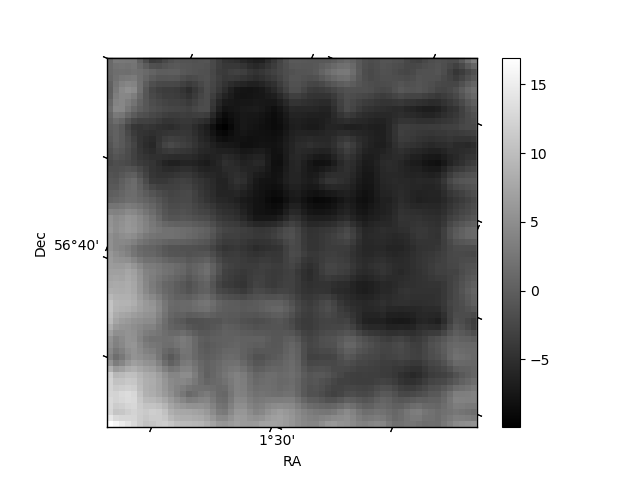
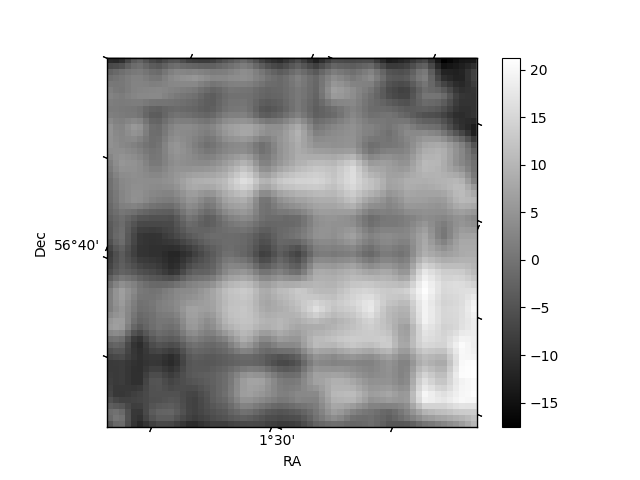
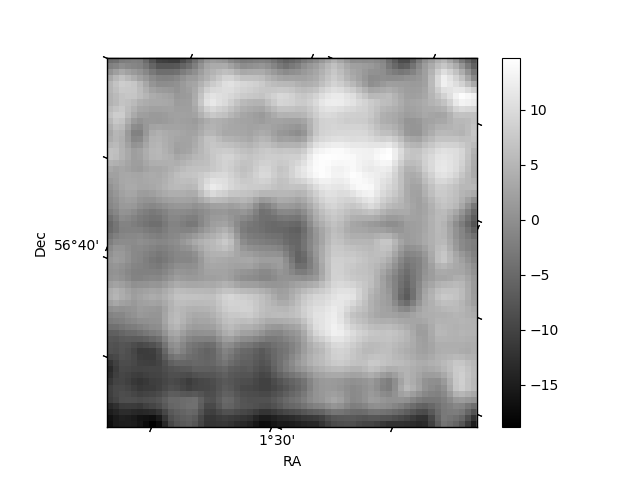
Histogram calculated using DETX and DETY for each event in the final _common_clean file
| Quadrant A | 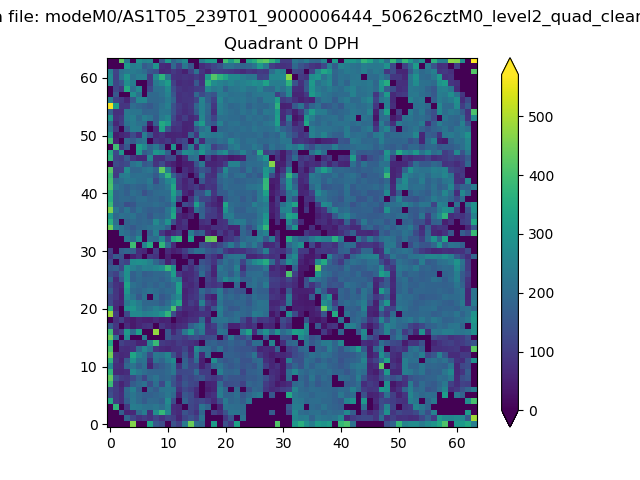 |
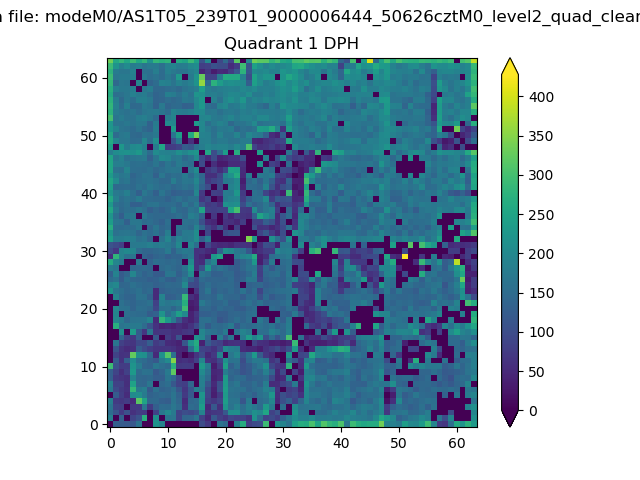 |
Quadrant B |
|---|---|---|---|
| Quadrant D | 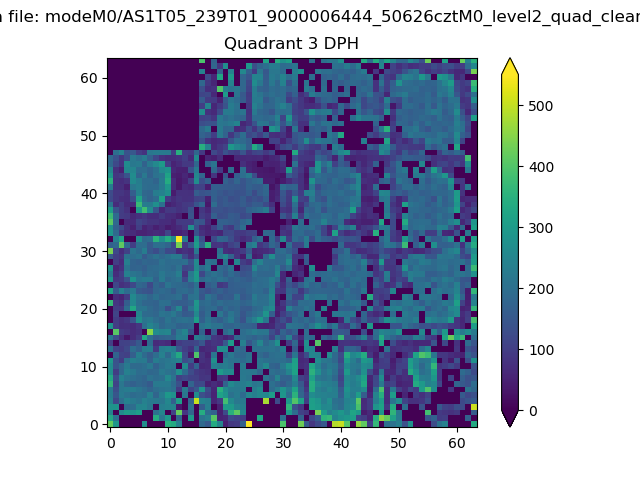 |
 |
Quadrant C |
| Plot type | Count rate plots | Images |
|---|---|---|
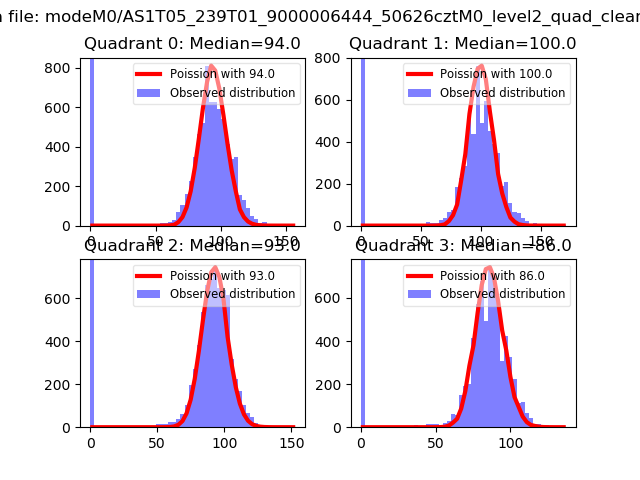
| Comparison with Poisson distribution Blue bars denote a histogram of data divided into 1 sec bins. Red curve is a Poisson curve with rate = median count rate of data. |
 |
 |
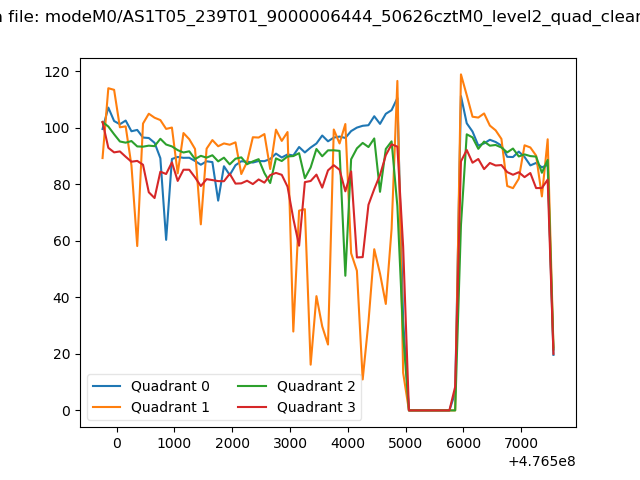
| Quadrant-wise count rates Data is divided into 100 sec bins |
 |
|
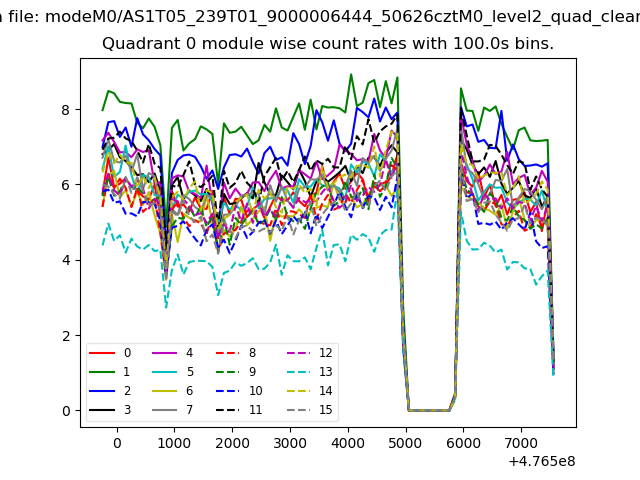
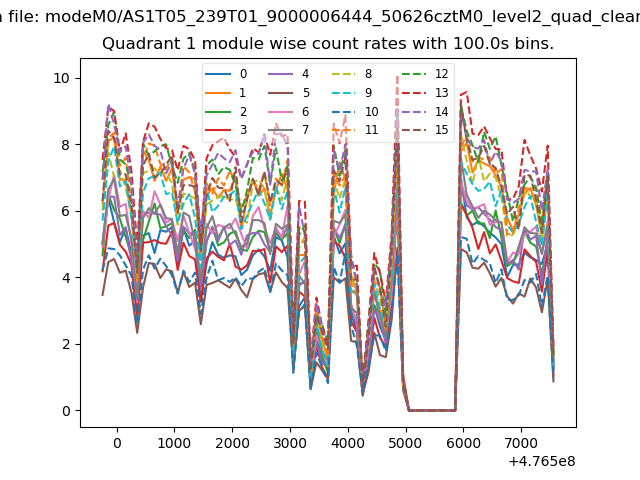
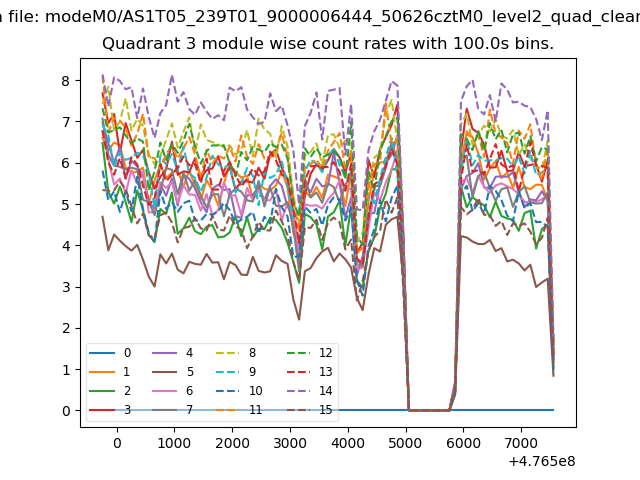
| Module-wise count rates for Quadrant A Data is divided into 100 sec bins |
 |
 |
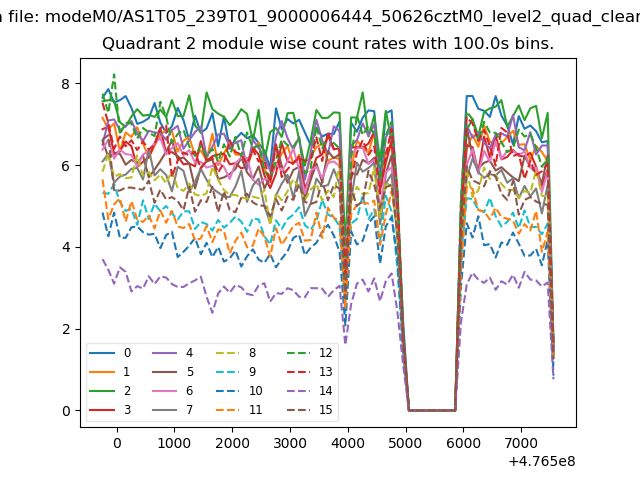
| Module-wise count rates for Quadrant B Data is divided into 100 sec bins |
 |
 |
| Module-wise count rates for Quadrant C Data is divided into 100 sec bins |
 |
 |
| Module-wise count rates for Quadrant D Data is divided into 100 sec bins |
 |
 |
| Parameter | Plot |
|---|---|
| CZT HV Monitor | 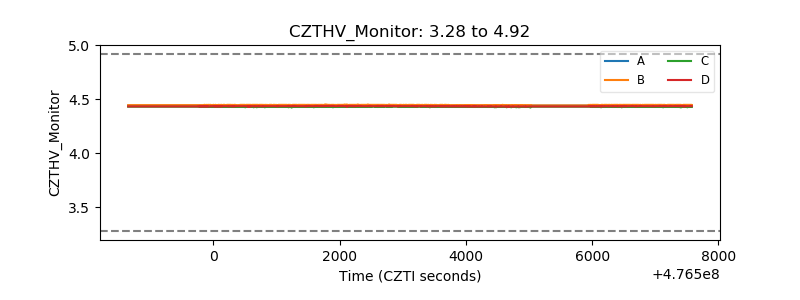 |
| D_VDD | 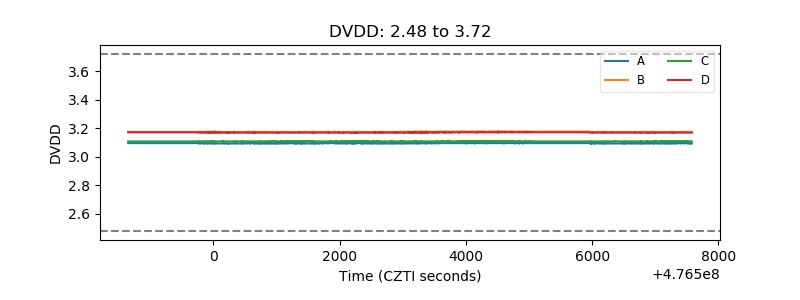 |
| Temperature 1 | 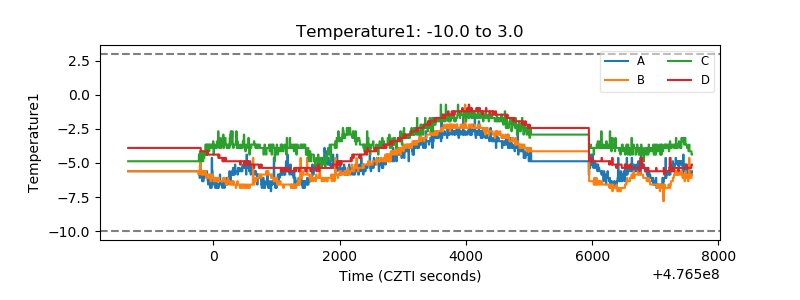 |
| Veto HV Monitor | 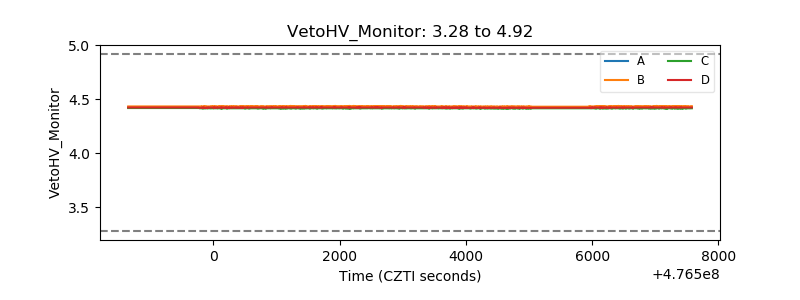 |
| Veto LLD | 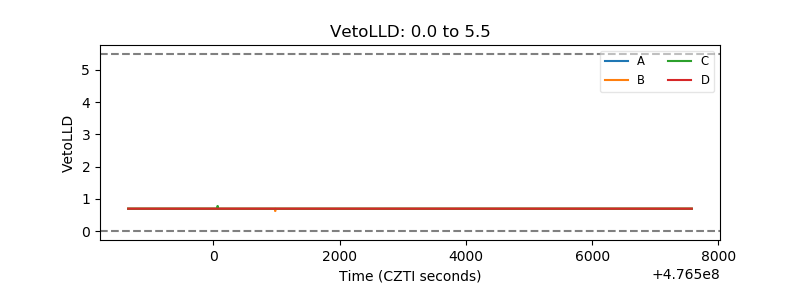 |
| Alpha Counter | 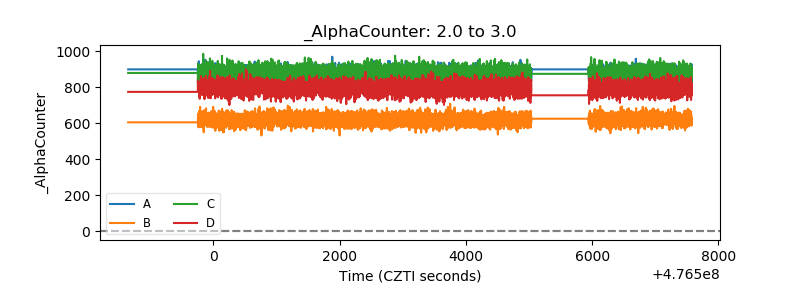 |
| _CPM_Rate | 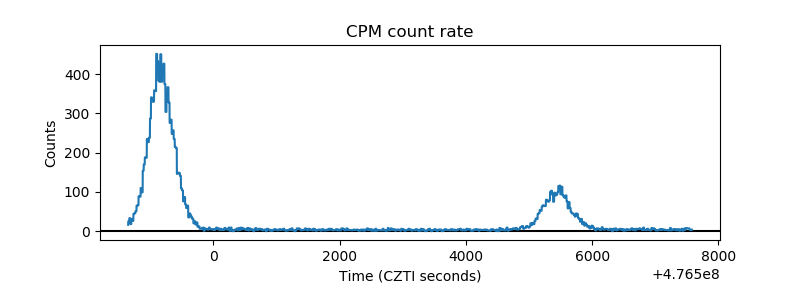 |
| CZT Counter | 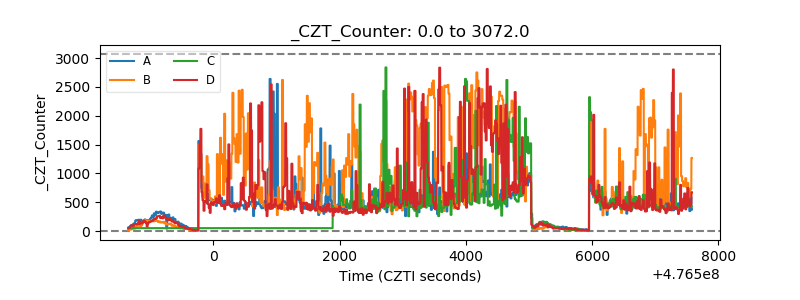 |
| +2.5 Volts monitor |  |
| +5 Volts monitor |  |
| _ROLL_ROT | 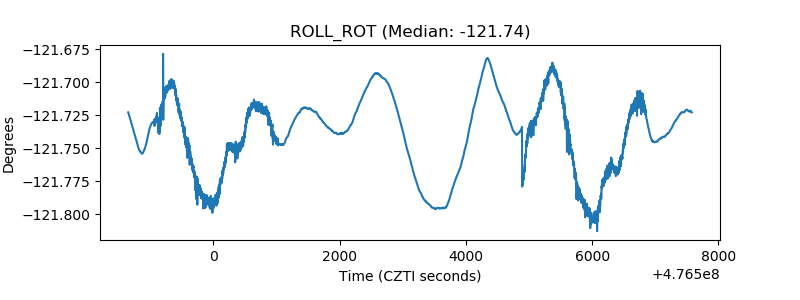 |
| _Roll_DEC | 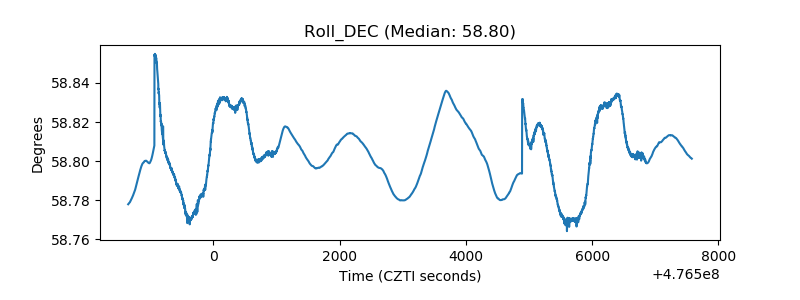 |
| _Roll_RA | 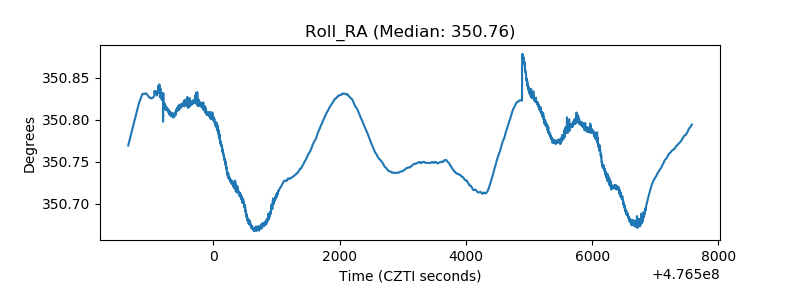 |
| Veto Counter | 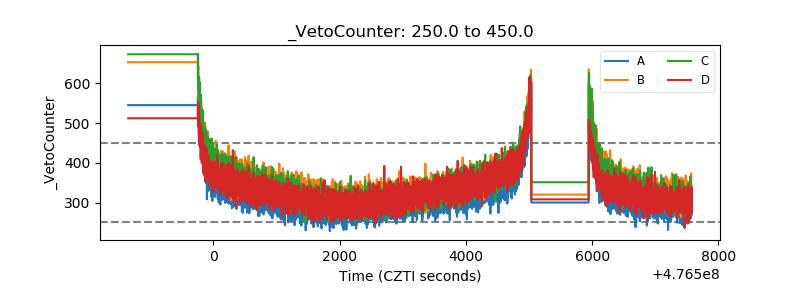 |