| Param | Original file | Final file |
|---|---|---|
| Filename | modeM0/AS1T05_239T01_9000006444_50629cztM0_level2.fits | modeM0/AS1T05_239T01_9000006444_50629cztM0_level2_quad_clean.evt |
| Size (bytes) | 543,821,760 | 64,209,600 |
| Size | 518.6 MB | 61.2 MB |
| Events in quadrant A | 2,829,628 | 452,197 |
| Events in quadrant B | 6,968,965 | 391,669 |
| Events in quadrant C | 6,511,524 | 335,275 |
| Events in quadrant D | 3,429,415 | 411,163 |
| Mode M0 | |||
|---|---|---|---|
| Quadrant | BADHDUFLAG | Total packets | Discarded packets |
| A | 0 | 12722 | 757 |
| B | 0 | 26531 | 2327 |
| C | 0 | 24931 | 2111 |
| D | 0 | 14912 | 1121 |
| Mode SS | |||
|---|---|---|---|
| Quadrant | BADHDUFLAG | Total packets | Discarded packets |
| A | 0 | 111 | 7 |
| B | 0 | 112 | 12 |
| C | 0 | 110 | 6 |
| D | 0 | 112 | 10 |
| Quadrant | Total seconds | Saturated seconds | Saturation percentage |
|---|---|---|---|
| A | 5084 | 112 | 2.202990% |
| B | 5001 | 1385 | 27.694461% |
| C | 5003 | 1546 | 30.901459% |
| D | 5052 | 149 | 2.949327% |
Noise dominated data is calculated using 1-second bins in cleaned event files. If a bin has >2000 counts, and if more than 50% of those come from <1% of pixels, then it is considered to be noise-dominated and hence unusable.
| Quadrant | # 1 sec bins | Bins with >0 counts | Bins with >2000 counts | High rate bins dominated by noise | Noise dominated (total time) | Noise dominated (detector-on time) | Marked lightcurve |
|---|---|---|---|---|---|---|---|
| A | 7323 | 5122 | 81 | 81 | 1.11% | 1.58% | 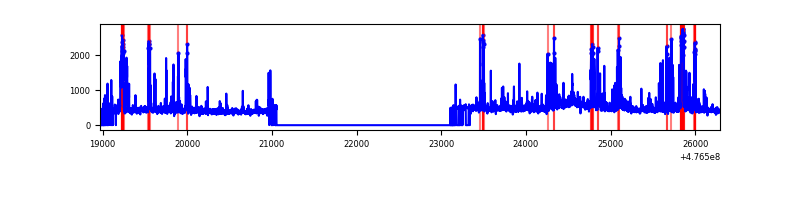 |
| B | 7299 | 5052 | 727 | 727 | 9.96% | 14.39% | 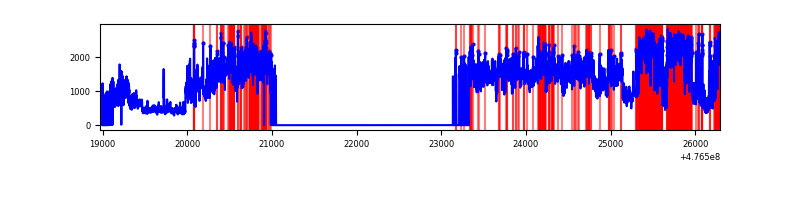 |
| C | 7290 | 5052 | 1456 | 1456 | 19.97% | 28.82% | 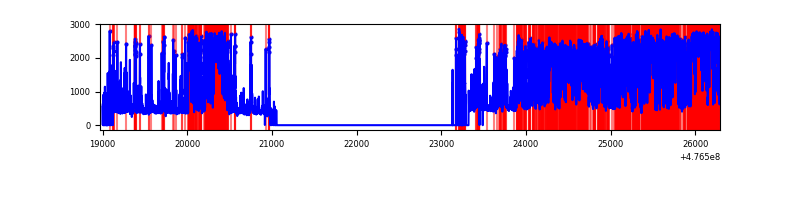 |
| D | 7297 | 5098 | 157 | 157 | 2.15% | 3.08% | 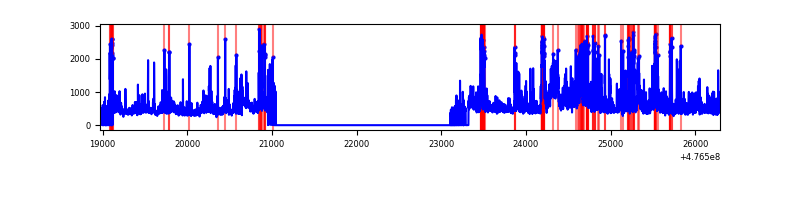 |
Top three noisy pixels from each quadrant. If the there are fewer than three noisy pixels in the level2.evt file, extra rows are filled as -1
| Pixel properties | Quadrant properties | ||||||
|---|---|---|---|---|---|---|---|
| Quadrant | DetID | PixID | Counts | Sigma | Mean | Median | Sigma |
| A | 12 | 250 | 359818 | 2700.18 | 530 | 515 | 133.1 |
| A | 4 | 3 | 112094 | 838.52 | 530 | 515 | 133.1 |
| A | 3 | 114 | 64398 | 480.08 | 530 | 515 | 133.1 |
| B | 4 | 170 | 4560099 | 42884.25 | 486 | 469 | 106.3 |
| B | 5 | 185 | 159578 | 1496.45 | 486 | 469 | 106.3 |
| B | 8 | 128 | 63358 | 591.48 | 486 | 469 | 106.3 |
| C | 15 | 174 | 3948332 | 32394.49 | 438 | 435 | 121.9 |
| C | 0 | 161 | 101140 | 826.34 | 438 | 435 | 121.9 |
| C | 13 | 3 | 95714 | 781.81 | 438 | 435 | 121.9 |
| D | 4 | 115 | 389196 | 2772.7 | 500 | 483 | 140.2 |
| D | 15 | 169 | 159044 | 1131.02 | 500 | 483 | 140.2 |
| D | 7 | 60 | 108653 | 771.58 | 500 | 483 | 140.2 |
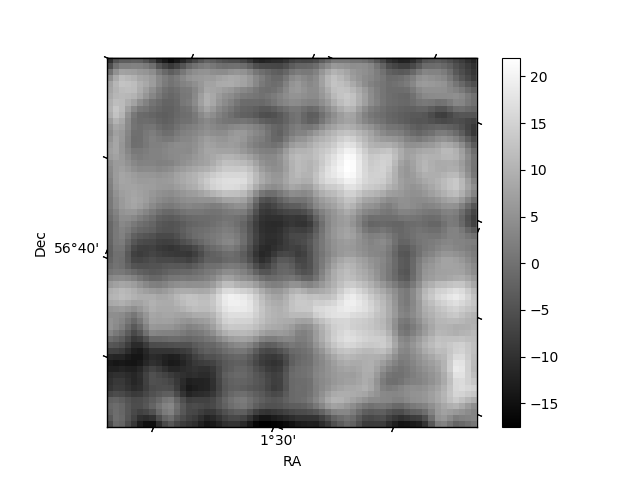
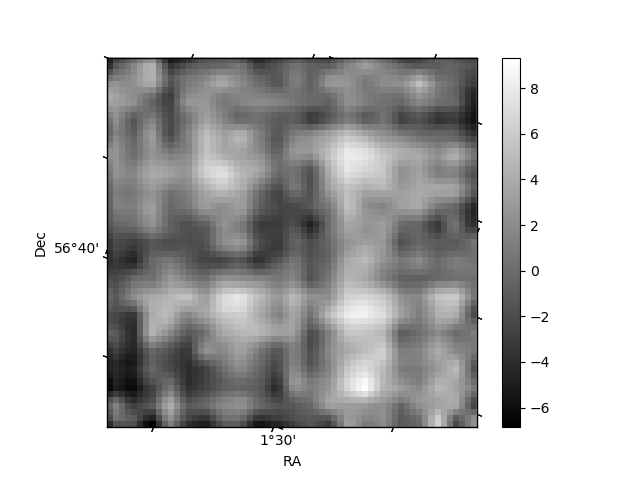
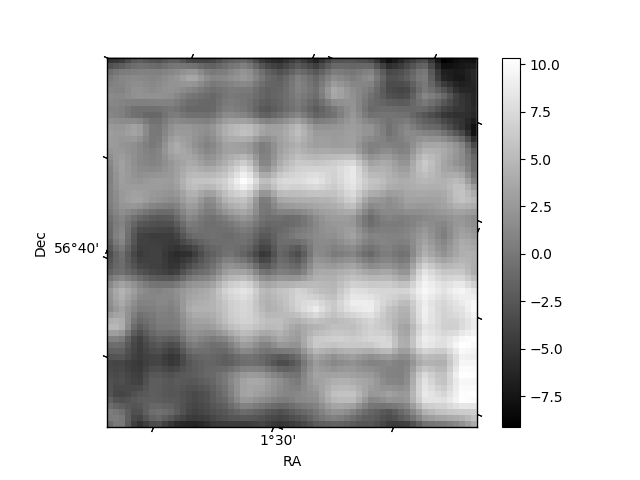
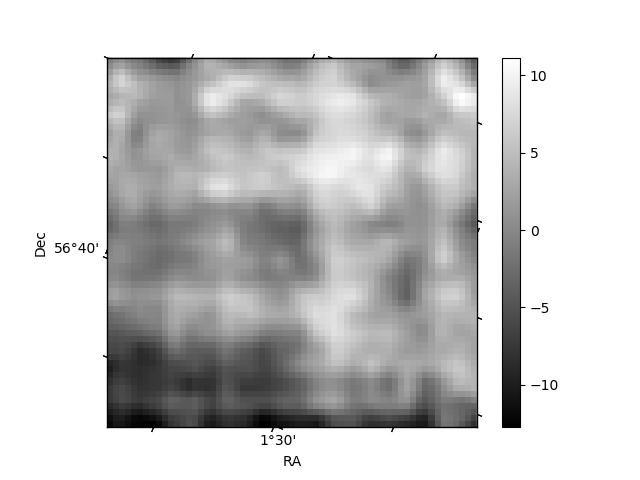
Histogram calculated using DETX and DETY for each event in the final _common_clean file
| Quadrant A | 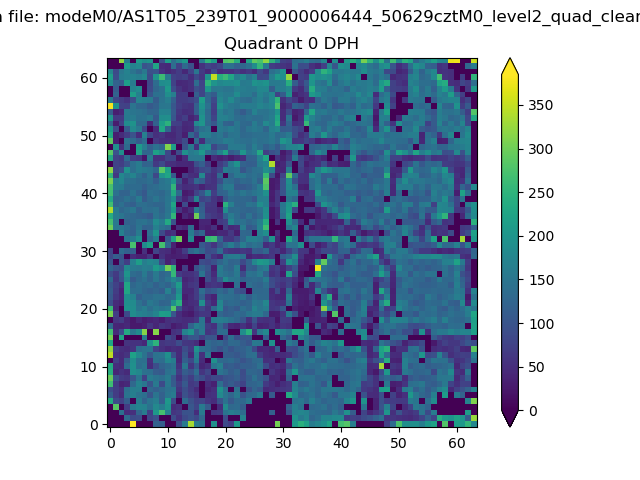 |
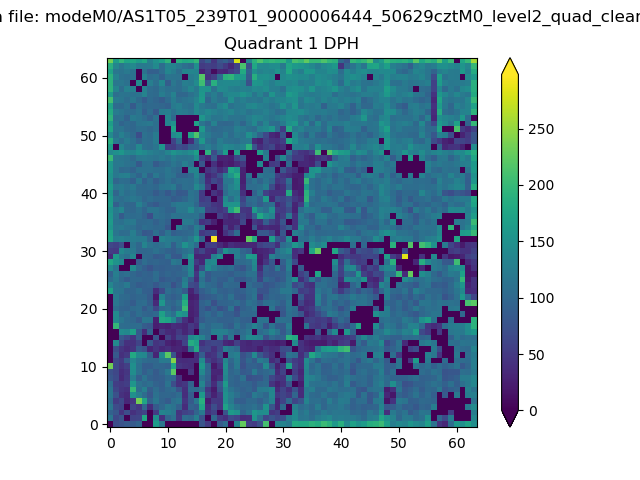 |
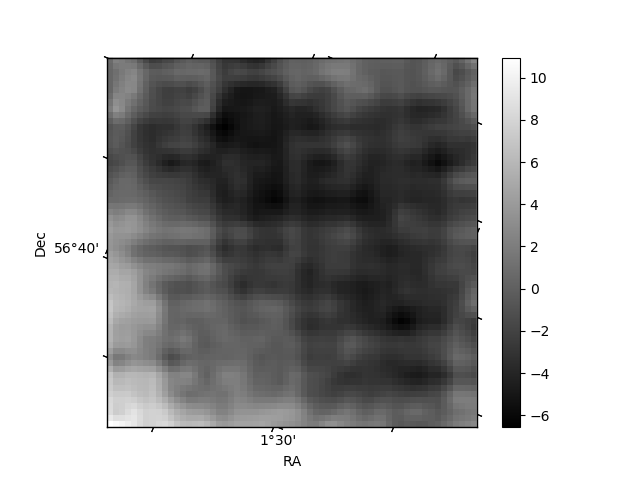
Quadrant B |
|---|---|---|---|
| Quadrant D | 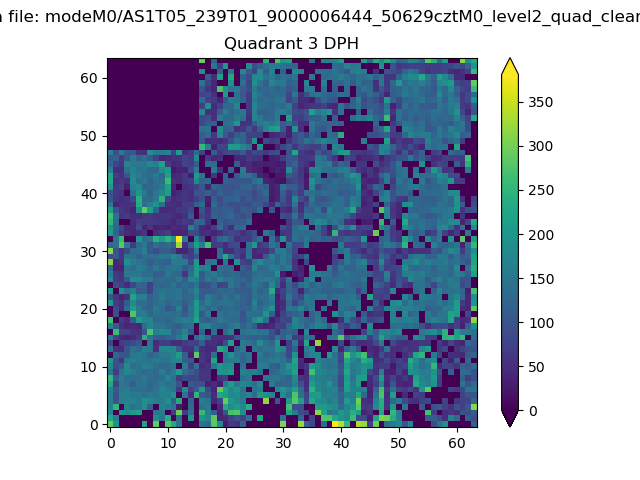 |
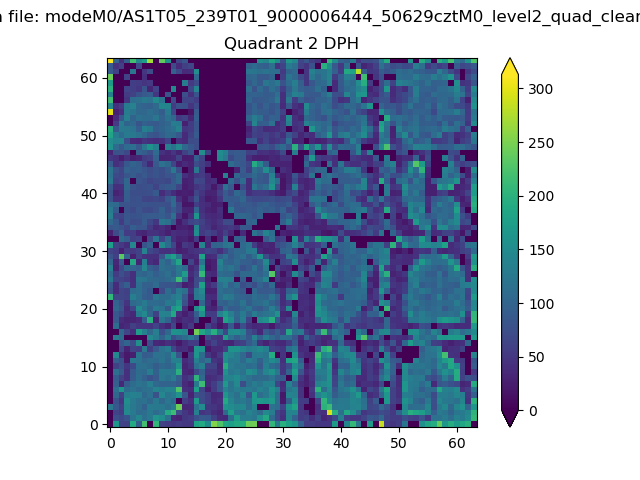 |
Quadrant C |
| Plot type | Count rate plots | Images |
|---|---|---|
| Comparison with Poisson distribution Blue bars denote a histogram of data divided into 1 sec bins. Red curve is a Poisson curve with rate = median count rate of data. |
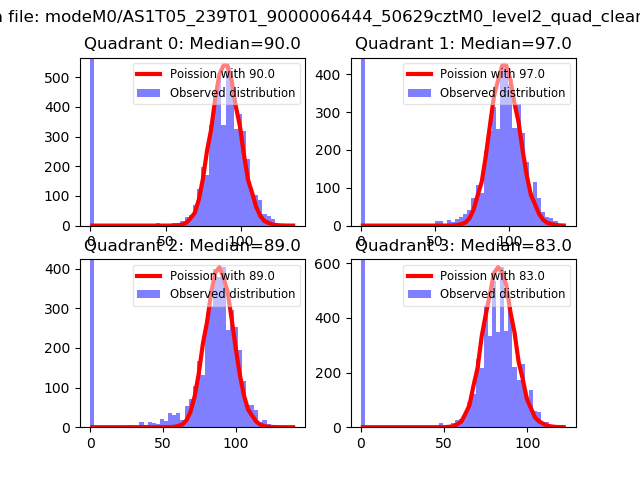 |
 |
| Quadrant-wise count rates Data is divided into 100 sec bins |
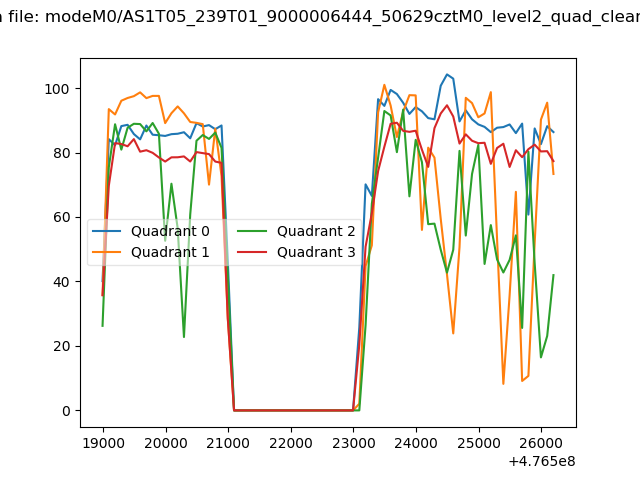 |
|
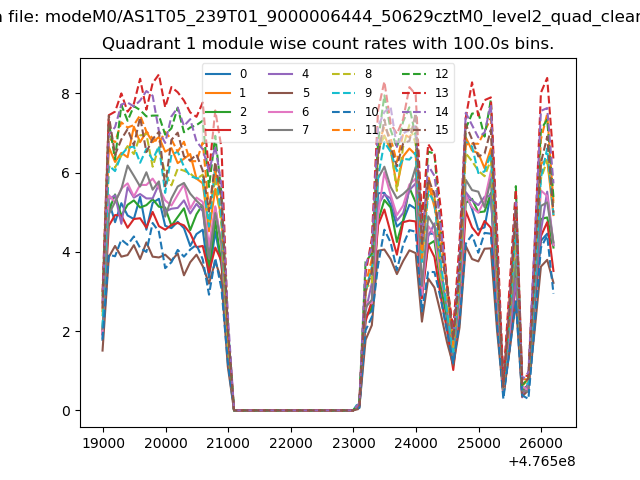
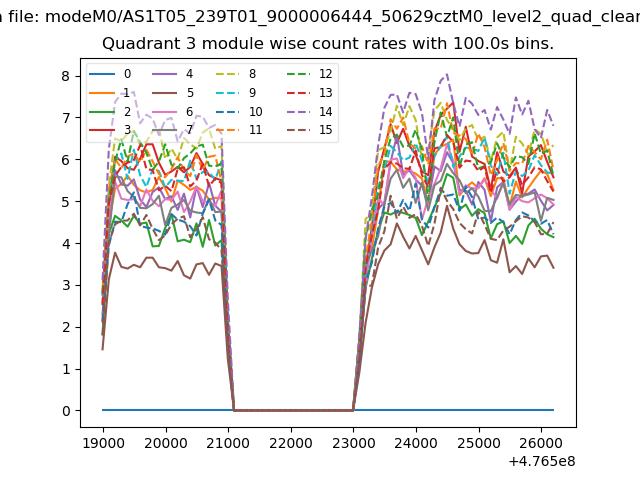
| Module-wise count rates for Quadrant A Data is divided into 100 sec bins |
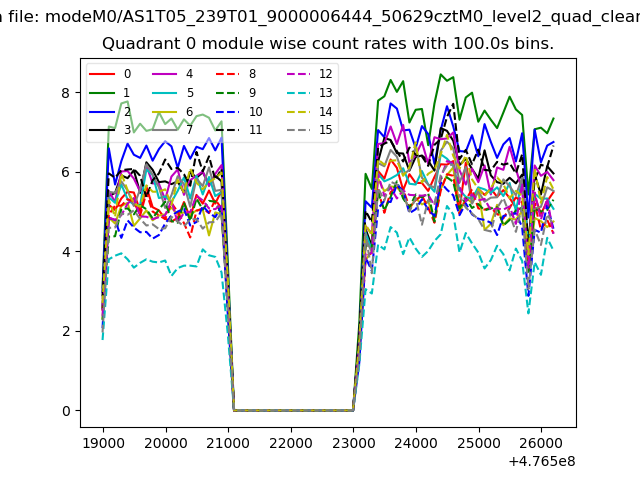 |
 |
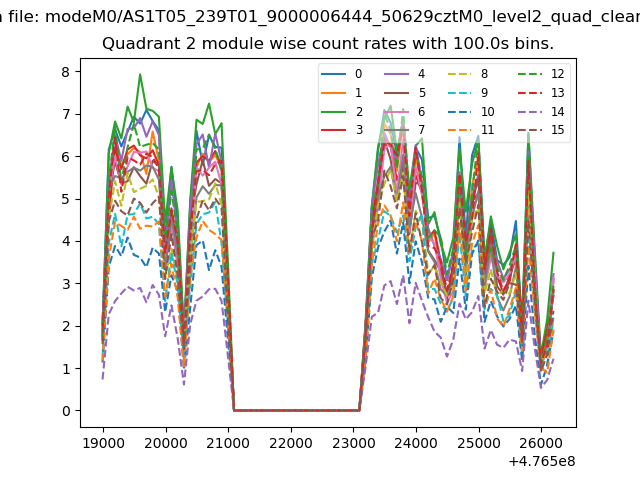
| Module-wise count rates for Quadrant B Data is divided into 100 sec bins |
 |
 |
| Module-wise count rates for Quadrant C Data is divided into 100 sec bins |
 |
 |
| Module-wise count rates for Quadrant D Data is divided into 100 sec bins |
 |
 |
| Parameter | Plot |
|---|---|
| CZT HV Monitor | 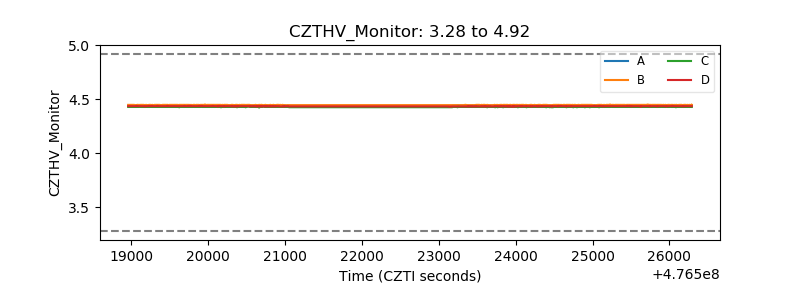 |
| D_VDD | 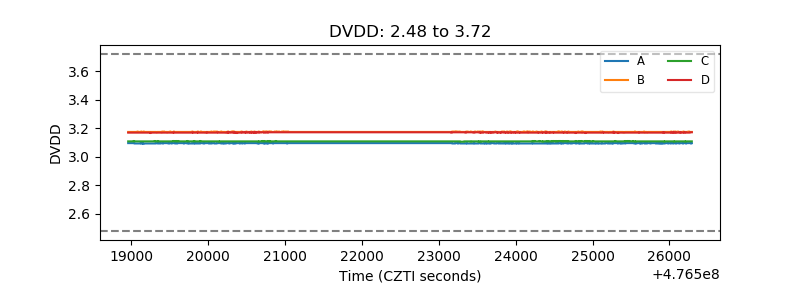 |
| Temperature 1 | 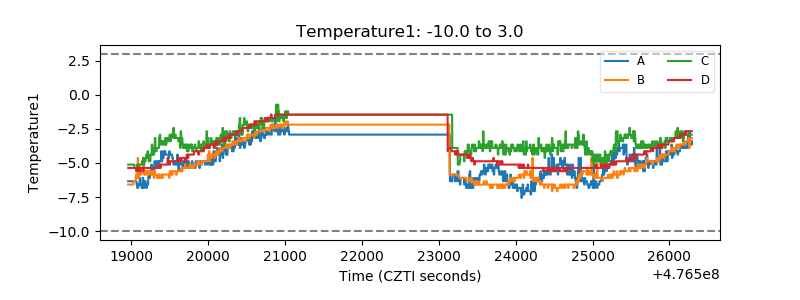 |
| Veto HV Monitor |  |
| Veto LLD | 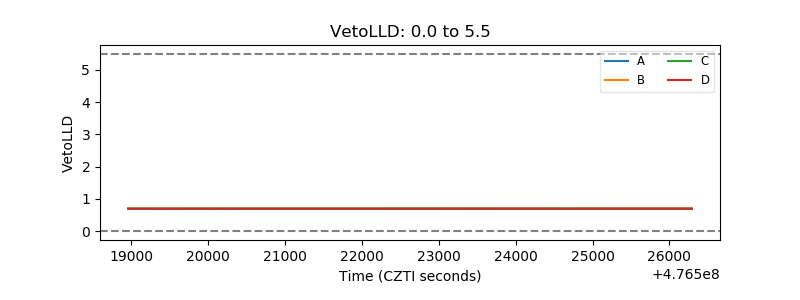 |
| Alpha Counter | 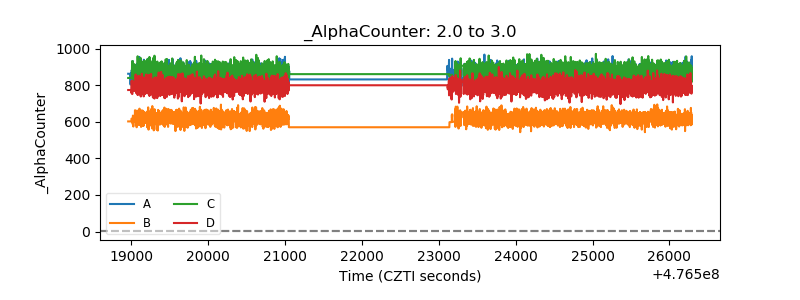 |
| _CPM_Rate | 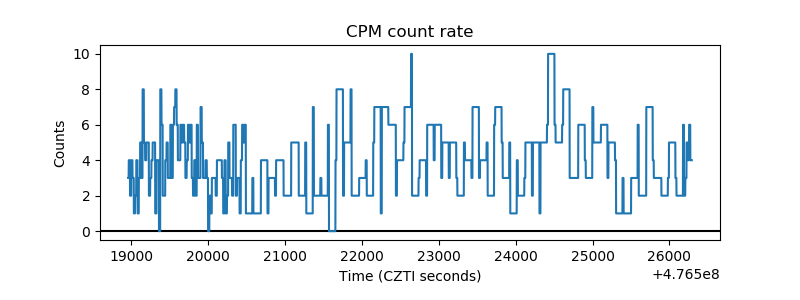 |
| CZT Counter | 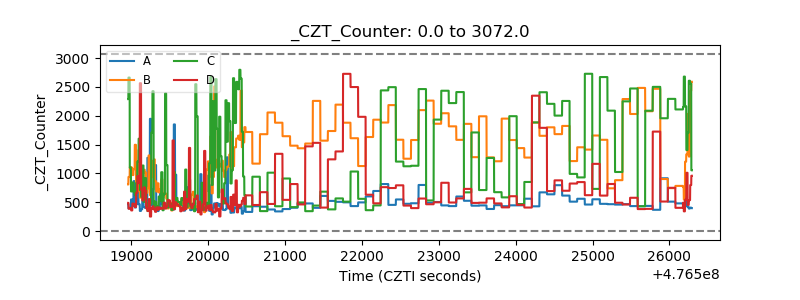 |
| +2.5 Volts monitor |  |
| +5 Volts monitor | 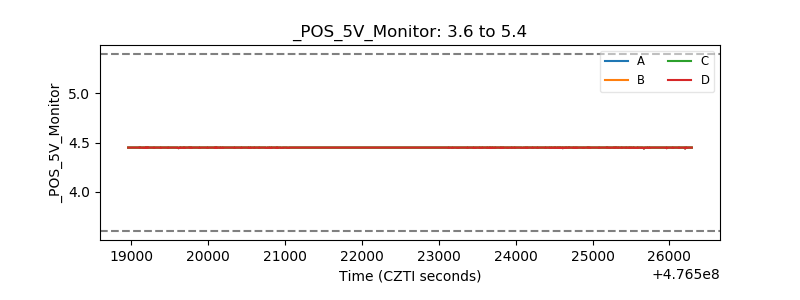 |
| _ROLL_ROT | 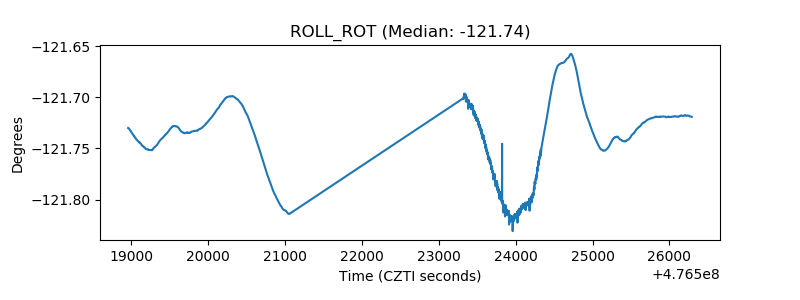 |
| _Roll_DEC | 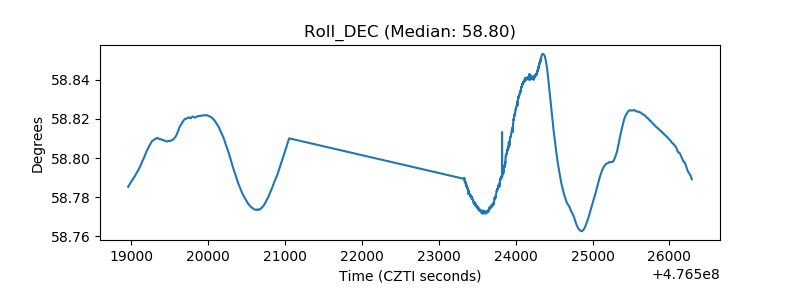 |
| _Roll_RA | 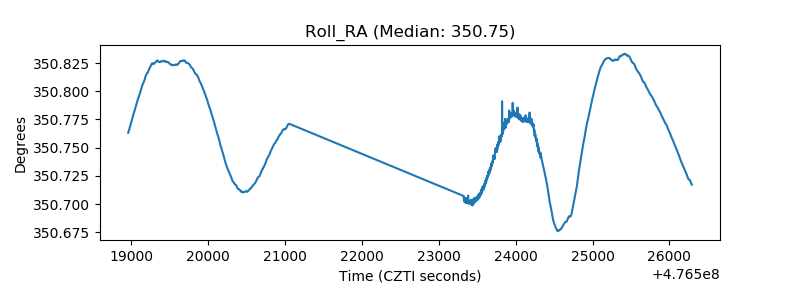 |
| Veto Counter | 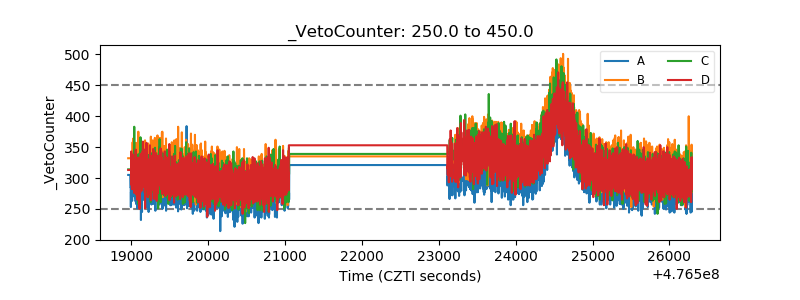 |