| Param | Original file | Final file |
|---|---|---|
| Filename | modeM0/AS1T05_239T01_9000006444_50632cztM0_level2.fits | modeM0/AS1T05_239T01_9000006444_50632cztM0_level2_quad_clean.evt |
| Size (bytes) | 2,624,935,680 | 199,653,120 |
| Size | 2.4 GB | 190.4 MB |
| Events in quadrant A | 12,264,704 | 1,653,904 |
| Events in quadrant B | 34,307,927 | 885,960 |
| Events in quadrant C | 32,865,899 | 750,797 |
| Events in quadrant D | 16,276,872 | 1,454,054 |
| Mode M0 | |||
|---|---|---|---|
| Quadrant | BADHDUFLAG | Total packets | Discarded packets |
| A | 0 | 49048 | 2 |
| B | 0 | 115015 | 2 |
| C | 0 | 110615 | 2 |
| D | 0 | 61512 | 4 |
| Mode M9 | |||
|---|---|---|---|
| Quadrant | BADHDUFLAG | Total packets | Discarded packets |
| A | 0 | 7 | 0 |
| B | 0 | 7 | 0 |
| C | 0 | 7 | 0 |
| D | 0 | 7 | 0 |
| Mode SS | |||
|---|---|---|---|
| Quadrant | BADHDUFLAG | Total packets | Discarded packets |
| A | 0 | 382 | 0 |
| B | 0 | 382 | 0 |
| C | 0 | 382 | 0 |
| D | 0 | 382 | 0 |
| Quadrant | Total seconds | Saturated seconds | Saturation percentage |
|---|---|---|---|
| A | 18836 | 926 | 4.916118% |
| B | 18836 | 10772 | 57.188363% |
| C | 18837 | 11026 | 58.533737% |
| D | 18836 | 1551 | 8.234232% |
Noise dominated data is calculated using 1-second bins in cleaned event files. If a bin has >2000 counts, and if more than 50% of those come from <1% of pixels, then it is considered to be noise-dominated and hence unusable.
| Quadrant | # 1 sec bins | Bins with >0 counts | Bins with >2000 counts | High rate bins dominated by noise | Noise dominated (total time) | Noise dominated (detector-on time) | Marked lightcurve |
|---|---|---|---|---|---|---|---|
| A | 19566 | 18838 | 540 | 540 | 2.76% | 2.87% | 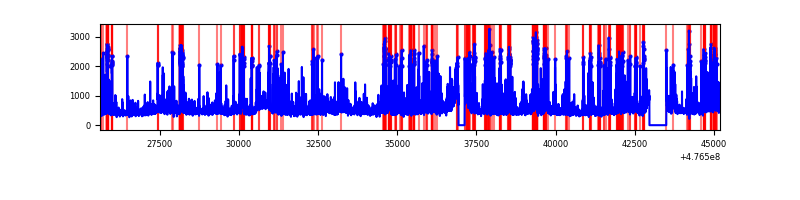 |
| B | 19566 | 18838 | 9268 | 9268 | 47.37% | 49.20% | 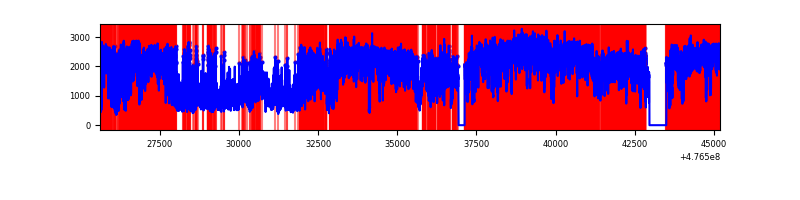 |
| C | 19567 | 18839 | 9608 | 9608 | 49.10% | 51.00% | 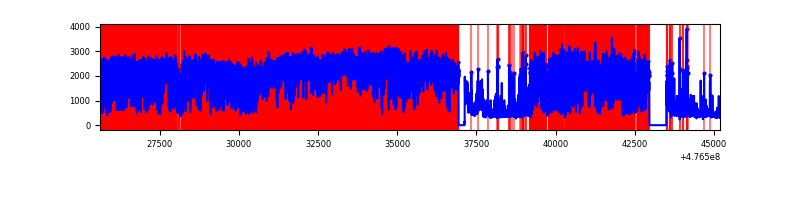 |
| D | 19566 | 18838 | 1427 | 1427 | 7.29% | 7.58% | 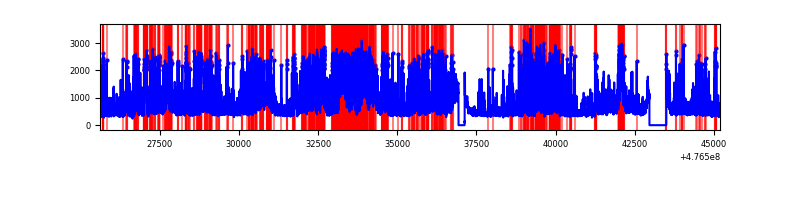 |
Top three noisy pixels from each quadrant. If the there are fewer than three noisy pixels in the level2.evt file, extra rows are filled as -1
| Pixel properties | Quadrant properties | ||||||
|---|---|---|---|---|---|---|---|
| Quadrant | DetID | PixID | Counts | Sigma | Mean | Median | Sigma |
| A | 12 | 250 | 824526 | 1685.44 | 1984 | 1938 | 488.1 |
| A | 4 | 3 | 614851 | 1255.83 | 1984 | 1938 | 488.1 |
| A | 6 | 161 | 445148 | 908.12 | 1984 | 1938 | 488.1 |
| B | 4 | 170 | 24938272 | 72483.52 | 1609 | 1554 | 344.0 |
| B | 5 | 172 | 607298 | 1760.72 | 1609 | 1554 | 344.0 |
| B | 5 | 185 | 565774 | 1640.02 | 1609 | 1554 | 344.0 |
| C | 15 | 174 | 19373169 | 50633.48 | 1365 | 1354 | 382.6 |
| C | 15 | 148 | 931520 | 2431.24 | 1365 | 1354 | 382.6 |
| C | 4 | 5 | 880118 | 2296.89 | 1365 | 1354 | 382.6 |
| D | 7 | 60 | 1061515 | 2002.36 | 1909 | 1845 | 529.2 |
| D | 2 | 249 | 876816 | 1653.35 | 1909 | 1845 | 529.2 |
| D | 7 | 126 | 670966 | 1264.38 | 1909 | 1845 | 529.2 |
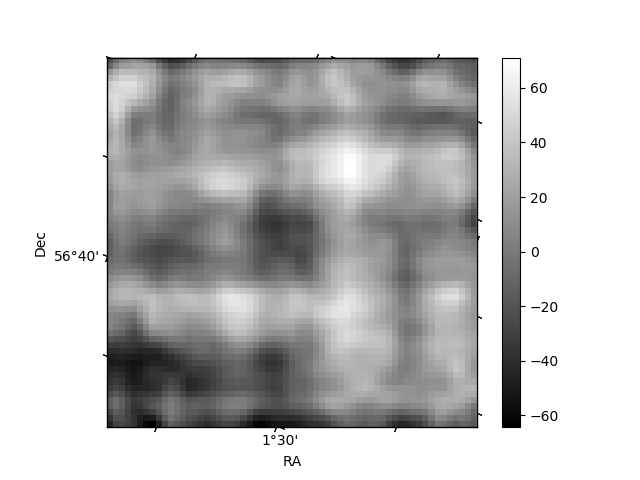
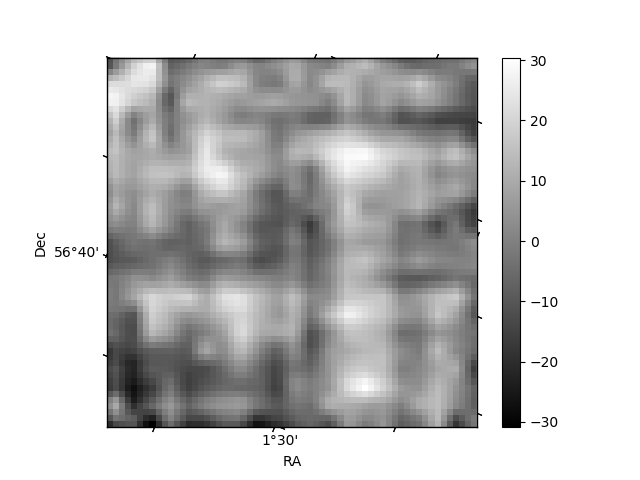
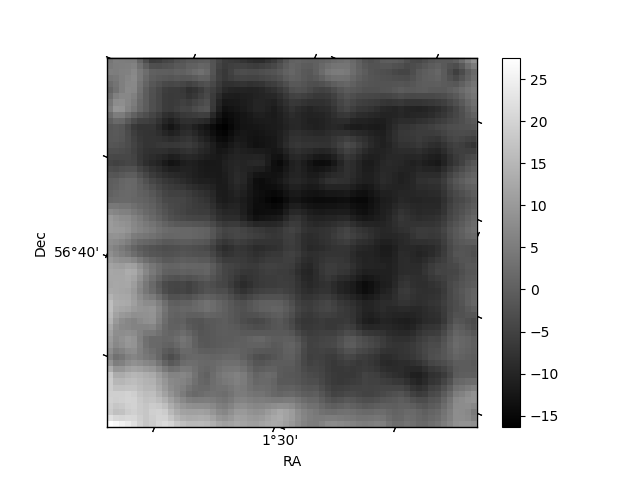
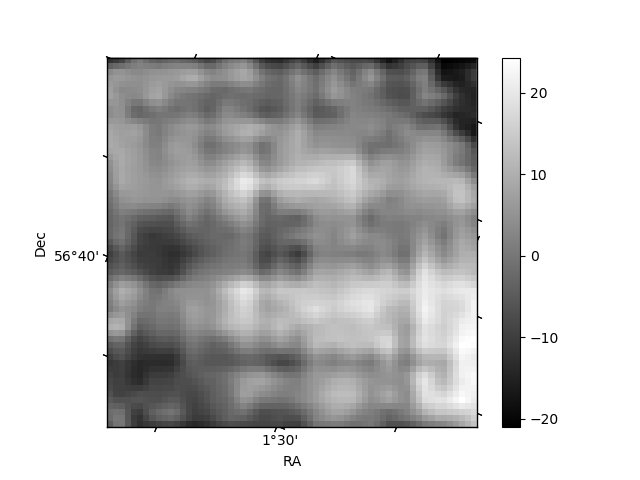
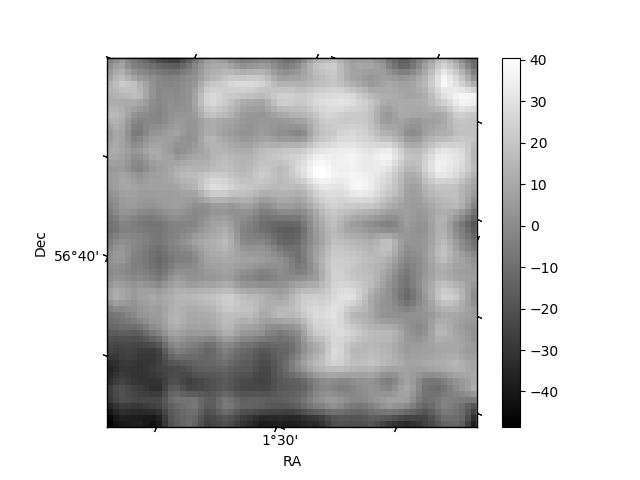
Histogram calculated using DETX and DETY for each event in the final _common_clean file
| Quadrant A | 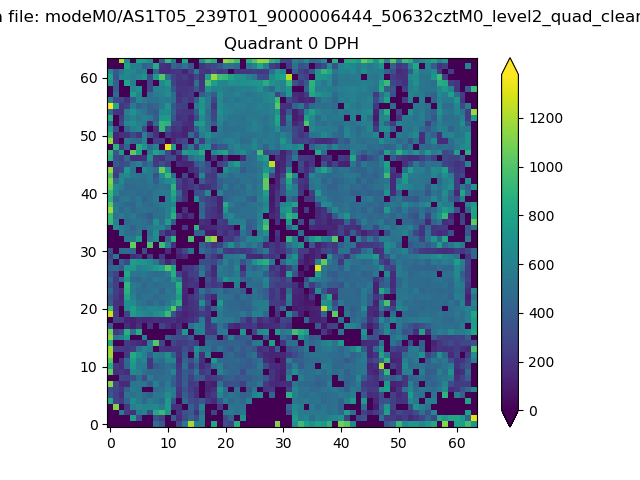 |
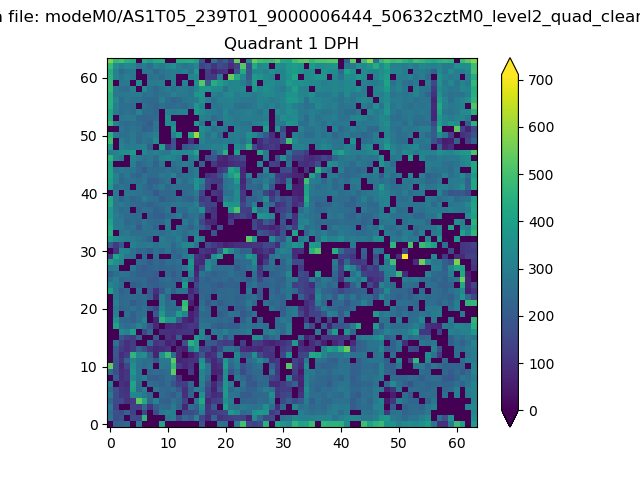 |
Quadrant B |
|---|---|---|---|
| Quadrant D | 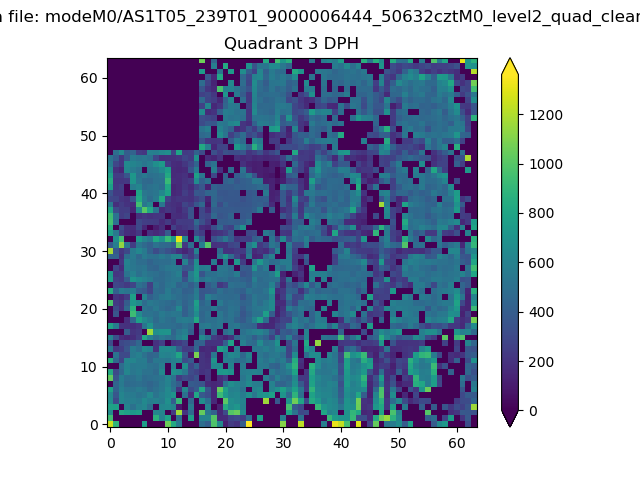 |
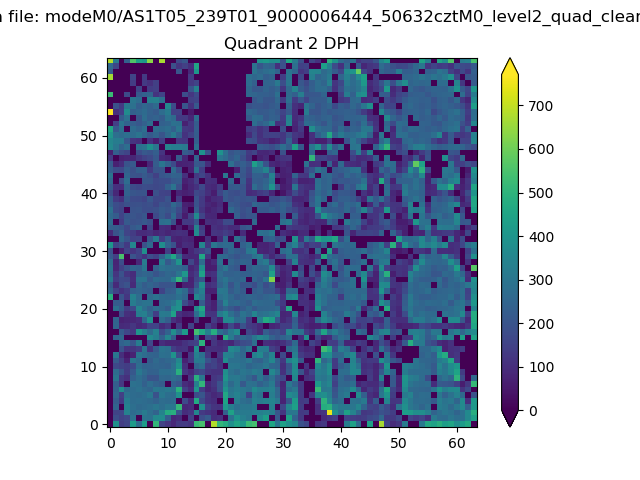 |
Quadrant C |
| Plot type | Count rate plots | Images |
|---|---|---|
| Comparison with Poisson distribution Blue bars denote a histogram of data divided into 1 sec bins. Red curve is a Poisson curve with rate = median count rate of data. |
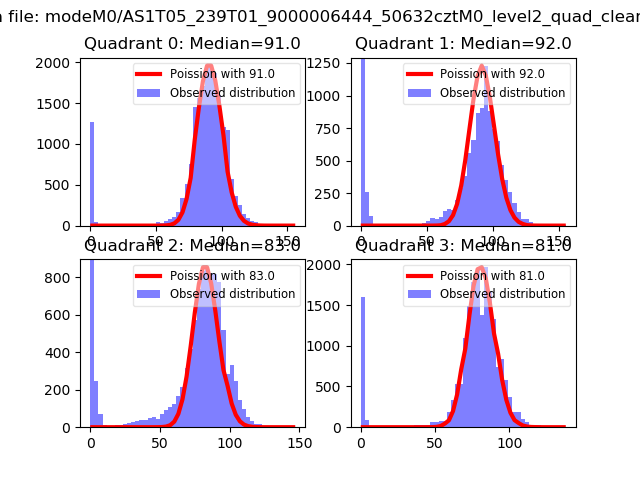 |
 |
| Quadrant-wise count rates Data is divided into 100 sec bins |
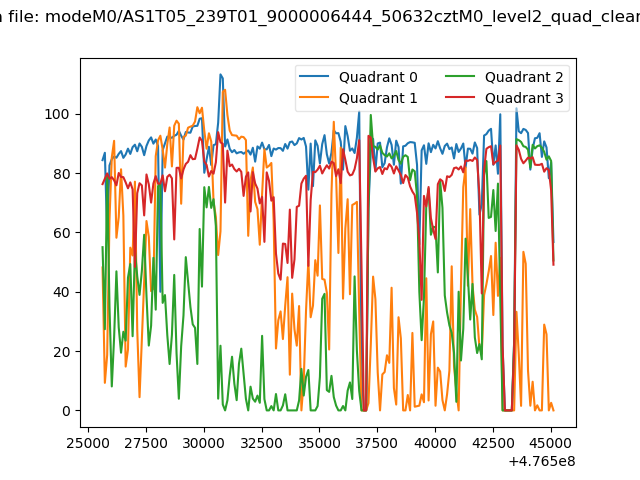 |
|
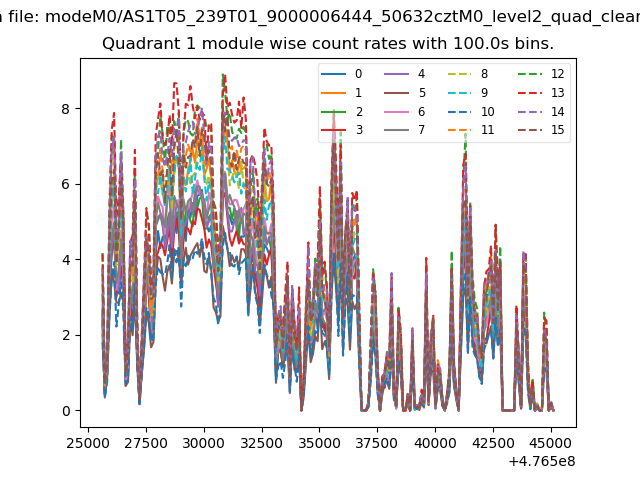
| Module-wise count rates for Quadrant A Data is divided into 100 sec bins |
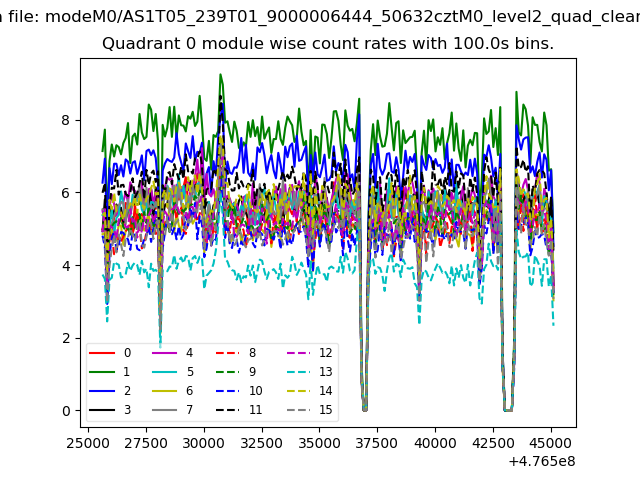 |
 |
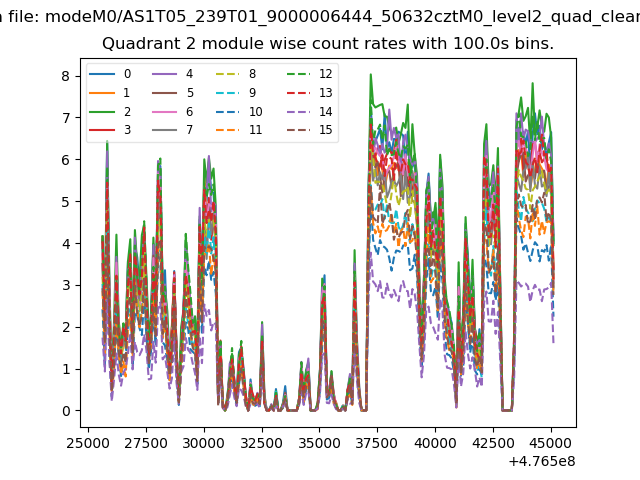
| Module-wise count rates for Quadrant B Data is divided into 100 sec bins |
 |
 |
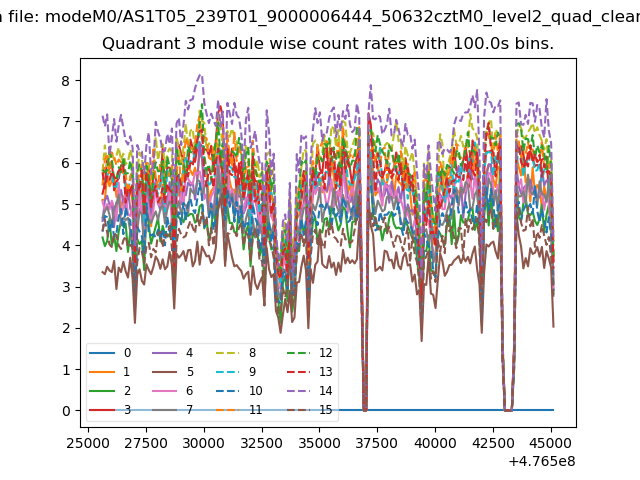
| Module-wise count rates for Quadrant C Data is divided into 100 sec bins |
 |
 |
| Module-wise count rates for Quadrant D Data is divided into 100 sec bins |
 |
 |
| Parameter | Plot |
|---|---|
| CZT HV Monitor | 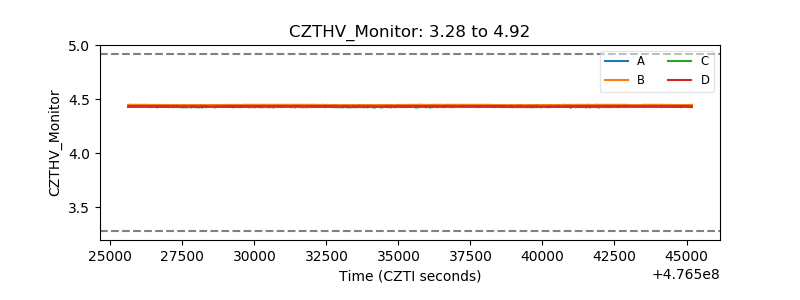 |
| D_VDD | 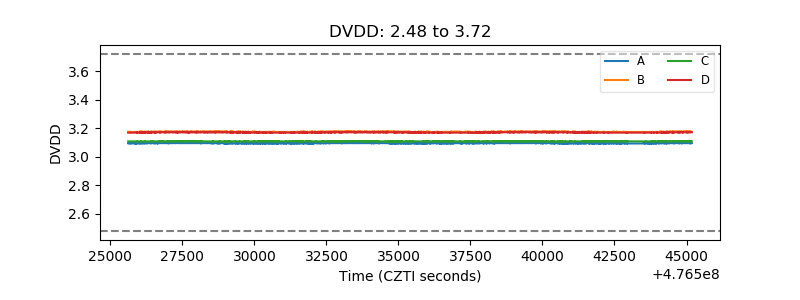 |
| Temperature 1 | 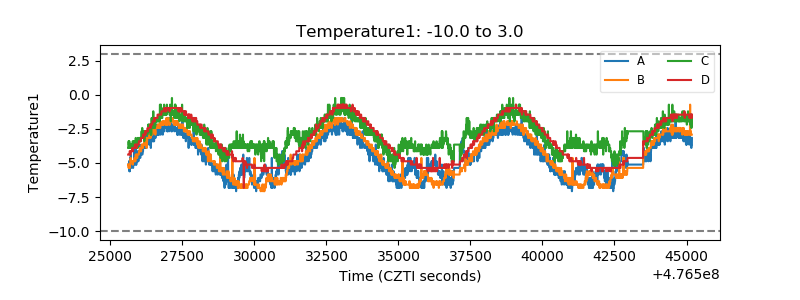 |
| Veto HV Monitor | 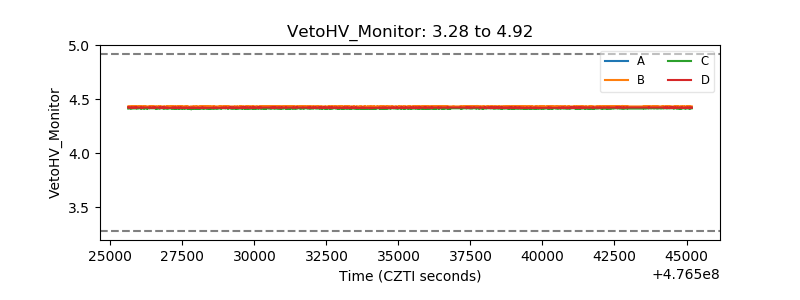 |
| Veto LLD | 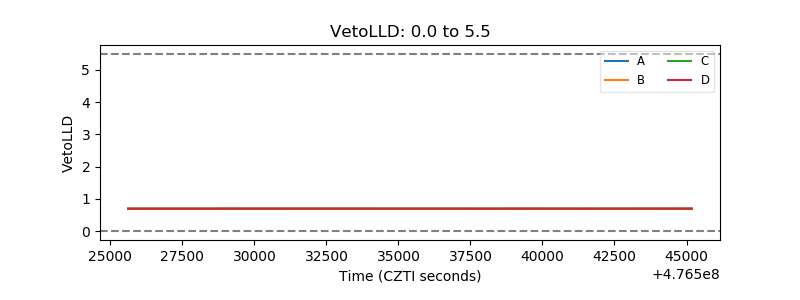 |
| Alpha Counter | 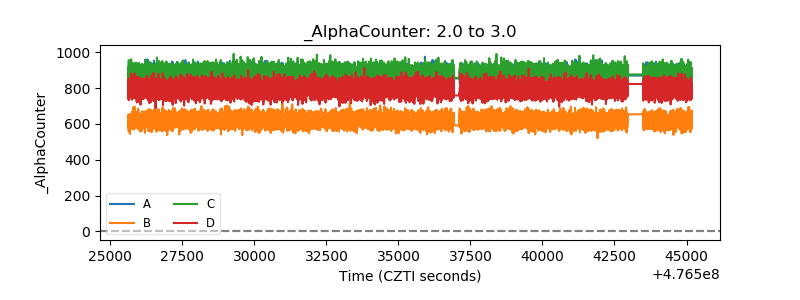 |
| _CPM_Rate | 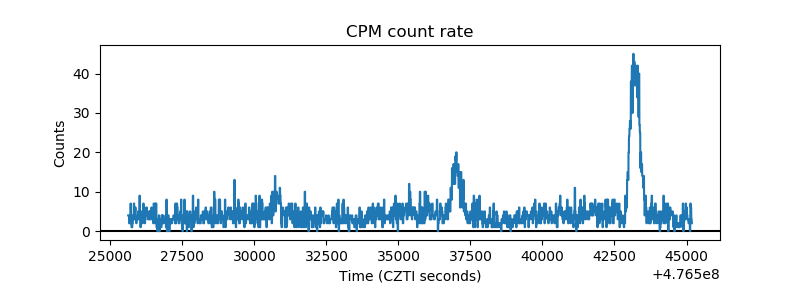 |
| CZT Counter | 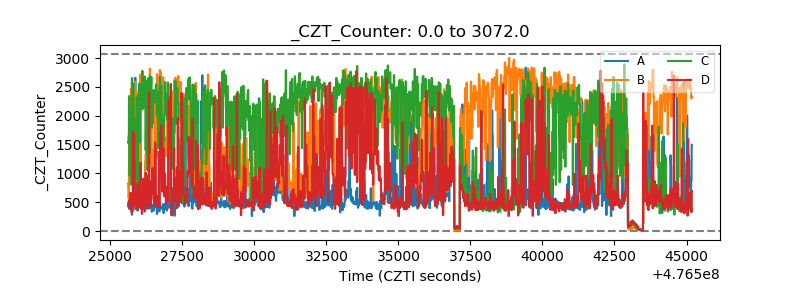 |
| +2.5 Volts monitor |  |
| +5 Volts monitor | 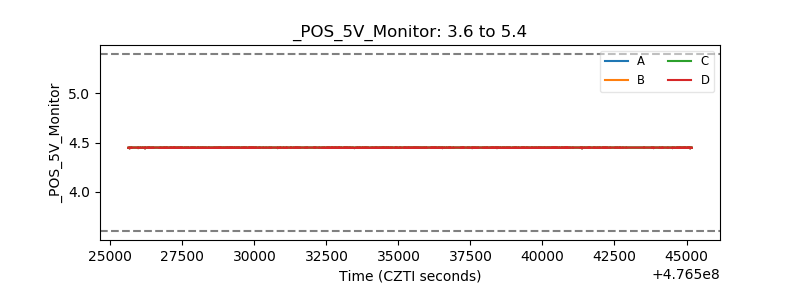 |
| _ROLL_ROT | 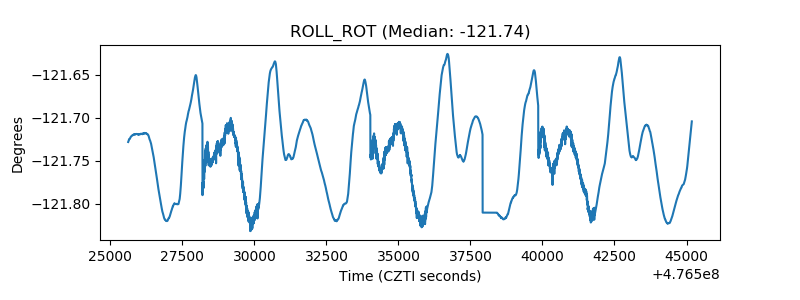 |
| _Roll_DEC | 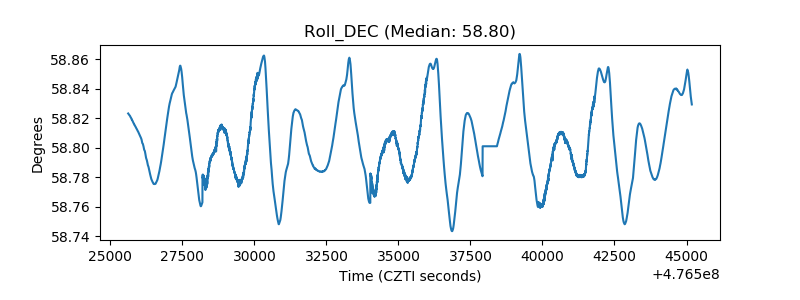 |
| _Roll_RA | 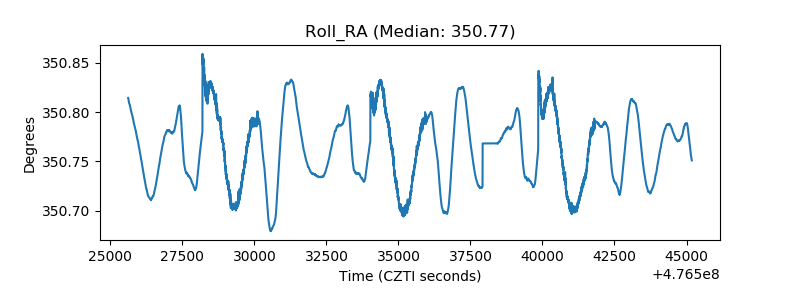 |
| Veto Counter | 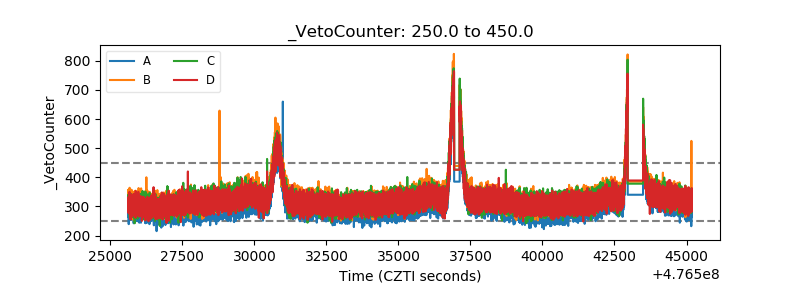 |