| Param | Original file | Final file |
|---|---|---|
| Filename | modeM0/AS1T05_239T01_9000006444_50633cztM0_level2.fits | modeM0/AS1T05_239T01_9000006444_50633cztM0_level2_quad_clean.evt |
| Size (bytes) | 761,264,640 | 77,526,720 |
| Size | 726.0 MB | 73.9 MB |
| Events in quadrant A | 4,233,060 | 604,797 |
| Events in quadrant B | 14,047,929 | 169,088 |
| Events in quadrant C | 5,303,431 | 559,931 |
| Events in quadrant D | 4,079,279 | 549,896 |
| Mode M0 | |||
|---|---|---|---|
| Quadrant | BADHDUFLAG | Total packets | Discarded packets |
| A | 0 | 16997 | 1 |
| B | 0 | 46230 | 1 |
| C | 0 | 20427 | 1 |
| D | 0 | 16773 | 1 |
| Mode M9 | |||
|---|---|---|---|
| Quadrant | BADHDUFLAG | Total packets | Discarded packets |
| A | 0 | 7 | 0 |
| B | 0 | 7 | 0 |
| C | 0 | 7 | 0 |
| D | 0 | 7 | 0 |
| Mode SS | |||
|---|---|---|---|
| Quadrant | BADHDUFLAG | Total packets | Discarded packets |
| A | 0 | 136 | 0 |
| B | 0 | 136 | 0 |
| C | 0 | 136 | 0 |
| D | 0 | 136 | 0 |
| Quadrant | Total seconds | Saturated seconds | Saturation percentage |
|---|---|---|---|
| A | 6643 | 214 | 3.221436% |
| B | 6643 | 5252 | 79.060665% |
| C | 6643 | 528 | 7.948216% |
| D | 6643 | 145 | 2.182749% |
Noise dominated data is calculated using 1-second bins in cleaned event files. If a bin has >2000 counts, and if more than 50% of those come from <1% of pixels, then it is considered to be noise-dominated and hence unusable.
| Quadrant | # 1 sec bins | Bins with >0 counts | Bins with >2000 counts | High rate bins dominated by noise | Noise dominated (total time) | Noise dominated (detector-on time) | Marked lightcurve |
|---|---|---|---|---|---|---|---|
| A | 7413 | 6644 | 147 | 147 | 1.98% | 2.21% | 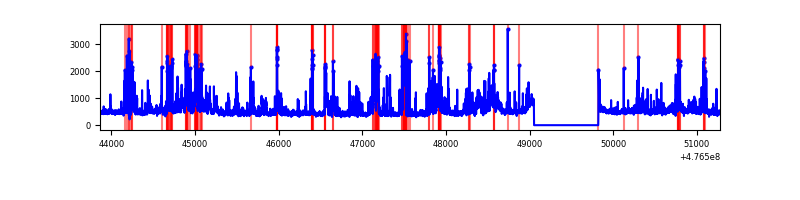 |
| B | 7413 | 6644 | 4716 | 4716 | 63.62% | 70.98% | 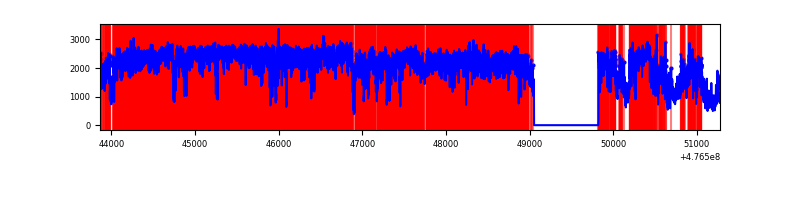 |
| C | 7413 | 6644 | 444 | 444 | 5.99% | 6.68% | 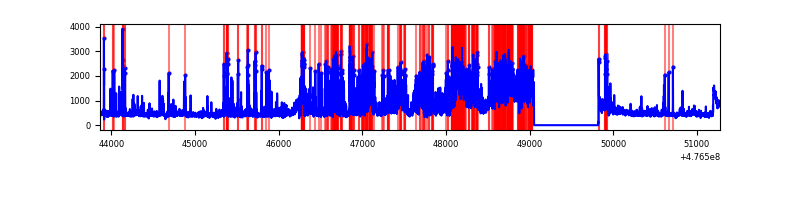 |
| D | 7413 | 6644 | 129 | 129 | 1.74% | 1.94% | 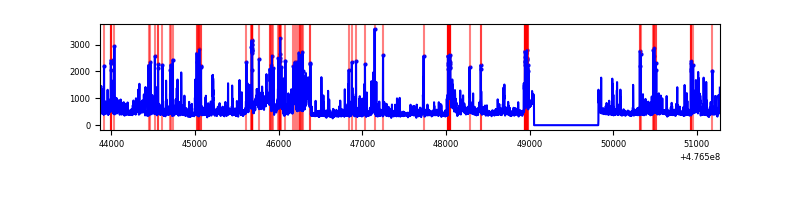 |
Top three noisy pixels from each quadrant. If the there are fewer than three noisy pixels in the level2.evt file, extra rows are filled as -1
| Pixel properties | Quadrant properties | ||||||
|---|---|---|---|---|---|---|---|
| Quadrant | DetID | PixID | Counts | Sigma | Mean | Median | Sigma |
| A | 12 | 250 | 370886 | 2187.82 | 691 | 674 | 169.2 |
| A | 4 | 3 | 184440 | 1085.99 | 691 | 674 | 169.2 |
| A | 8 | 247 | 179734 | 1058.18 | 691 | 674 | 169.2 |
| B | 4 | 170 | 10823946 | 100917.32 | 496 | 480 | 107.3 |
| B | 5 | 172 | 710192 | 6617.31 | 496 | 480 | 107.3 |
| B | 5 | 185 | 144029 | 1338.44 | 496 | 480 | 107.3 |
| C | 15 | 174 | 1315966 | 7220.43 | 661 | 656 | 182.2 |
| C | 15 | 127 | 407784 | 2234.94 | 661 | 656 | 182.2 |
| C | 0 | 176 | 206490 | 1129.93 | 661 | 656 | 182.2 |
| D | 8 | 246 | 289383 | 1530.94 | 673 | 648 | 188.6 |
| D | 2 | 249 | 154804 | 817.37 | 673 | 648 | 188.6 |
| D | 7 | 96 | 135945 | 717.37 | 673 | 648 | 188.6 |
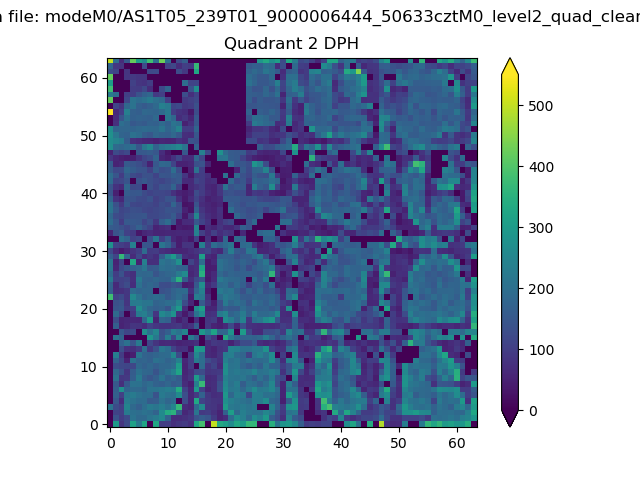
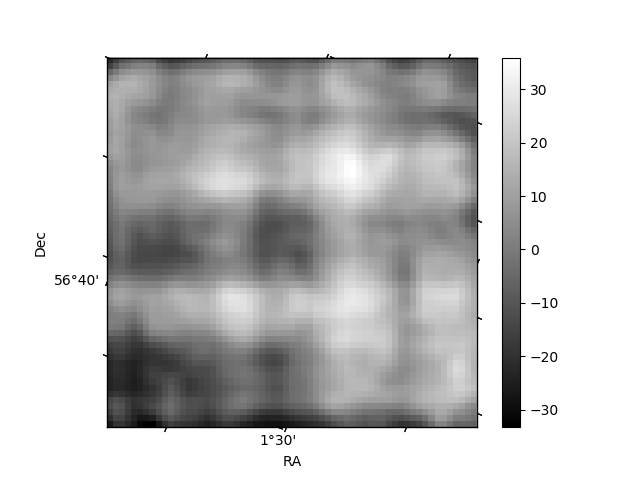
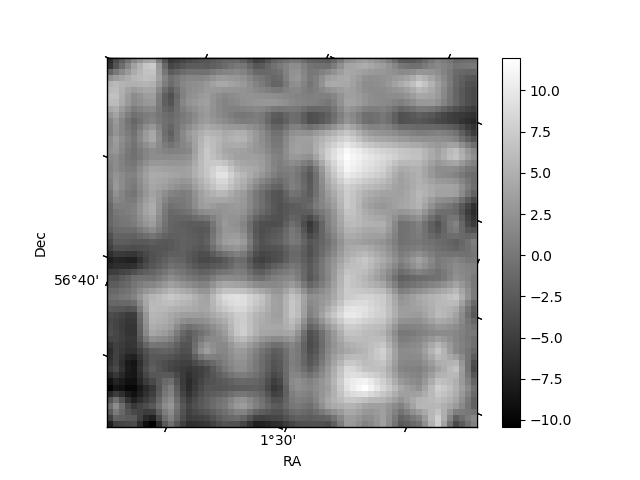
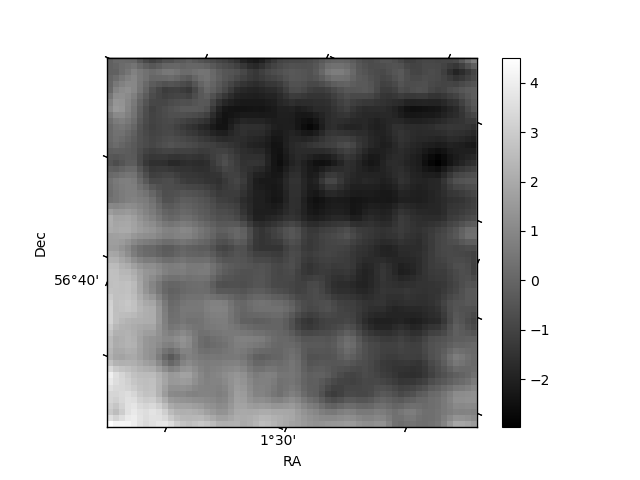
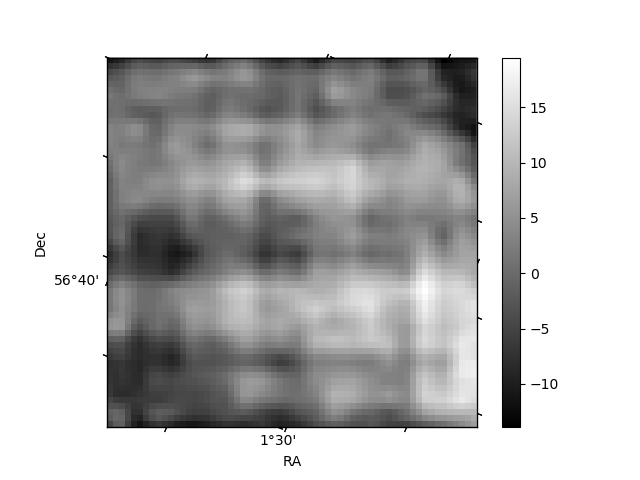
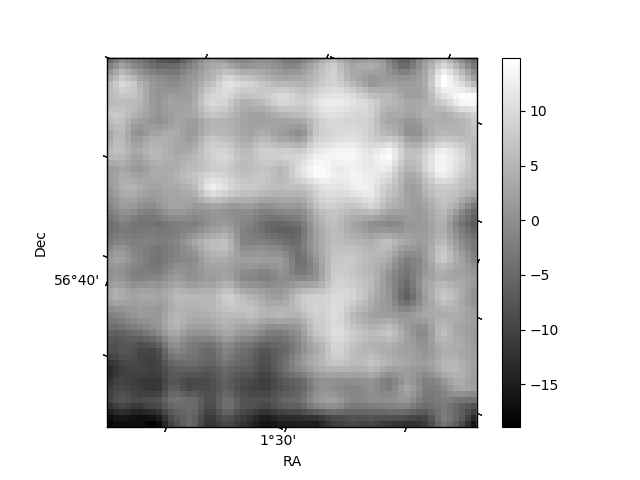
Histogram calculated using DETX and DETY for each event in the final _common_clean file
| Quadrant A | 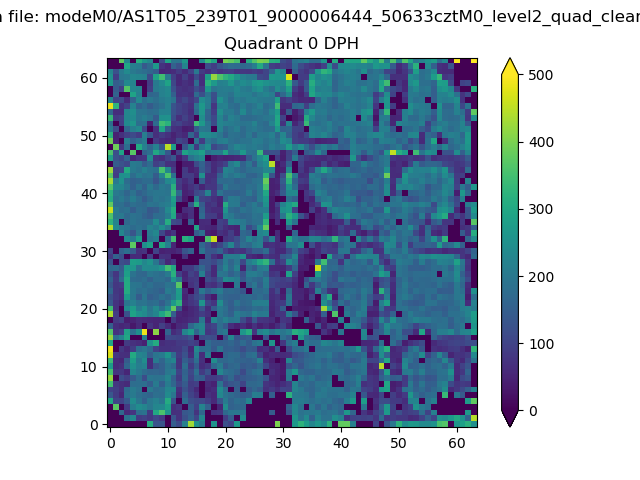 |
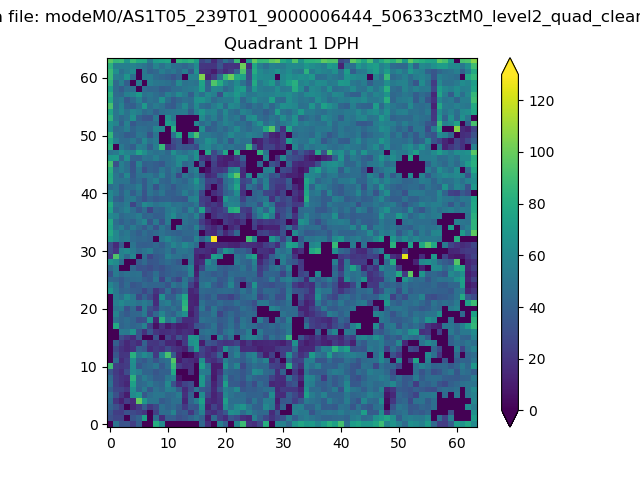 |
Quadrant B |
|---|---|---|---|
| Quadrant D | 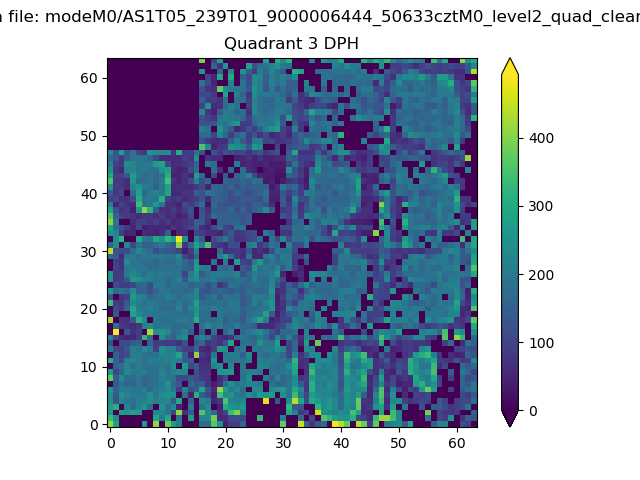 |
 |
Quadrant C |
| Plot type | Count rate plots | Images |
|---|---|---|
| Comparison with Poisson distribution Blue bars denote a histogram of data divided into 1 sec bins. Red curve is a Poisson curve with rate = median count rate of data. |
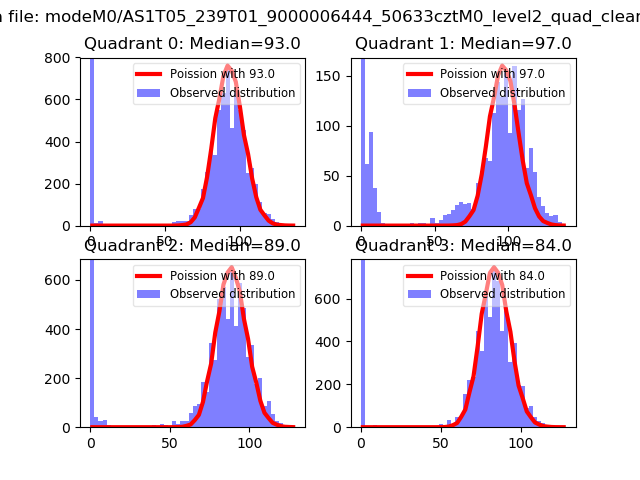 |
 |
| Quadrant-wise count rates Data is divided into 100 sec bins |
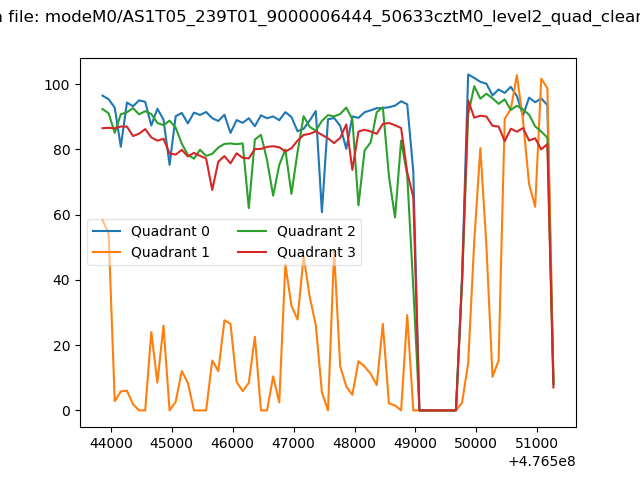 |
|
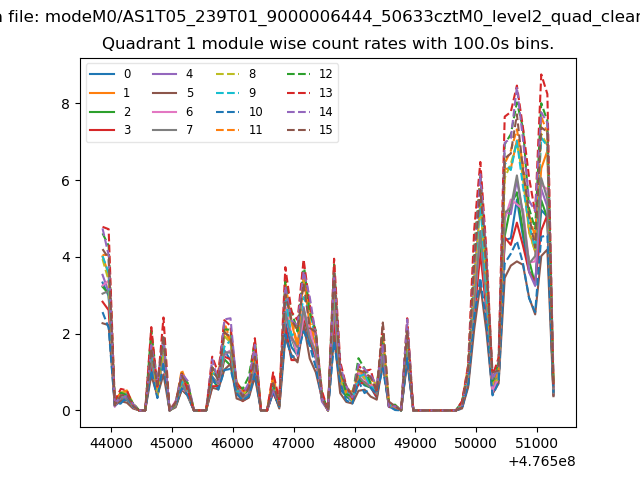
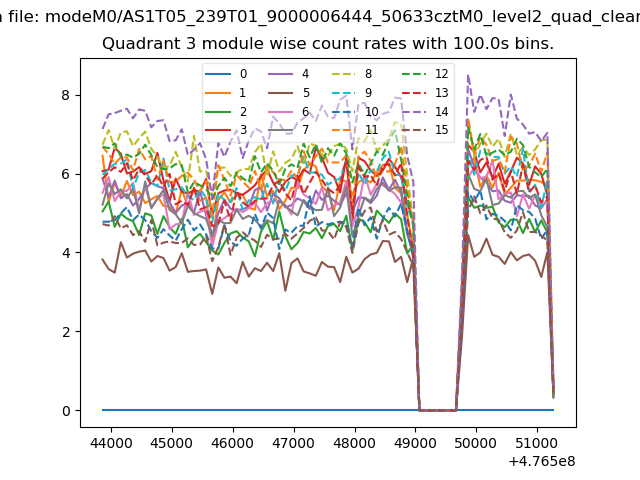
| Module-wise count rates for Quadrant A Data is divided into 100 sec bins |
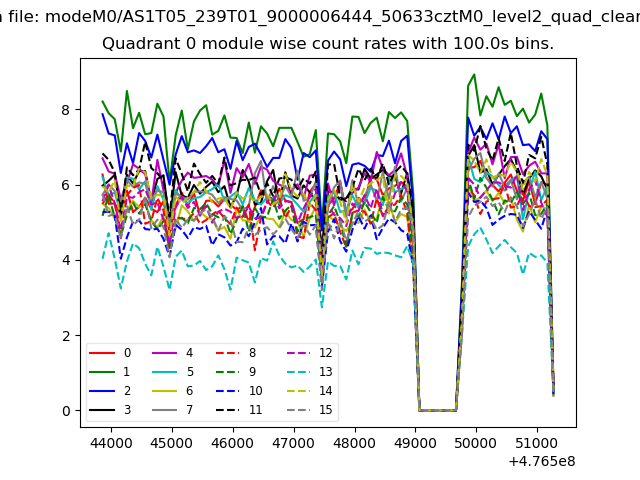 |
 |
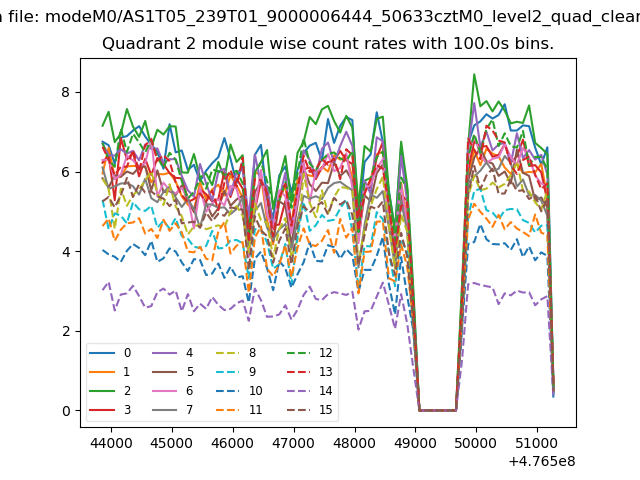
| Module-wise count rates for Quadrant B Data is divided into 100 sec bins |
 |
 |
| Module-wise count rates for Quadrant C Data is divided into 100 sec bins |
 |
 |
| Module-wise count rates for Quadrant D Data is divided into 100 sec bins |
 |
 |
| Parameter | Plot |
|---|---|
| CZT HV Monitor |  |
| D_VDD | 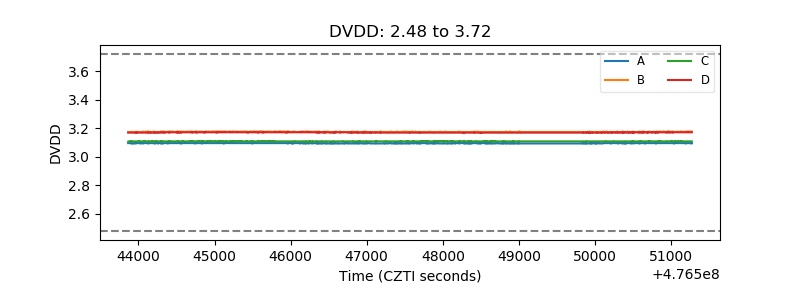 |
| Temperature 1 | 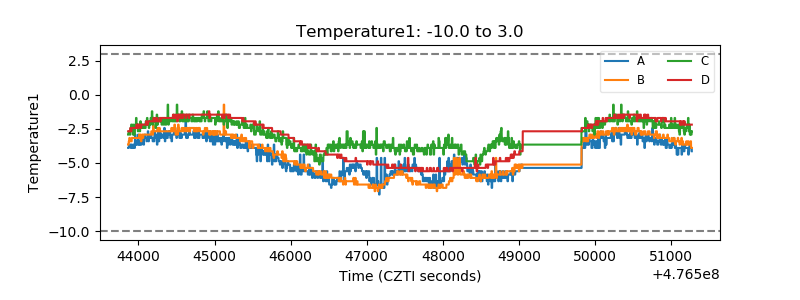 |
| Veto HV Monitor | 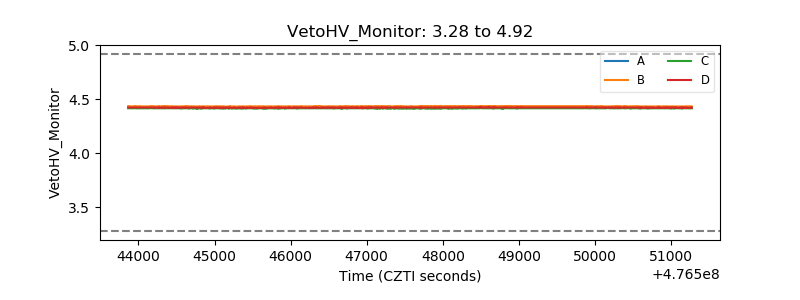 |
| Veto LLD | 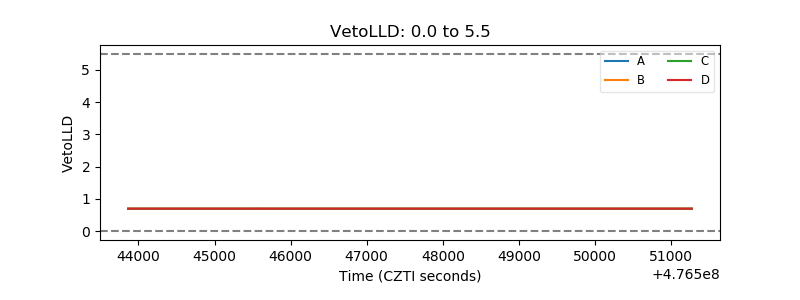 |
| Alpha Counter | 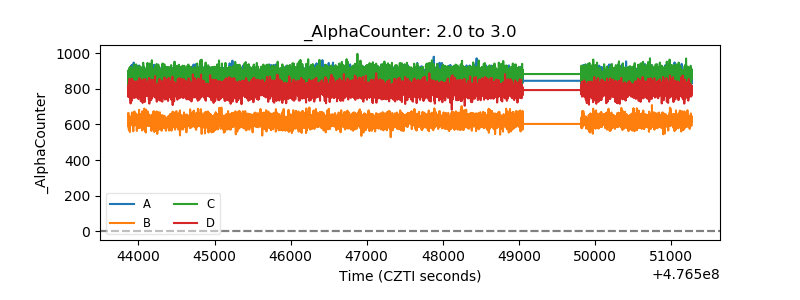 |
| _CPM_Rate | 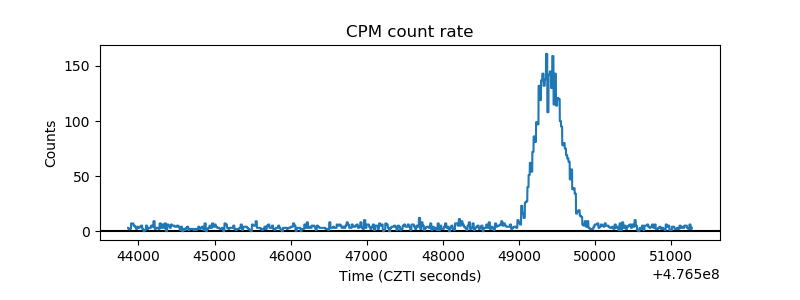 |
| CZT Counter | 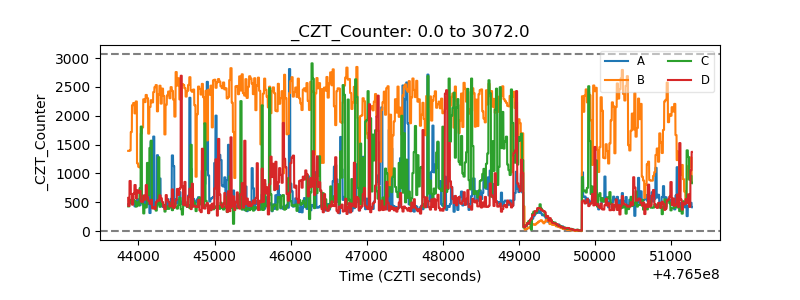 |
| +2.5 Volts monitor |  |
| +5 Volts monitor | 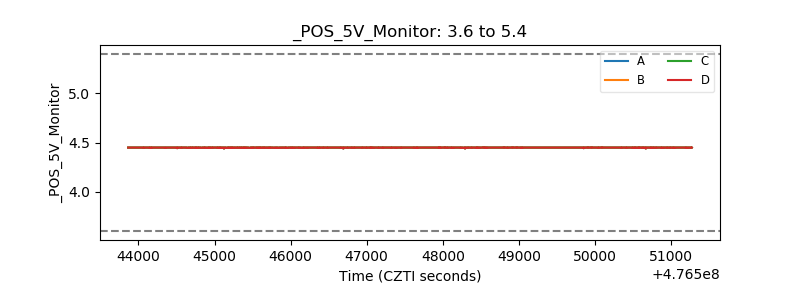 |
| _ROLL_ROT | 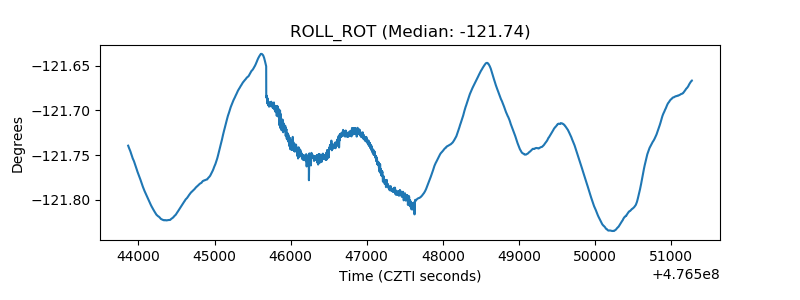 |
| _Roll_DEC | 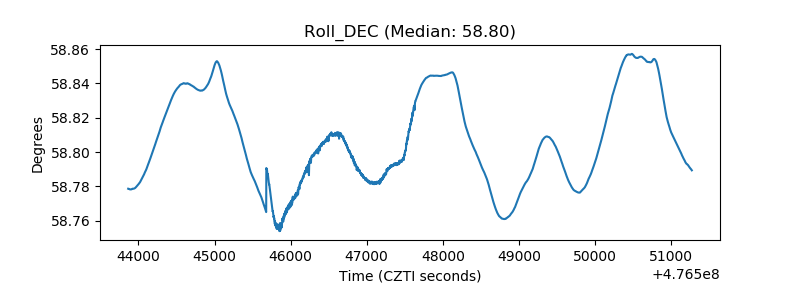 |
| _Roll_RA | 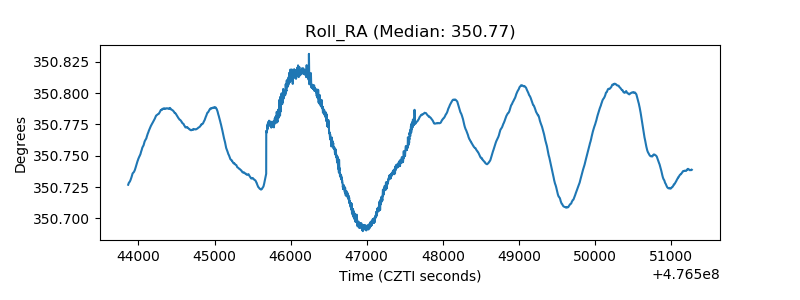 |
| Veto Counter | 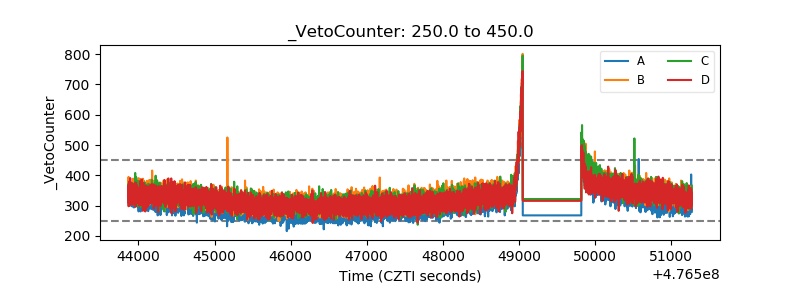 |